Executive Summary:
- Digital Assets have experienced significant sell-side pressure in recent weeks, with Bitcoin tumbling by -28%, and Ethereum and Solana prices collapsing by more than -50% since their cycle highs.
- As the market sells off, realized losses have increased massively, recording the second largest loss taking event of the cycle, and underscoring the severity of the correction.
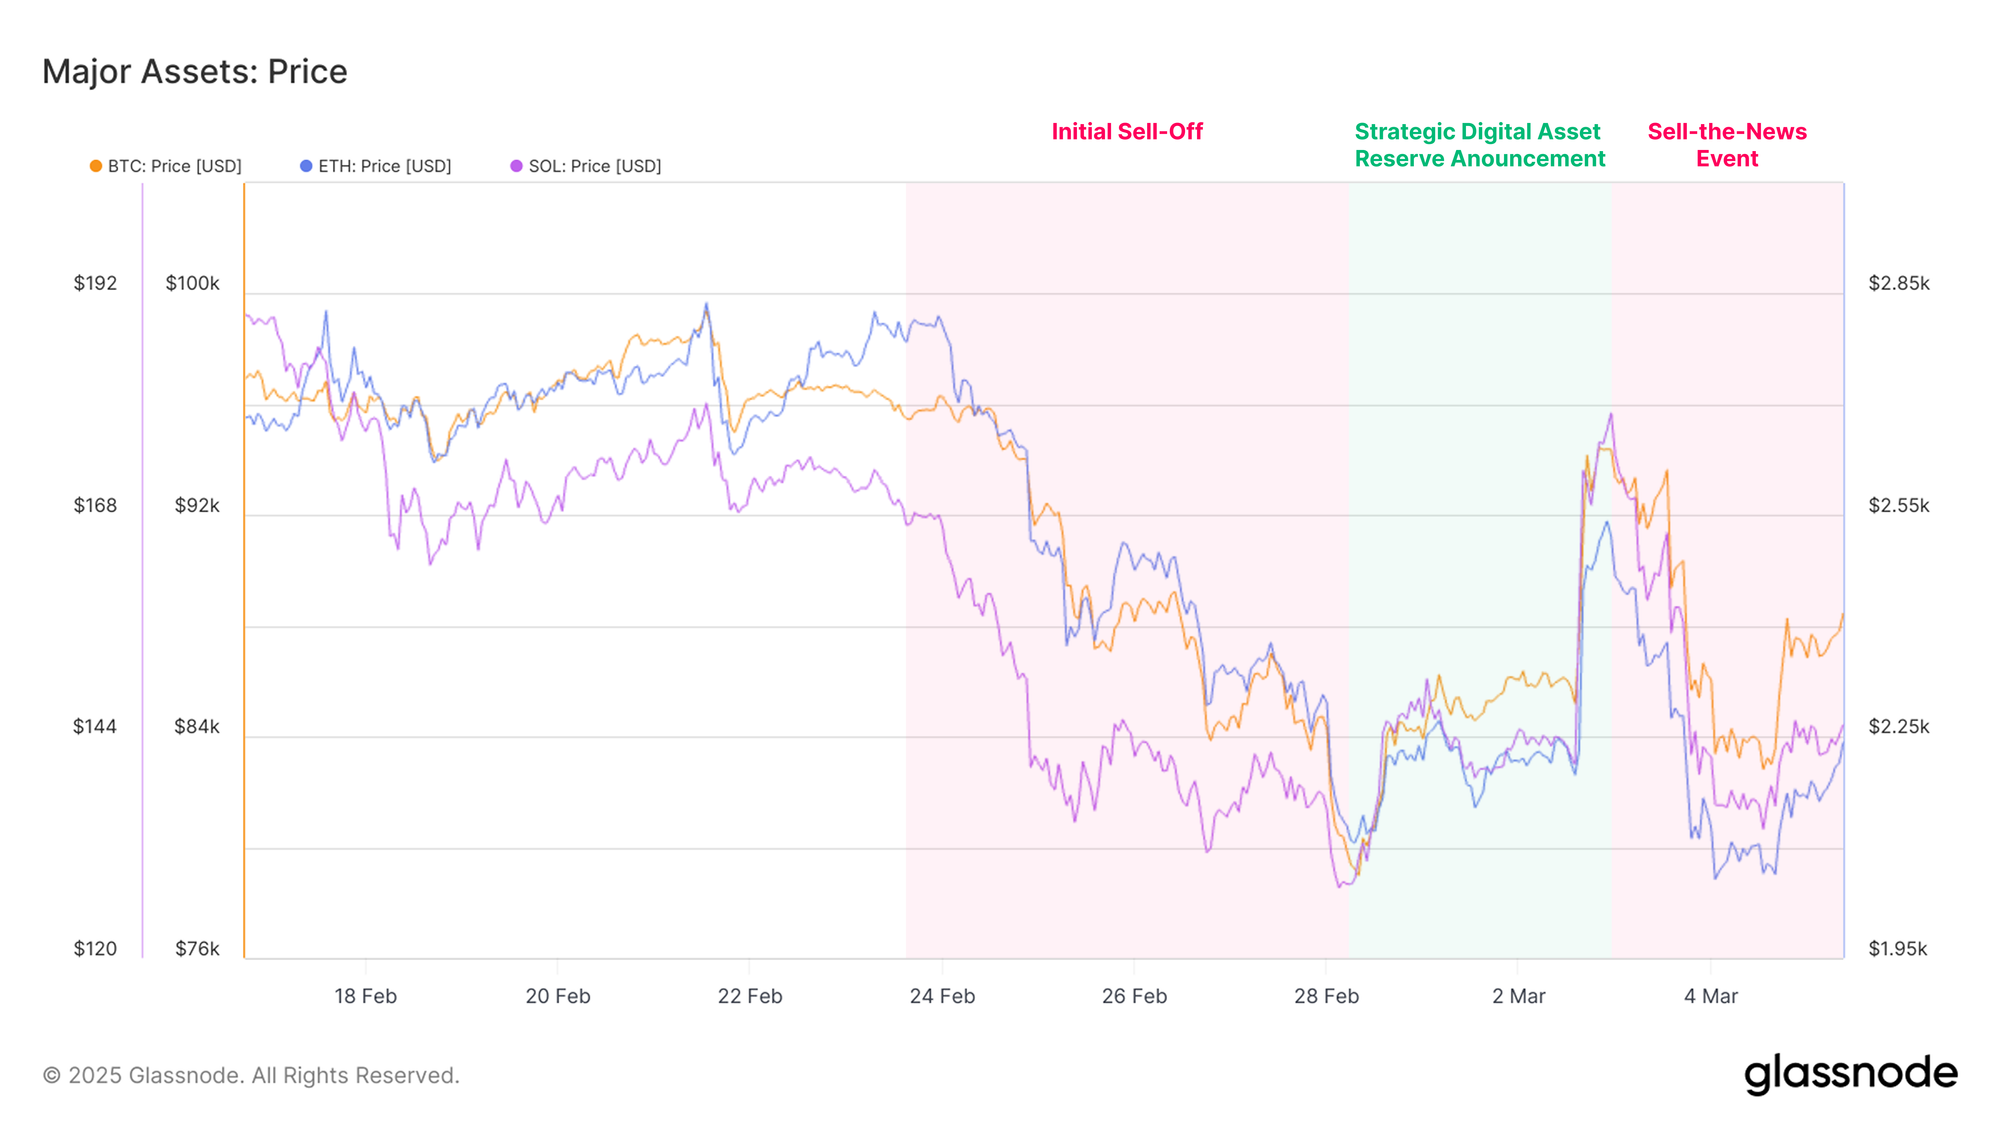
- The major digital assets did rebound briefly following the announcement of a Strategic Digital Asset Reserve by President Trump. However, this turned out to be another ‘sell-the-news’ event, with prices continuing to fall, and trading below their pre-announcement levels.
- Strong confluence between price structure and key on-chain metrics indicate that the $92k remains a critical level for Bitcoin to re-establish upwards momentum, whilst the ~$70k level appears to be a key zone for the bulls to build support if reached.
Violent Volatility
Liquidity in the broader economy continues to contract, as evidenced by the multi-month uptrend in the US Dollar Index (DXY). As assets which trade 24/7, digital assets are often some of the first prices to respond to contractions in liquidity, often acting as a leading signal for other markets.
Over the weekend, President Trump announced that plans for a Strategic Digital Asset Reserve were underway, which would include BTC, ETH, SOL, ADA and XRP. This resulted in a brief, but strong resurgence of market strength, with prices rallying sharply.
However, in the days that followed, each asset largely retraced this move, turning into a classic sell-the-news event, as prices collapsed back below their pre-announcement levels.
Bitcoin remains the most resilient of the mix, with its deeper liquidity profile and market size making large market movements harder to achieve. However, both Ethereum and Solana, the second and third most prominent digital assets, experienced quite sharp devaluations, being down over 50% from their cycle highs.
Volatility Releases
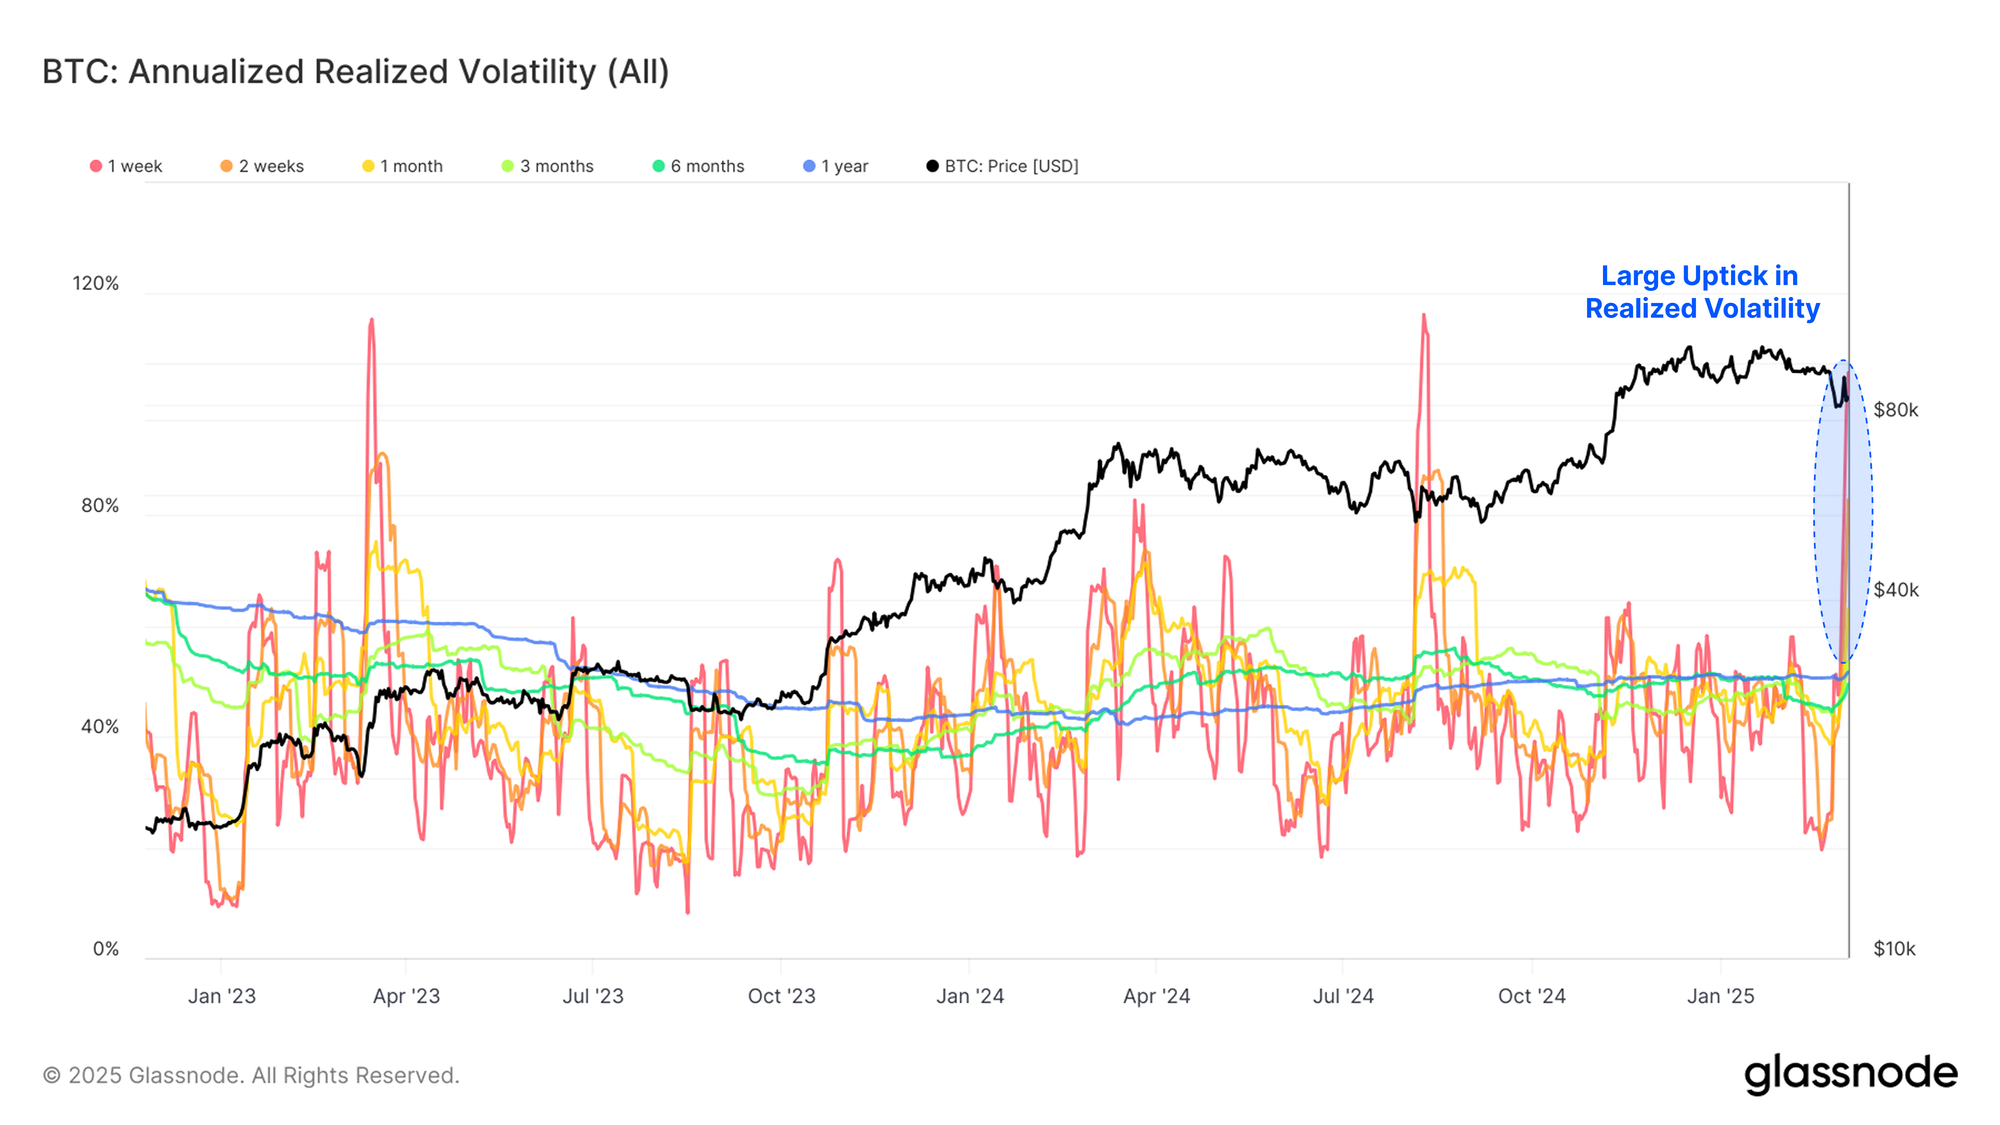
As demonstrated by this intense whipsaw in price action, this has led to very turbulent conditions over the last two weeks against a backdrop of an uncertain political environment.
We can see that realized volatility for Bitcoin surged across several time-frames. From this perspective, the 1-week and 2-week rolling windows have recorded some of the highest volatility values of the cycle so far, exceeding 80%.
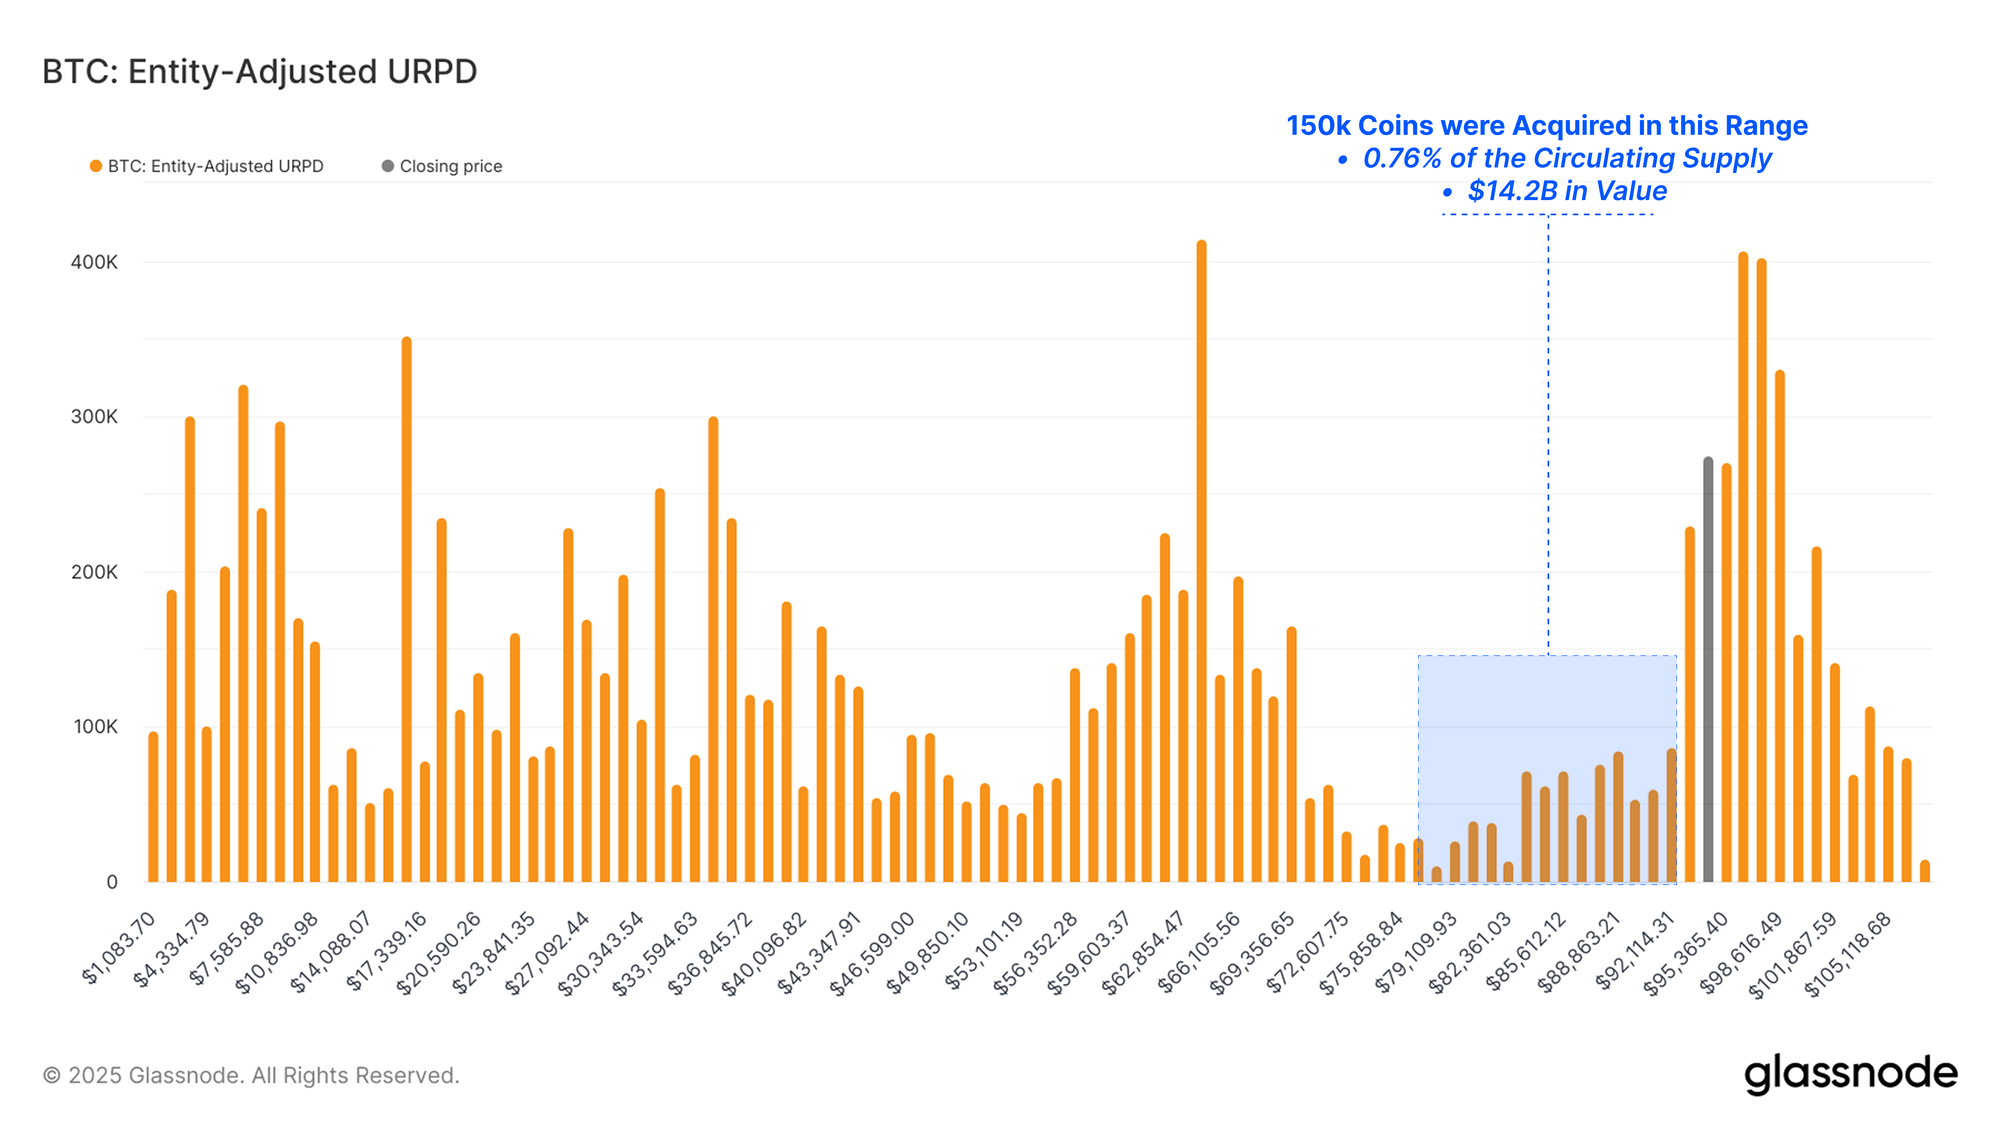
On-chain data allows for a degree of clarity into the acquisition patterns of market participants. The URPD metric is a great tool, offering us a lens into the cost-basis clusters of the BTC supply.
Notably, the initial collapse in prices took the market below $86k, a zone where very few coins had previously changed hands. In a way, the market is testing to see whether the bulls are willing to provide demand support in this area, especially since so many coins have been acquired at prices above $90k, and are now holding an unrealized loss.

Between Feb 26th to March 3rd, over 150k coins (0.76% of the circulating supply, and equivalent to $14.2B in value), were acquired within this ‘air-gap’ region below $86k.
Prices are beginning to trend back towards the upper bound of this zone, and it remains to be seen if investors from the large cluster above $90k are going to take this rally as an exit liquidity opportunity, and cut their losses.
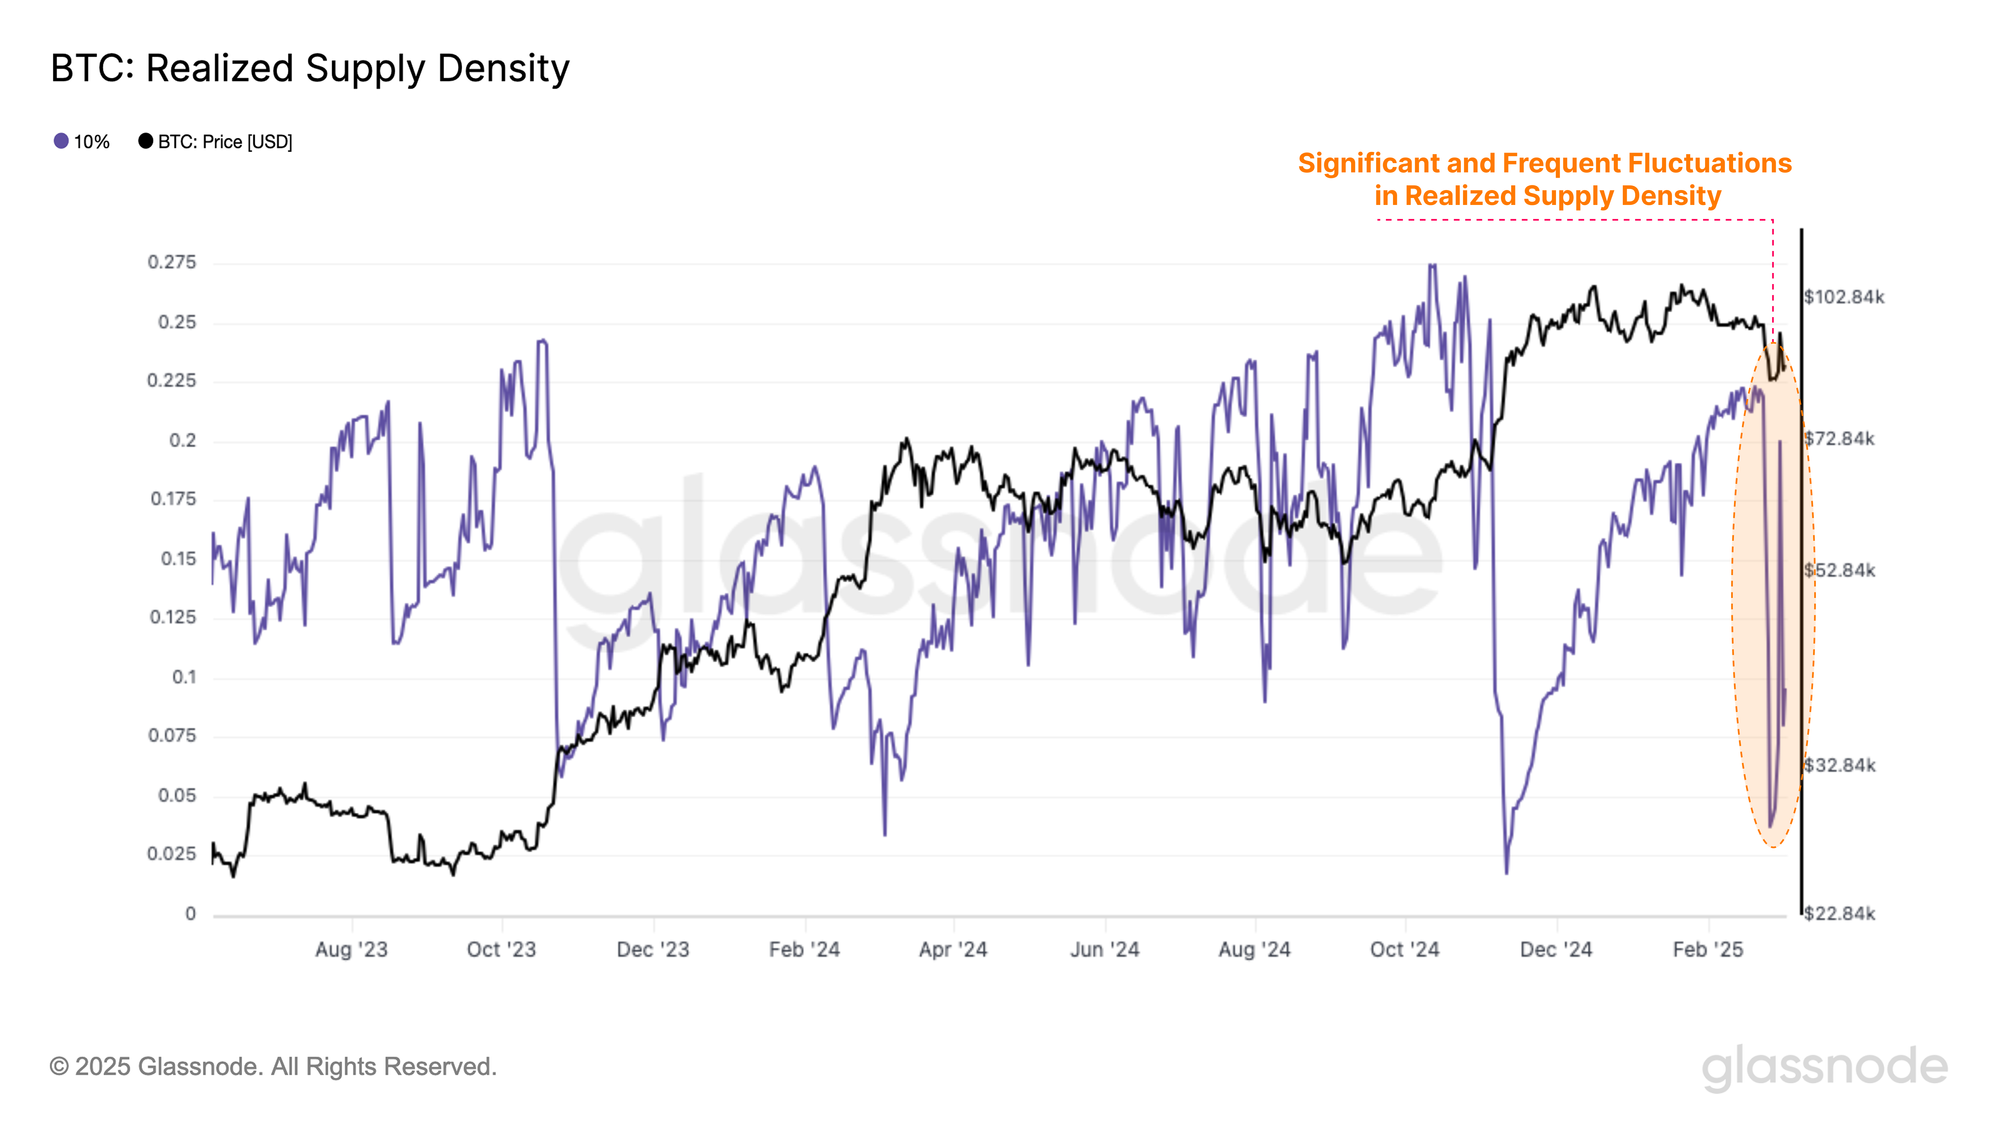
The Realized Supply Density metric quantifies the magnitude of supply concentrated around the current spot price within a ±10% price move. When supply is highly concentrated around the spot price, small movements can significantly affect investor profitability, which in turn can amplify market volatility.
Under these assumptions, we can observe how the supply previously concentrated within a tight price range responds to heightened volatility. As prices sold off, the realised supply density plummeted, signalling a very large shift in investor profitability had occurred.
This metric highlights the violence of the volatility experienced by the market, which may impact investor sentiment moving forward.
Inspecting the Damage
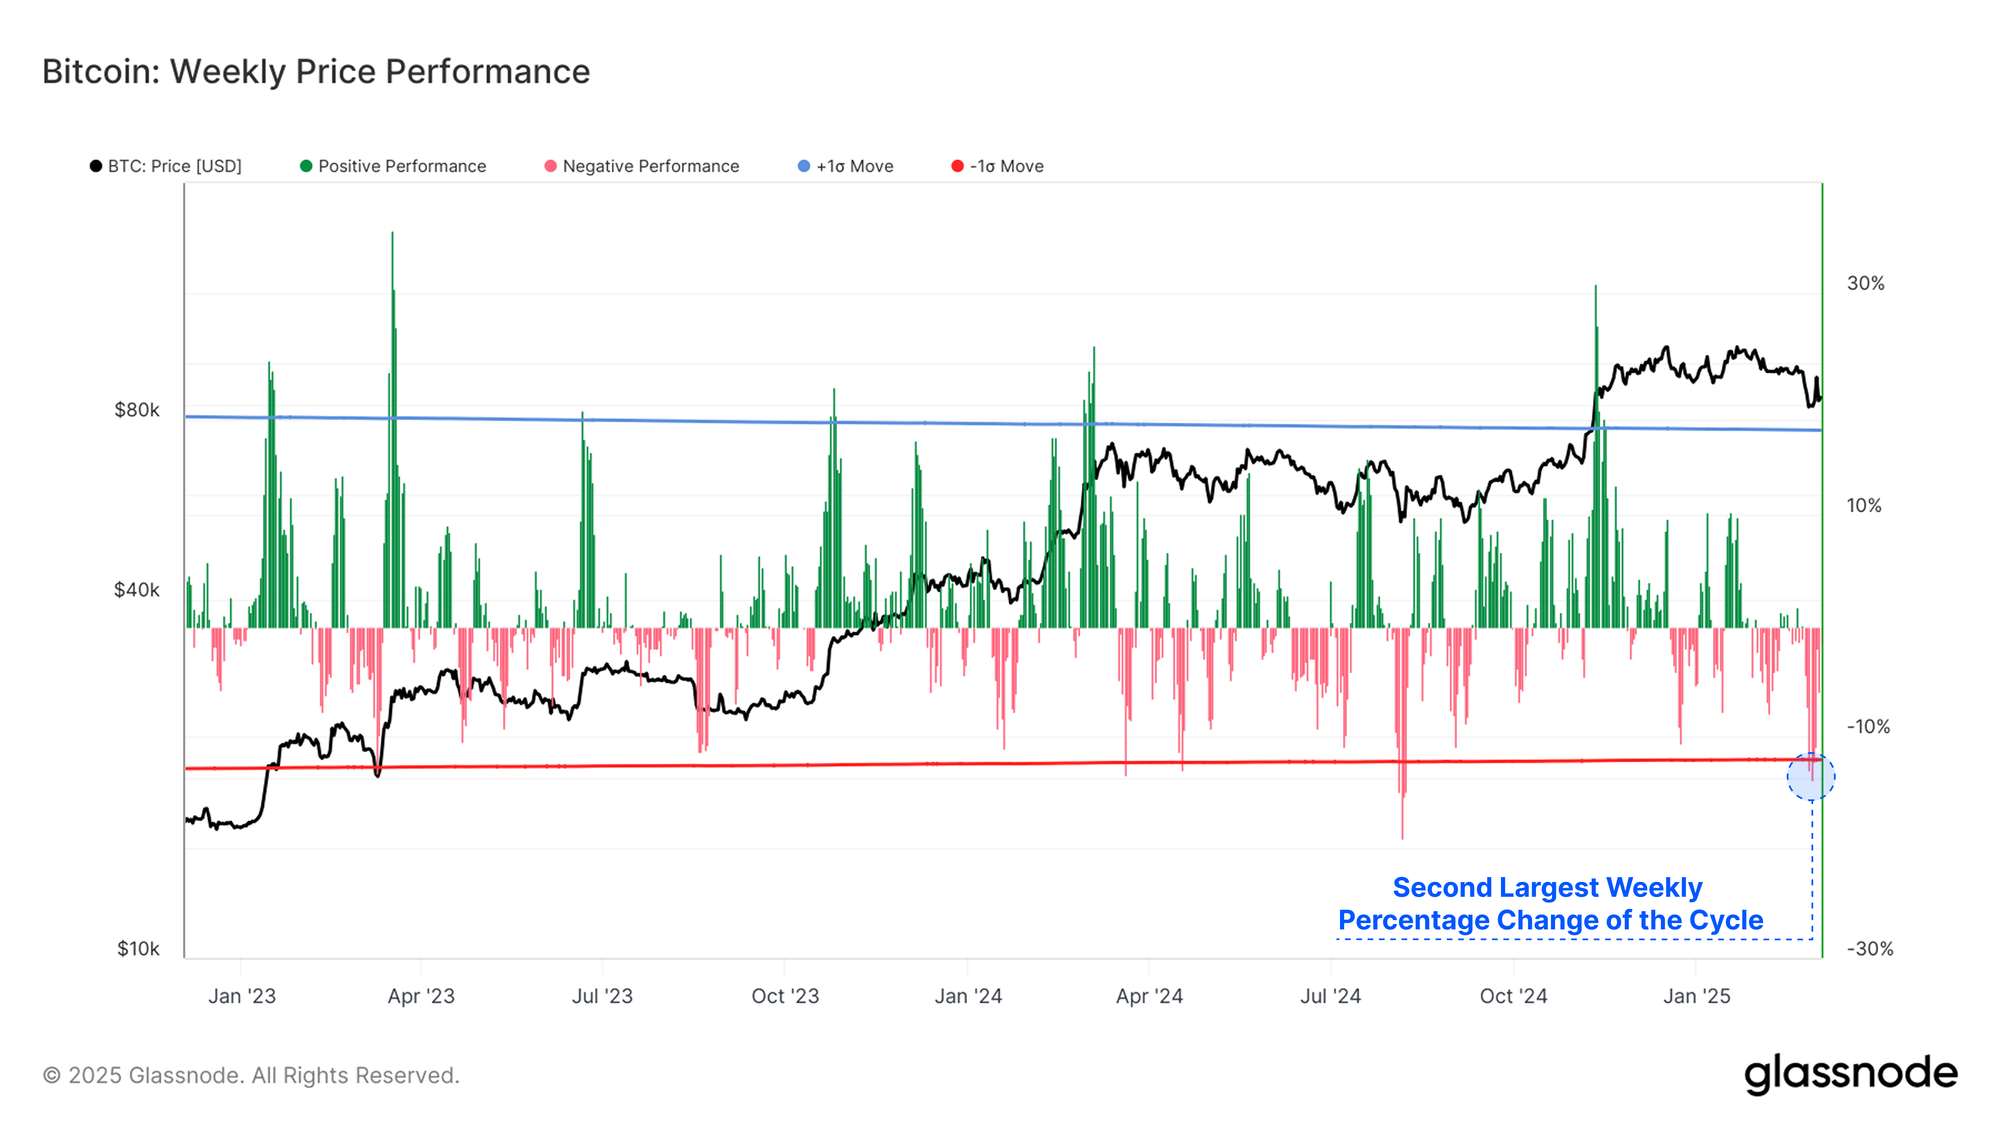
Despite Bitcoin holding up better relative to the other major assets, the recent sell-off has still been the second largest weekly decline of this cycle. The market sold off -13.9% over the last week, bested only by the yen-carry-trade unwind event that occurred on 5-Aug-2024.
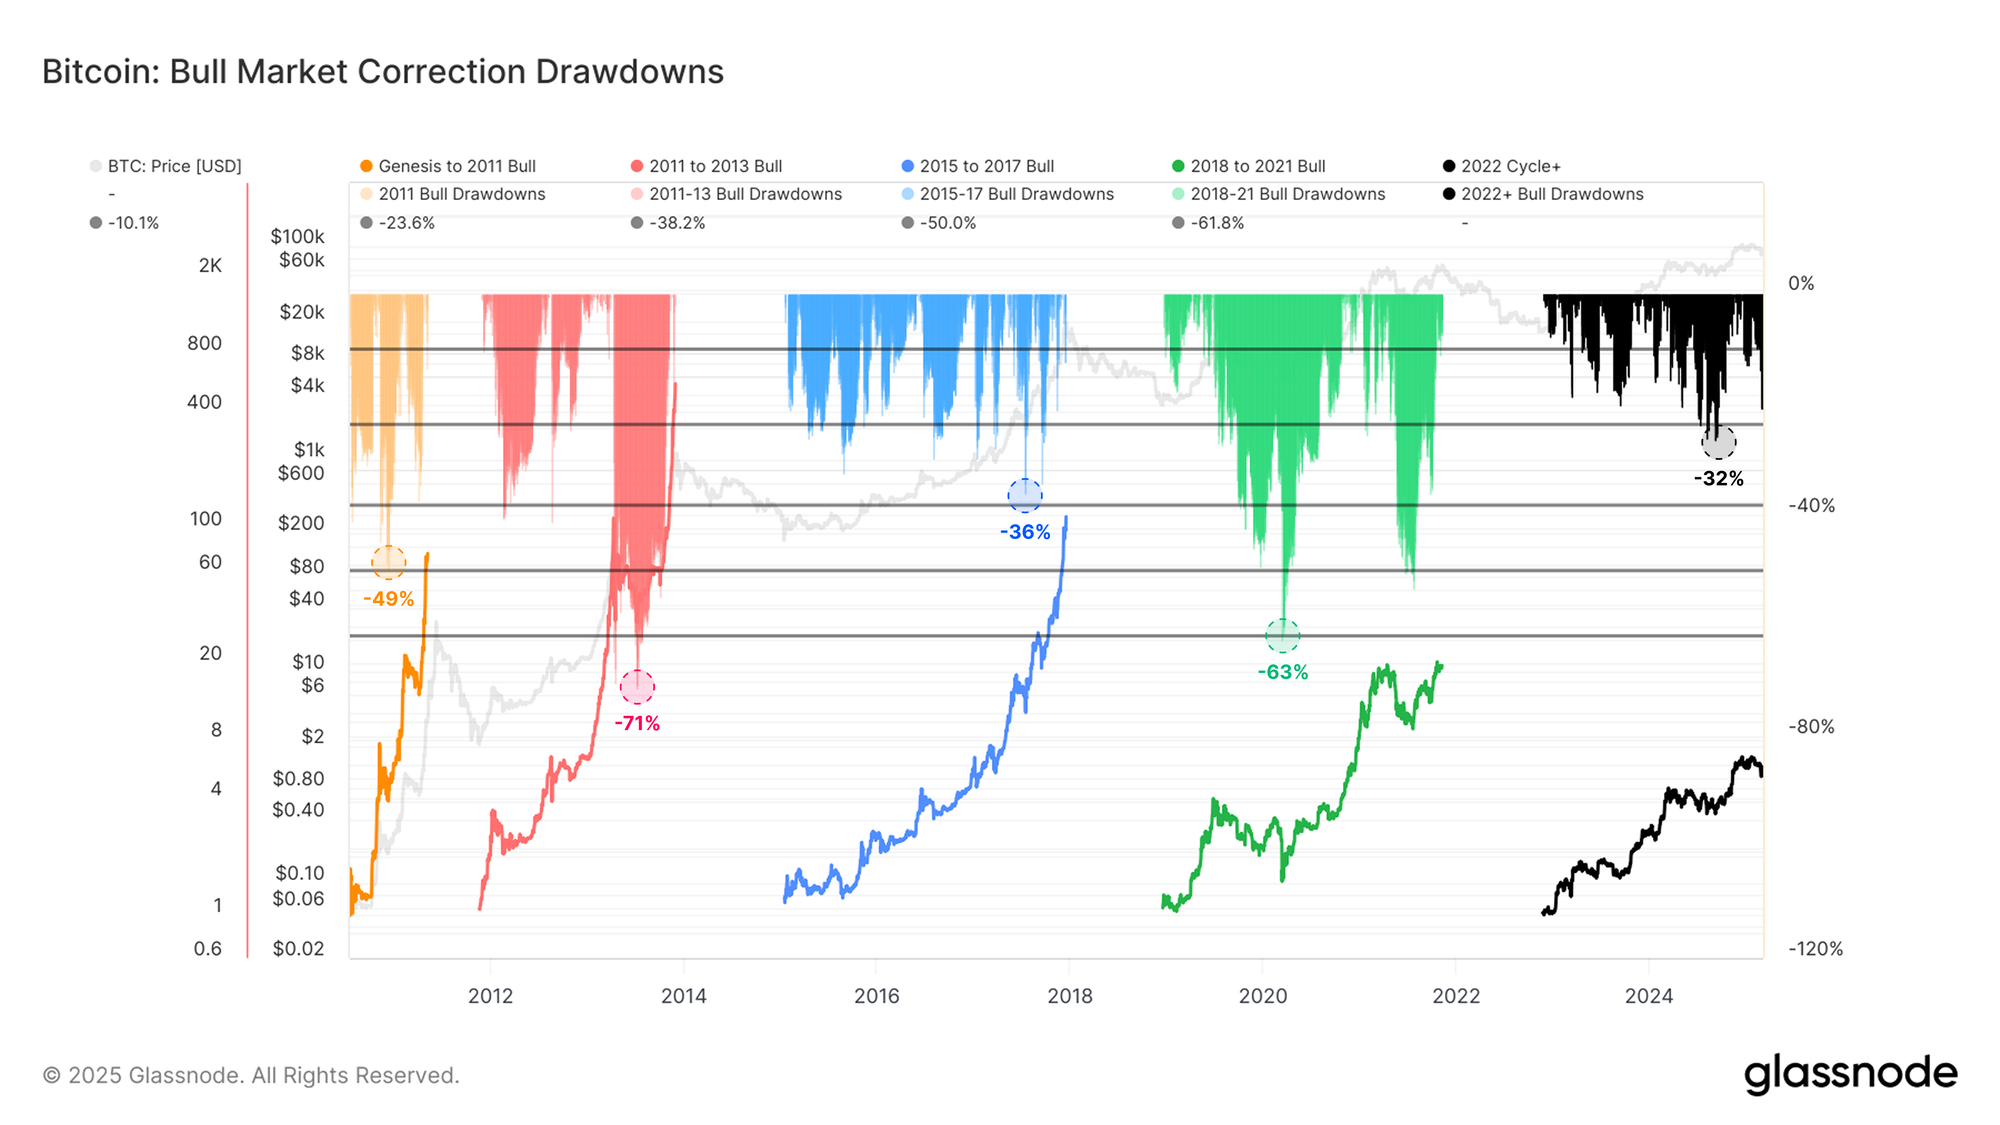
Despite the severity of the correction, the magnitude of the drawdown remains in line with previous drawdowns this cycle, with Bitcoin trading -28% below its ATH. This highlights the relatively robust demand picture Bitcoin has seen during the 2023-25 uptrend, which has been characterised by shallower drawdowns when compared to prior cycles.
Whilst -28% is a large drawdown in 2023-25, a typical drawdown in 2017 was over -30%, and the 2019-21 cycle saw multiple -50% declines.
Blood in the Streets
When the Bitcoin market sells off, valuable insights can be drawn from studying the reaction of investors. This helps us better understand behavior patterns, and any shifts in aggregate sentiment.
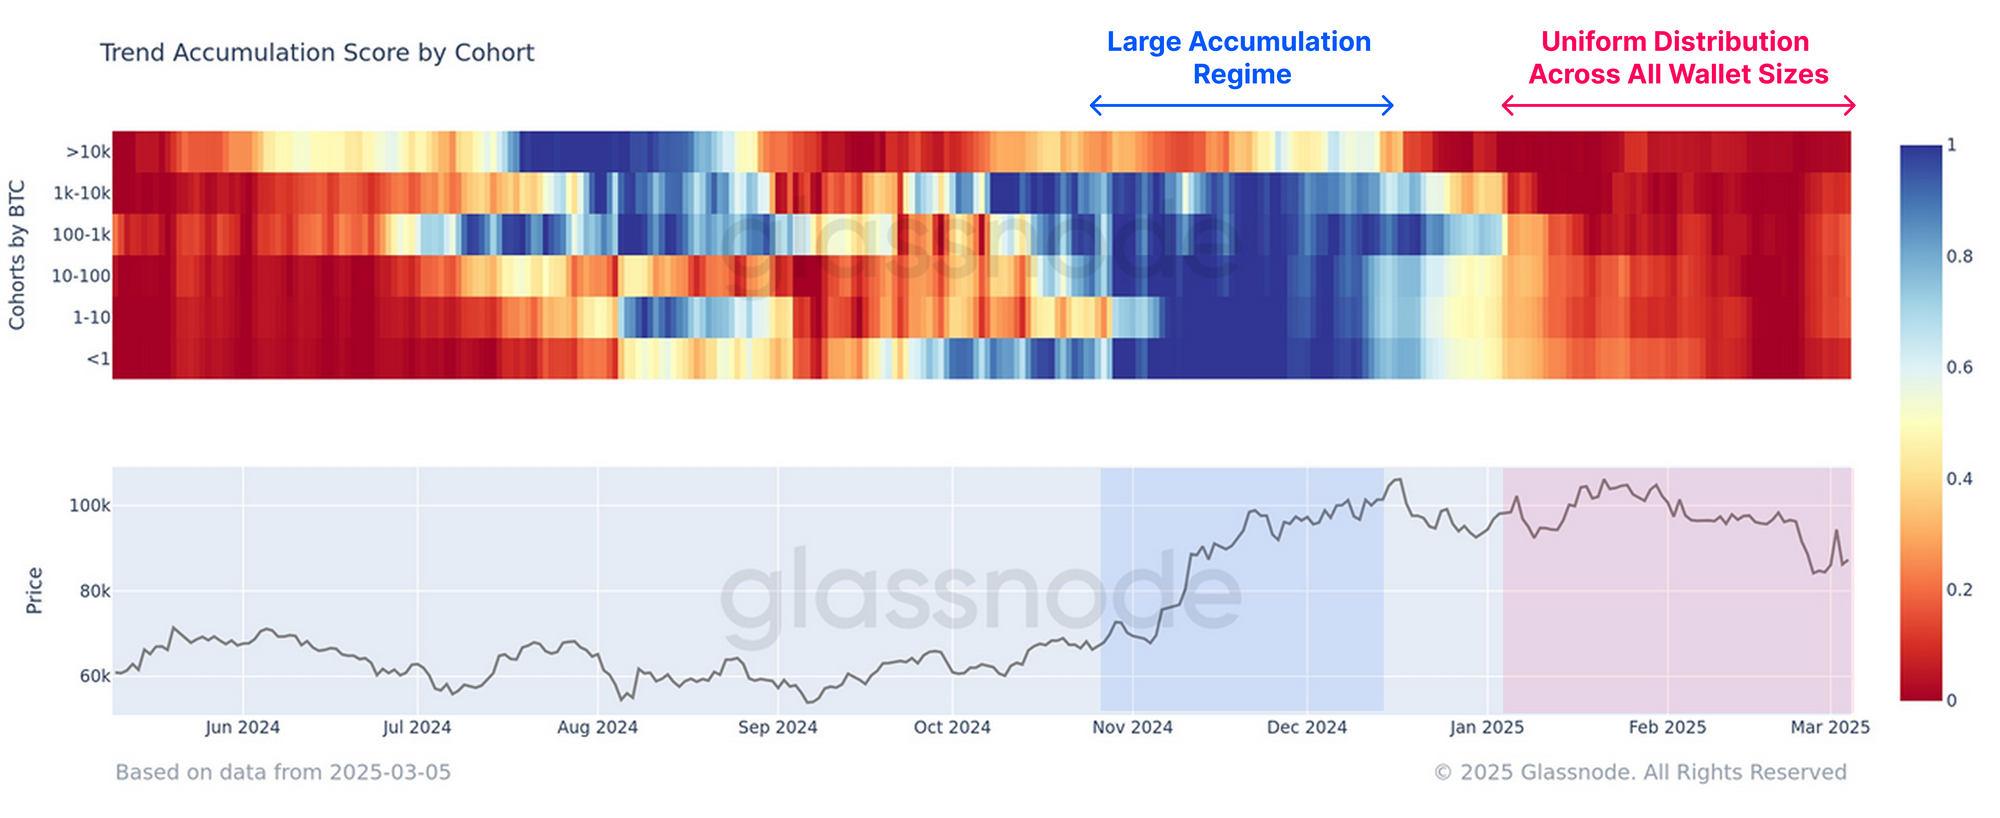
We can see a notable uniformity in the accumulation and distribution behavior across varying wallet sizes. Over the last two months, all wallet size cohorts have engaged in heavy distribution, providing enormous sell-side pressure to the market.
The intensity of this sell-side pressure has heightened since mid-January, contributing to the recent weakness in the market.
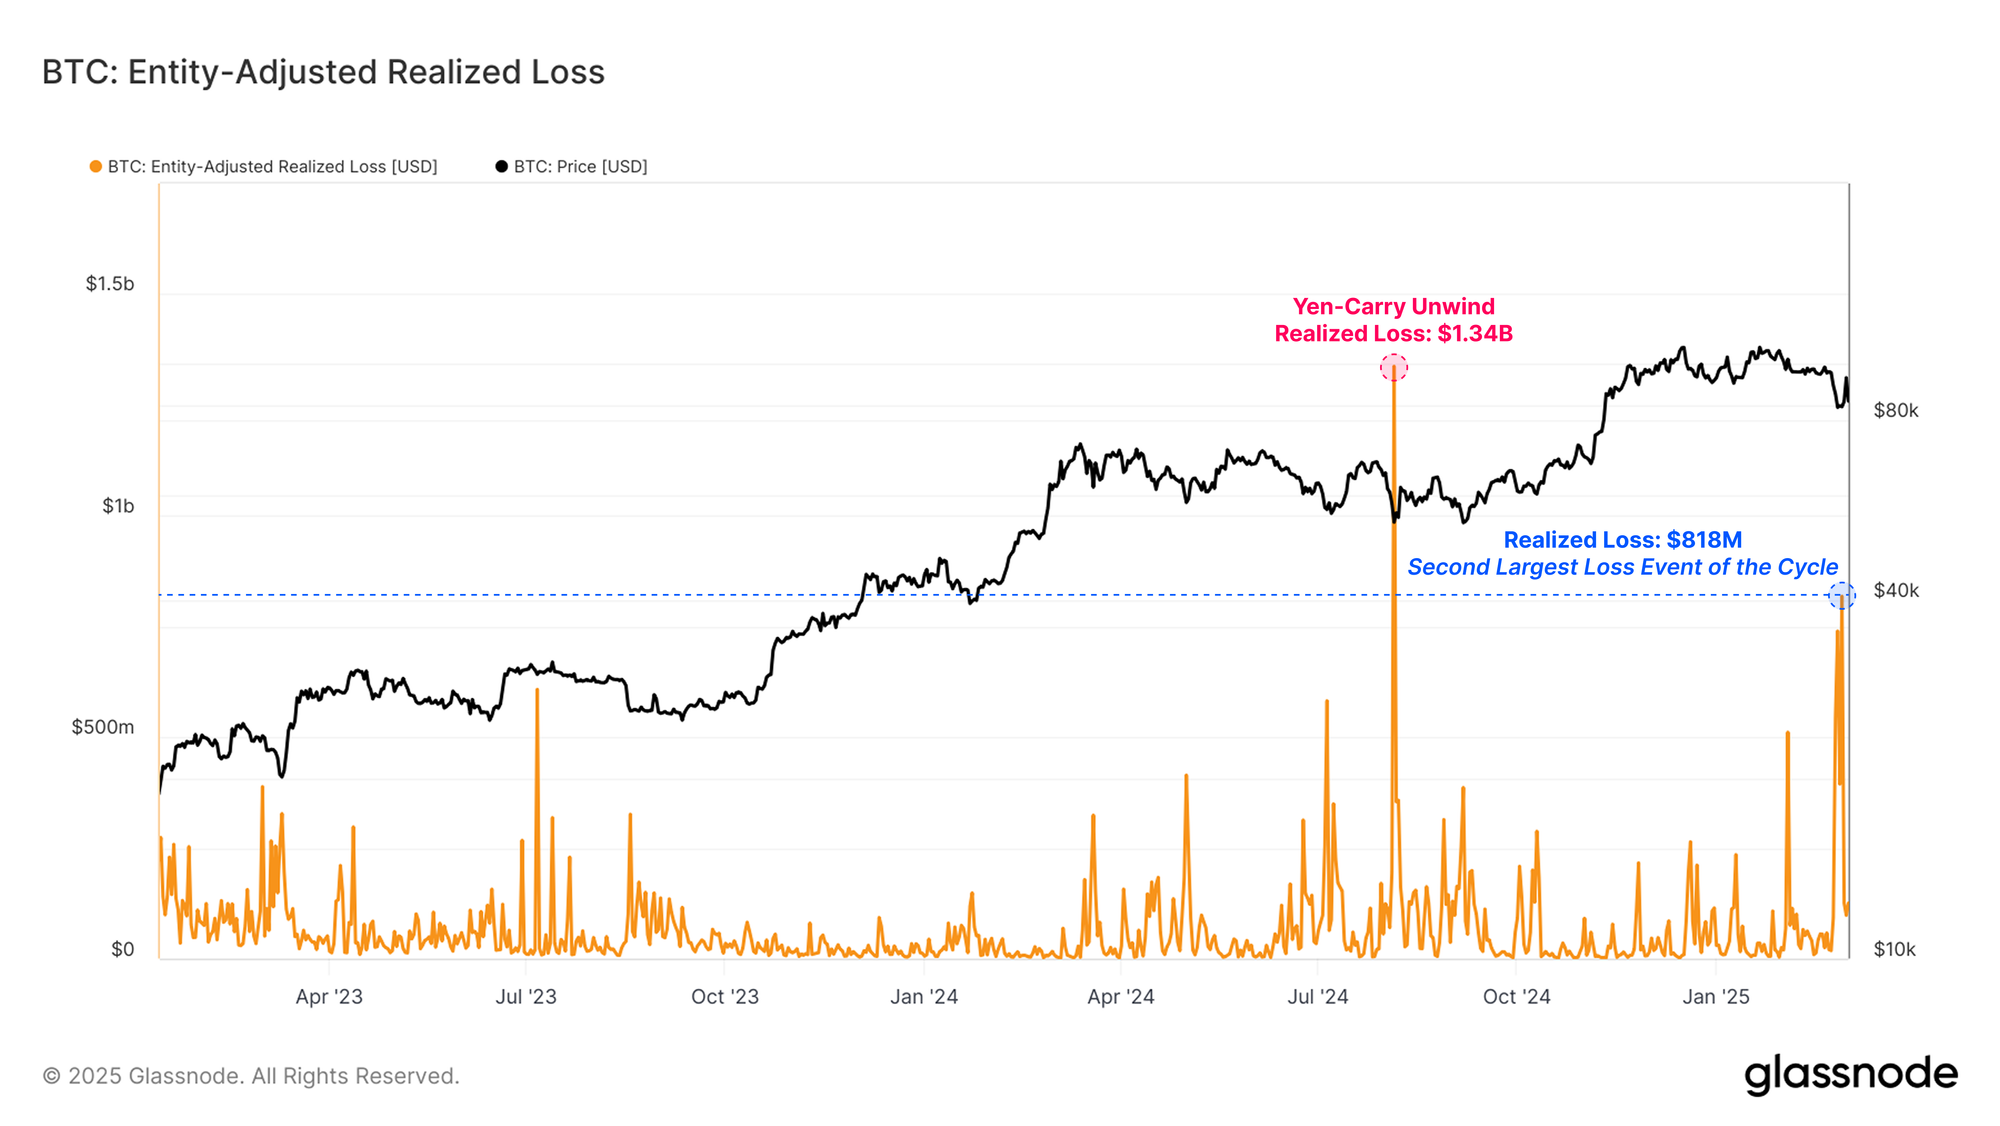
A significant proportion of this sell-side has originated from coins which are locking in a loss. The Realized Loss across all market participants hit $818M/day this week, with only the yen-carry-trade unwind on 5-Aug-2024 recording a larger value ($1.34B).
This showcases that this market downturn has been a challenging environment for investors, with many exiting the market below their cost basis under the pressure of the drawdown.
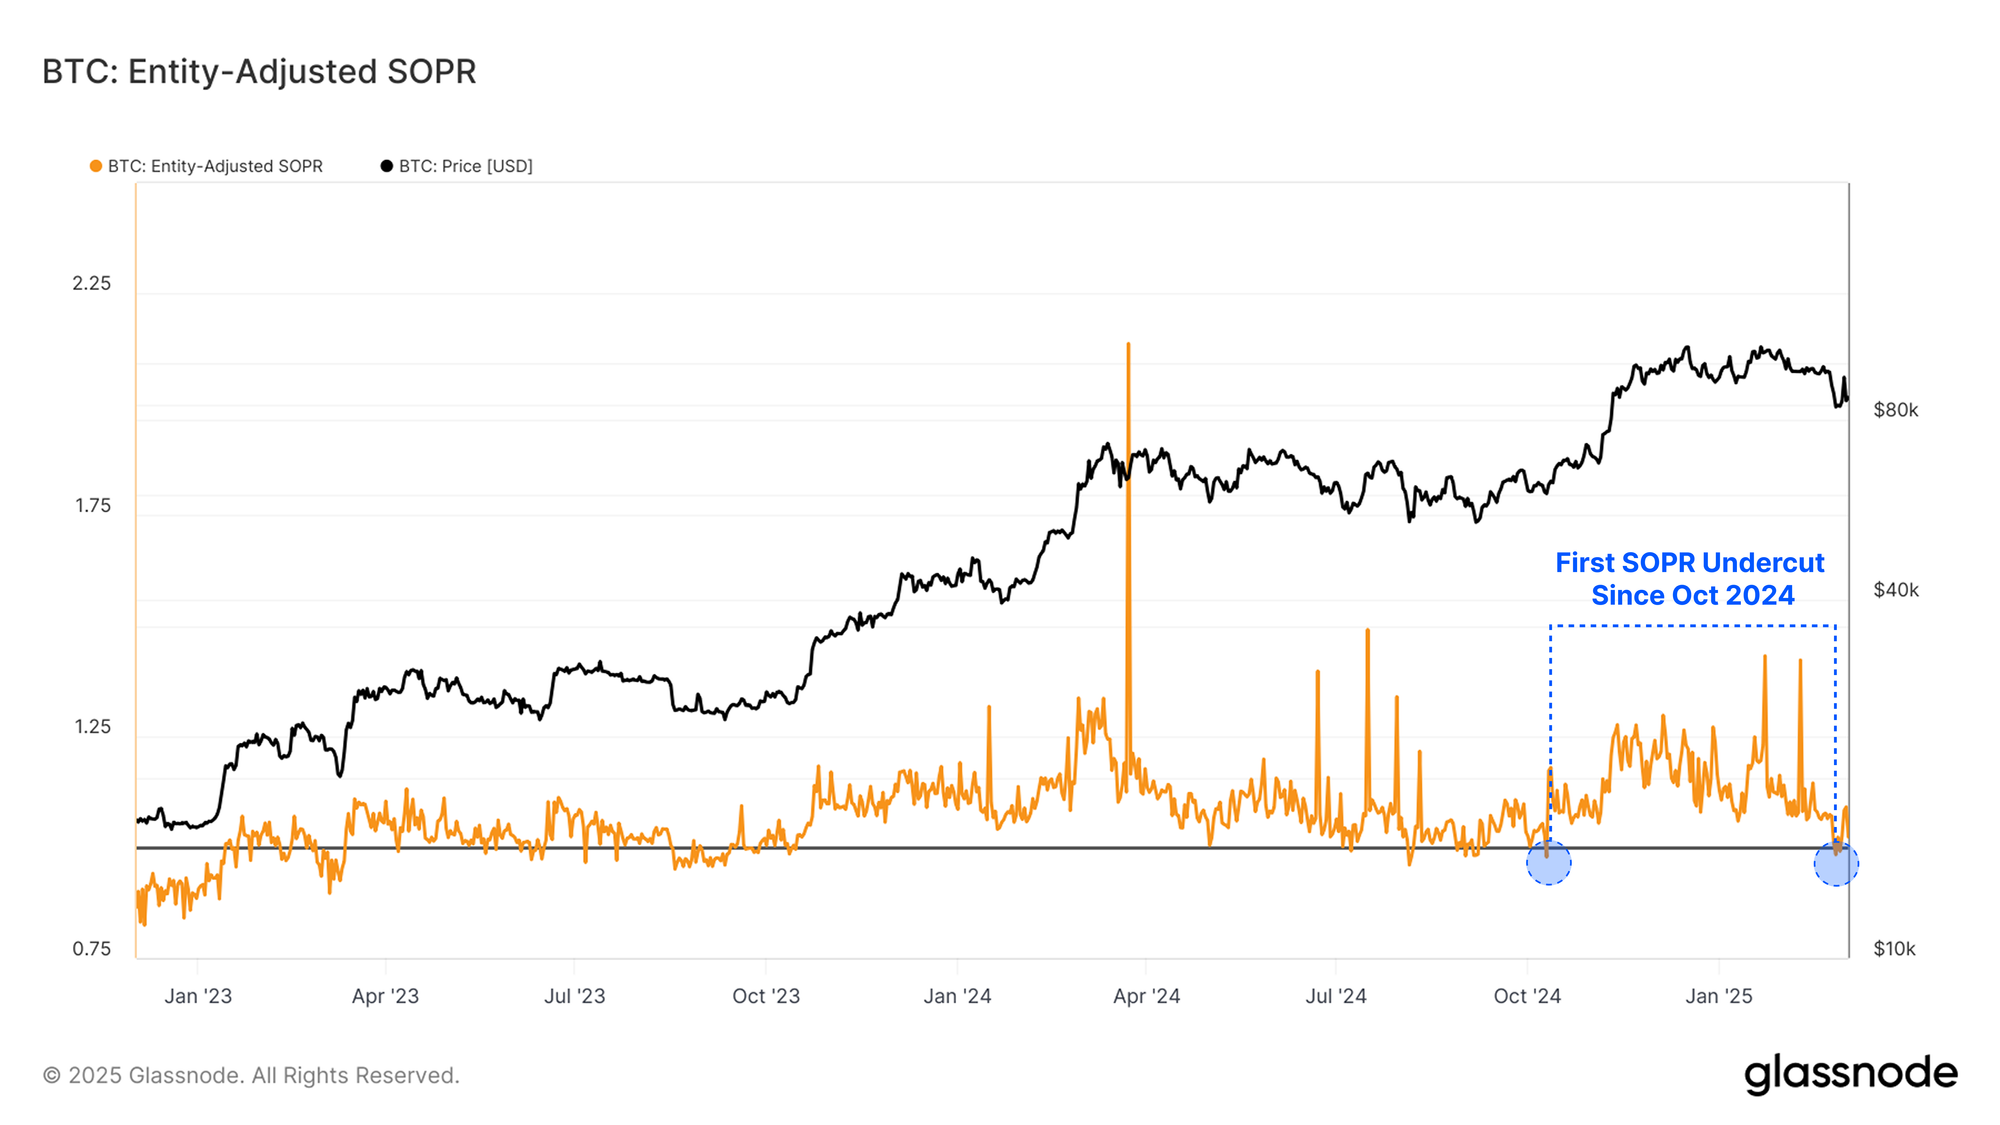
From the perspective of the SOPR metric, which assesses the average profit/loss multiple locked in across investors, we note the first period of loss dominance since Oct 2024.
However, the structure still appears constructive if SOPR finds support at the break-even level of 1.0. Swift and short undercuts at the equilibrium level of 1.0 suggests that investors are buying and defending their cost-basis, which is a typical characteristic of bull markets.
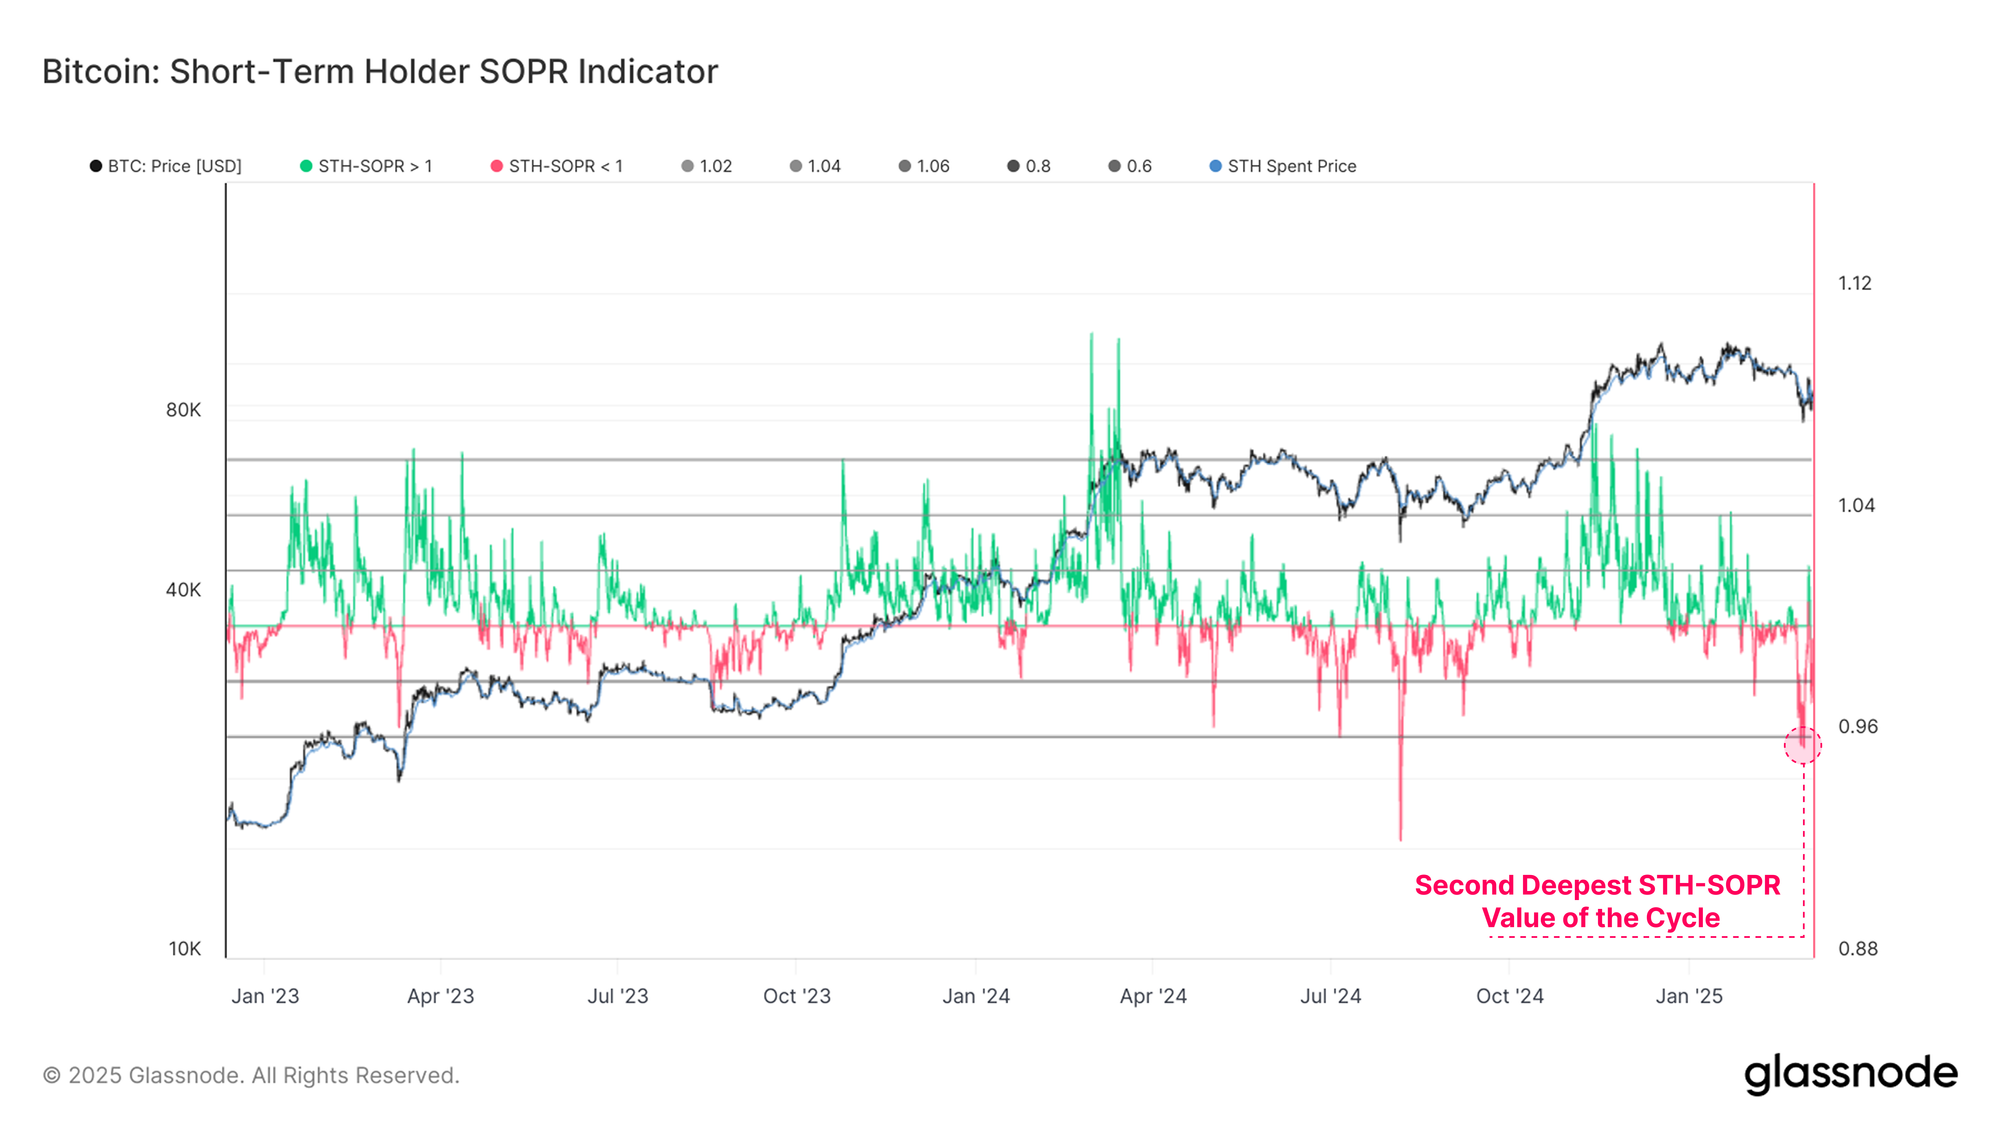
In addition, the Short-Term Holder cohort, a proxy for new demand in the market, has recorded its second largest negative SOPR print of the cycle, again highlighting the exceptionally challenging market conditions for new investors to navigate.
This suggests that new investors have locked in substantial losses this week, and may be a sign of a significant inflection point in investor sentiment.
Maintaining Momentum
We will now turn to an assessment of both price action, and how the market is trading relative to key cost basis levels, derived using on-chain data.
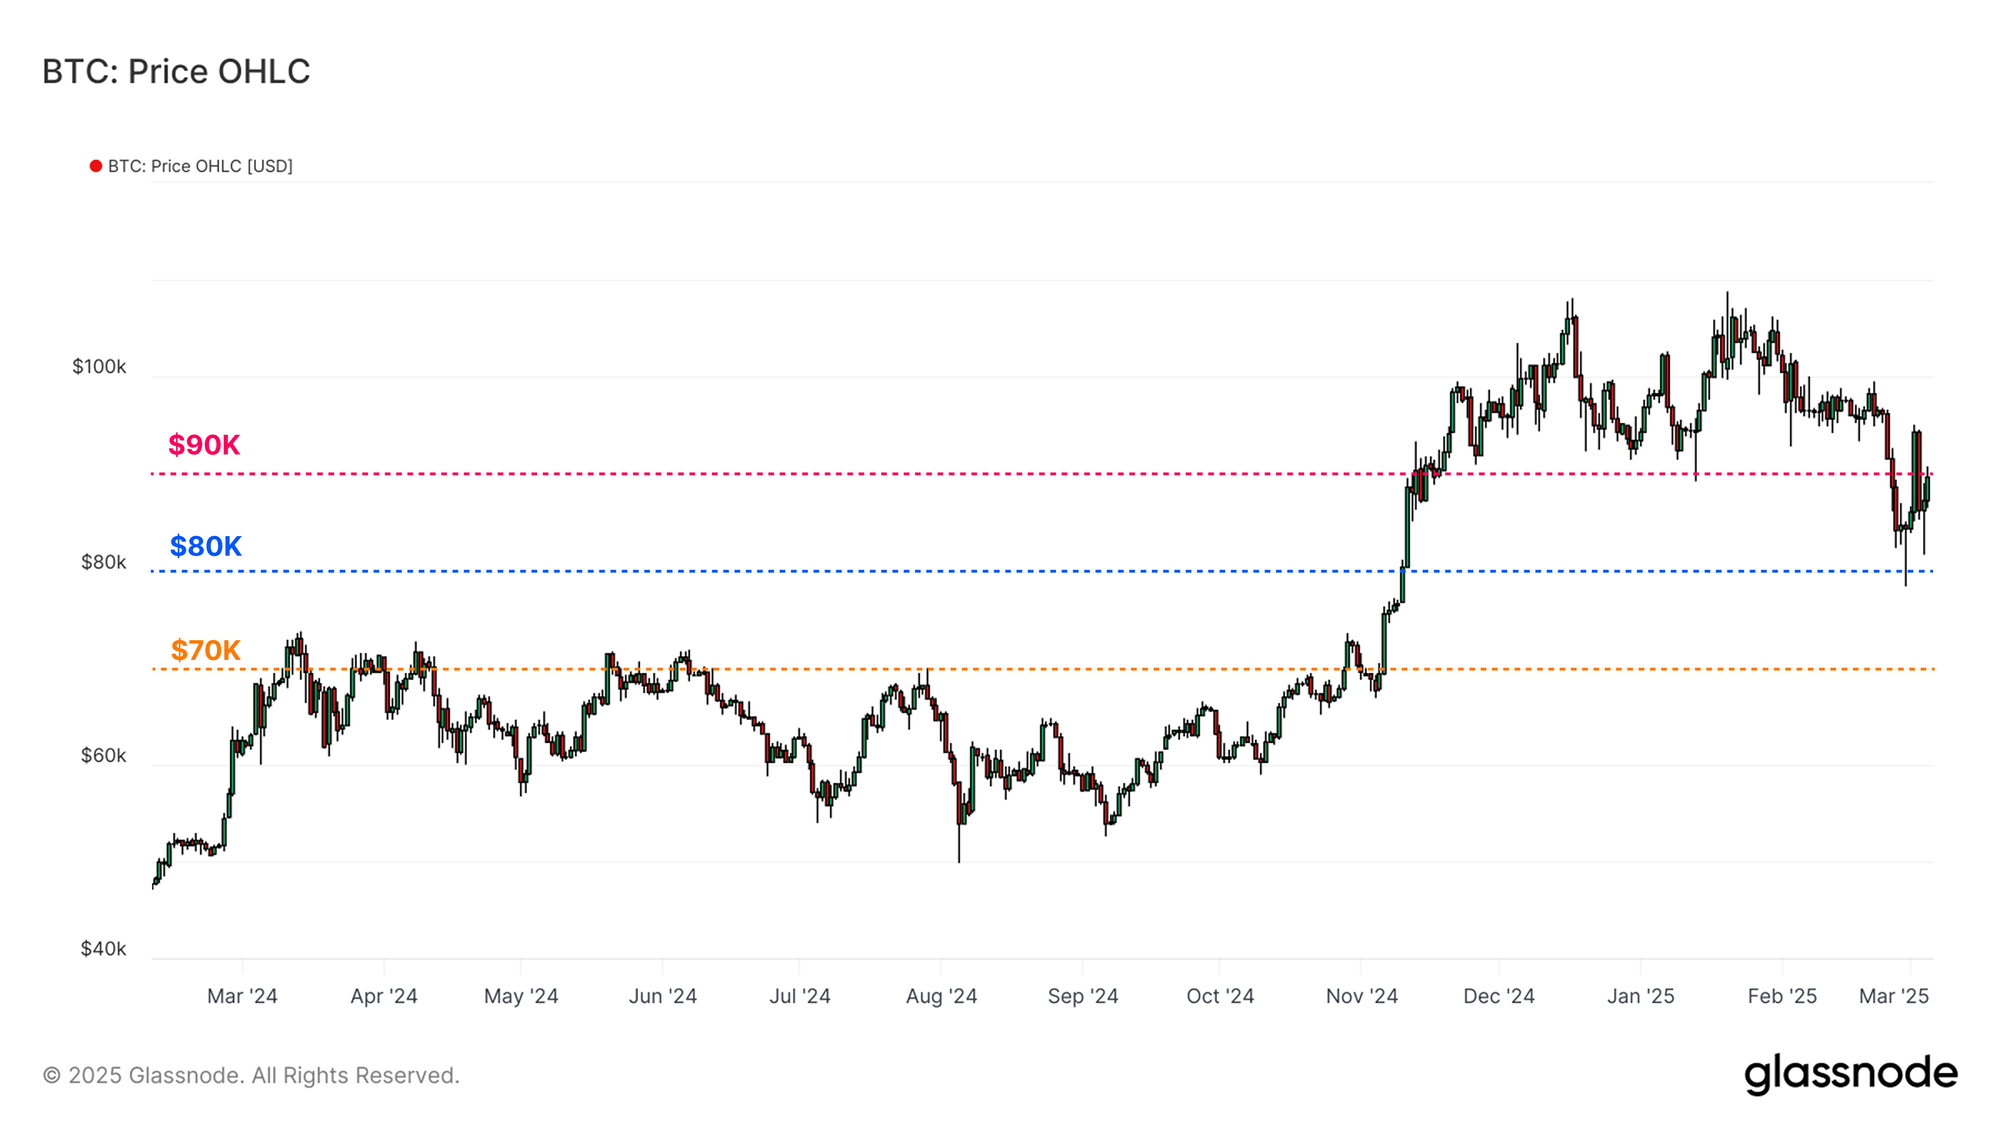
Assessing the price structure over the last few months, we note three key pricing points:
- The initial range breakout at $70k in November 2024.
- A significant surge in price as the market crossed $80k.
- Consolidation phase, with a range low of around $90k.
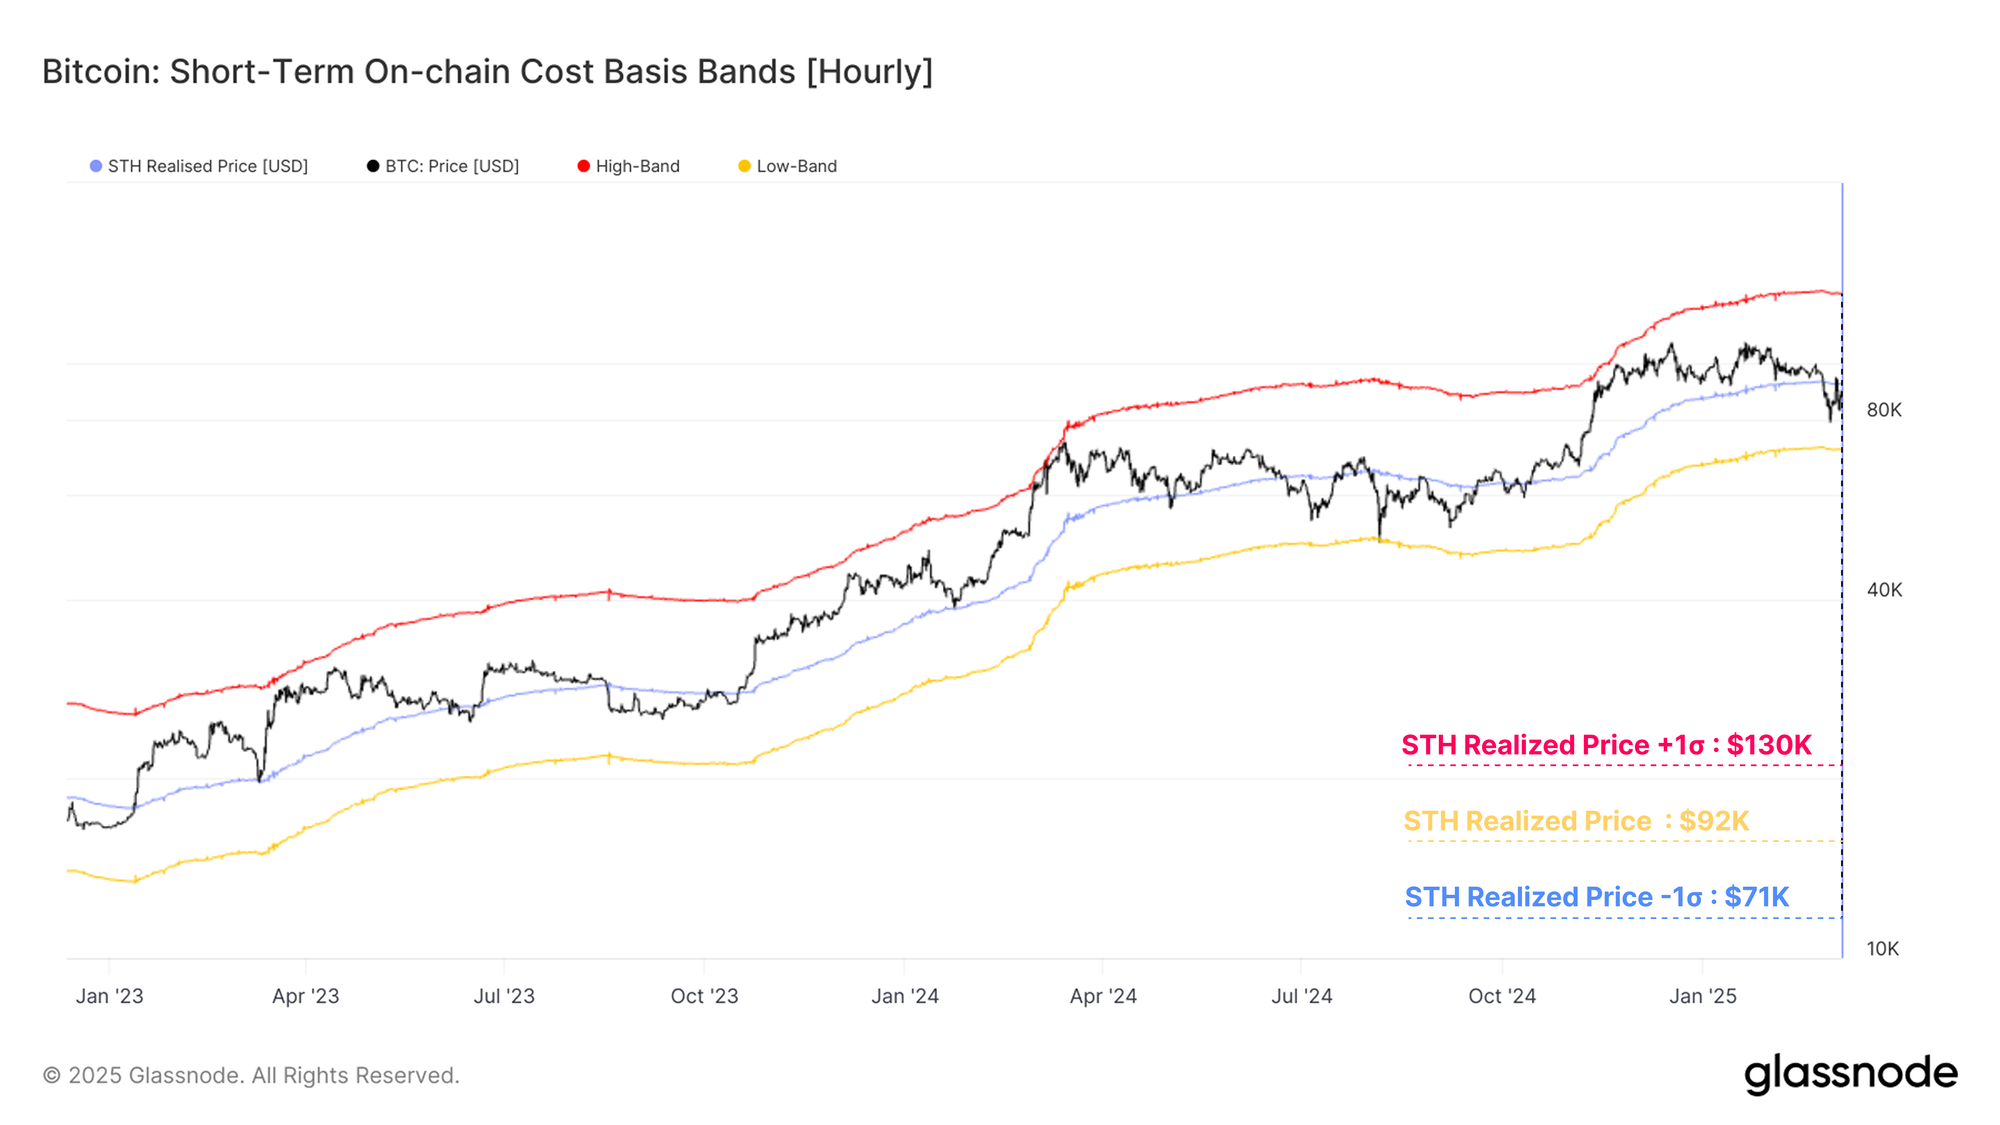
The Short-Term Holder cost basis has historically acted as an important reference level across bull-market uptrends. We have calculated the ±1σ bands of the Short-Term Holder Cost-Basis, which have typically acted as a sort of upper and lower bound for local price action.
At the moment, these levels are trading at:
- Short-Term Holder Cost-Basis +1σ: $130k
- Short-Term Holder Cost-Basis: $92k
- Short-Term Holder Cost-Basis -1σ: $71k
This week, the spot price has sold off below the Short-Term Holder Cost-Basis, and is currently trading between this level, and the lower -1σ band.
The Active Realized Price can help bolster this assessment. The Active Realized Price provides a more true-to-life estimation of the cost-basis for active investors. With 50% of trading days above and below the Active Realized Price, one can consider this level as a key threshold separating a bull and a bear market.
The Active Realized Price is trading at $71k, which is aligned with the STH-CB lower band, as well as the lower bound of the air-gap discussed in the URPD metric earlier. With significant confluence across several key cost basis metrics, this price region becomes an area of interest, perhaps being the final defence line for the bulls in the event of a complete capitulation.

Summary and Conclusions
The coiling of volatility over recent months has led to a widespread price contraction across all digital assets. This has precipitated significant loss taking events, and marks the second largest capitulation event of our current cycle.
For the Bitcoin market, decisive reactions around Short-Term Holder Cost-Basis at $92k appear to be a key level to monitor for local momentum. If the market deteriorates further, the $71k region is a key area of interest. It aligns with several technical, and on-chain metrics alike, making it an important level for the bulls to defend should it be reached.
Disclaimer: This report does not provide any investment advice. All data is provided for information and educational purposes only. No investment decision shall be based on the information provided here and you are solely responsible for your own investment decisions.
Exchange balances presented are derived from Glassnode’s comprehensive database of address labels, which are amassed through both officially published exchange information and proprietary clustering algorithms. While we strive to ensure the utmost accuracy in representing exchange balances, it is important to note that these figures might not always encapsulate the entirety of an exchange’s reserves, particularly when exchanges refrain from disclosing their official addresses. We urge users to exercise caution and discretion when utilizing these metrics. Glassnode shall not be held responsible for any discrepancies or potential inaccuracies. Please read our Transparency Notice when using exchange data.
- Join our Telegram channel.
- For on-chain metrics, dashboards, and alerts, visit Glassnode Studio.