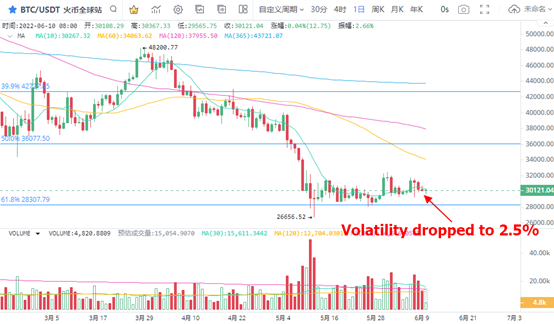
1、 BTC volatility decreased significantly
After the continuous correction of BTC in the short term, while the price remained weak, the volatility dropped to 2.5%. At the same time, BTC's weekend market was relatively flat after the trading volume was close to the equivalent line. Without strong capital flow, it is more likely to maintain weak consolidation.
In terms of moving average, the BTC price is lower than the 10 day moving average, and there is little profit space during the rebound. With the continuation of the adjustment, the long and short sides may choose the direction of breakthrough after a fight near us $30000. As for the range fluctuation opportunities, we can pay attention to the trading opportunities of BTC in the range of USD 28000 to USD 32000.
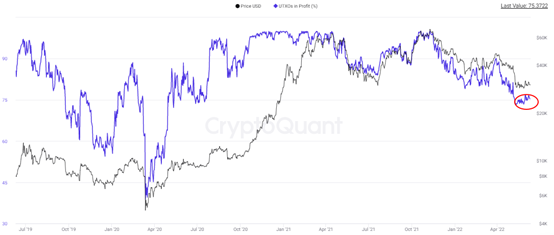
2. BTC investors have a high percentage of profits from holding currency
The BTC price was running around USD 30000, which was significantly retreated from the historical high of USD 69000, but the overall profit performance of investors remained unchanged. According to the performance of uxto, a transaction that has never been spent, the index value shows that the overall profit space is around 75%, which is equivalent to the level before July 2020. In this sense, the transaction output not spent by BTC still has a large callback space.
This shows that the profits accumulated in the bull market may continue to flee, and the fixed investment transaction can expect a competitive buying price.
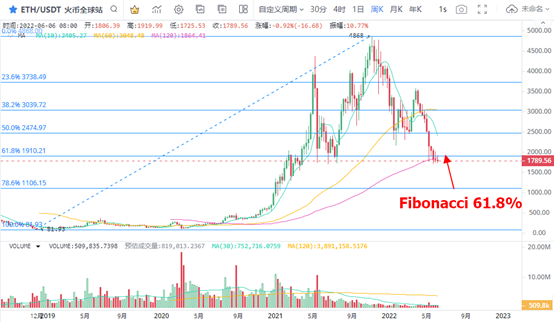
3. Eth horizontal plate below pressure level
Weekly K-line chart shows that eth is sideways clearing below the pressure level of $1910 corresponding to the key 61.8% of Fibonacci, and has not sent any effective trading signal at present. In terms of trading volume, the weekly trading volume is significantly lower than that before May 2021.
The current trend of eth is relatively sluggish. In addition to continuing the trend of price adjustment, the new market entry funds are limited, affecting the efficiency of bottom confirmation. Within the week, the ETH price failed to rise above the 120 day moving average, which means that the bulls have insufficient ability to raise the price, and the market maintains the status quo of range fluctuation.
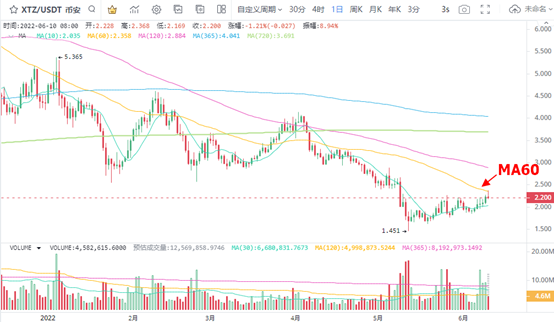
4. Xtz short-term rebound is blocked
The recent trading heat of xtz has increased slightly, and the price increase has reached around $2.35 corresponding to the 60 day moving average, showing good price elasticity. Recent news shows that tether has announced that it will launch usdt on tezos (xtz) blockchain. This announcement now means that usdt can be used on 12 blockchain networks, including Ethereum (ETH), Tron (TRX) .
Alessandro de Carli, the founder of papers, said: "with the introduction of USD ₮ the entrance and exit of tezos defi ecosystem have been simplified and efficient." the introduction of USD ₮ on tezos will undoubtedly unlock new defi products, which I expect will have a significant impact on the growth of tezos defi ecosystem. "
In terms of price impact, xtz rose and fell in the short term, which is consistent with the trend of mainstream currencies, but the market performance is stronger than BTC and eth. Stabilize the currency entering tezos network, and the positive effect on xtz price will be reflected in the long-term price performance.