A popular crypto analyst is exploring buyer interest at different price levels to see where leading smart contract platform Ethereum (ETH) is headed next.
In a new strategy session, the anonymous host of InvestAnswers tells his 440,000 YouTube subscribers that, despite a rough start to 2022, ETH has held firm at $1,720 and has since pushed back above $1,900.
“Ethereum has been very volatile, very beaten down. It held up very strong at that $1,720 level of support, which is historical support from 2021.
But this on-chain data shows a stiff supply barrier between about $1,906 and $1,963 where roughly 900,000 addresses acquired over eight million ETH.”
The analyst goes on to say that if ETH can break out of the $1,906 to $1,963 resistance zone, it might very well blast past $2,000 by another 10%.
“ETH has to overcome this resistance to be able to get back above $2,200. Maybe expect a little bit of what I call ‘glass tapping’ required to bust through that level, to get through $2,000 straight to $2,200.
Watch that space carefully.”
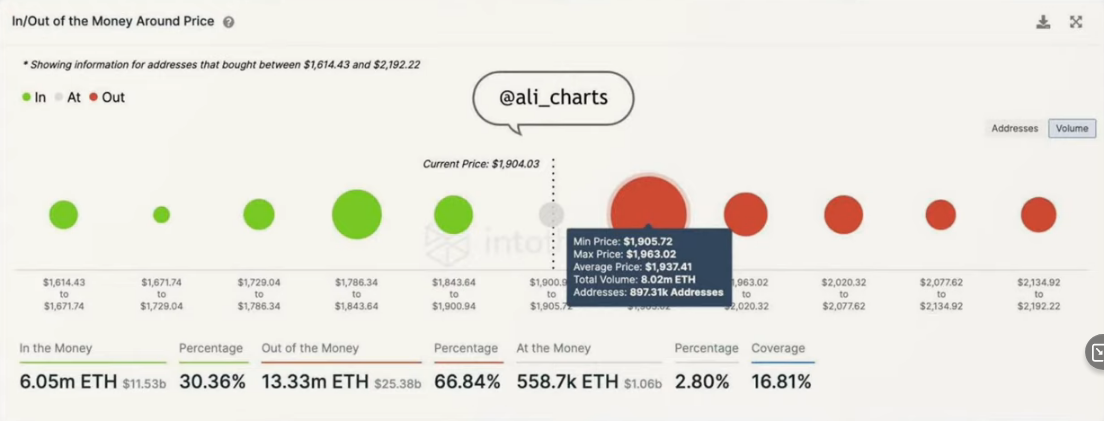
Source: InvestAnswers/YouTube
Ethereum has experienced some choppy price action to start the week, down 2.77% at time of writing and trading for $1,817.
The InvestAnswers next looks at the Bitfinex futures contracts bought on margin to gauge whether Bitcoin (BTC) might be primed to break out after losing over 50% of its initial 2022 value of $47,292.
“Margined longs hit an all-new, all-time high. Notice that the longs, which is typically a bull indicator, vastly increased in mid-May and currently stand at about nearly a hundred thousand Bitcoin contracts, its highest ever registry.
To understand how severe this movement was, one might compare it to June/July of 2021, the previous all-time high of 50,000 contract longs. It’s doubled in size.”
The analyst concludes by saying he thinks the renewed interest in Bitcoin futures is a bullish indicator.
“These Bitfinex margin longs don’t get it right all the time but they do get it right about 75% of the time, so this a bullish sign that we have bottomed.
I don’t promise we’ve bottomed, but all roads are really pointing to that.”
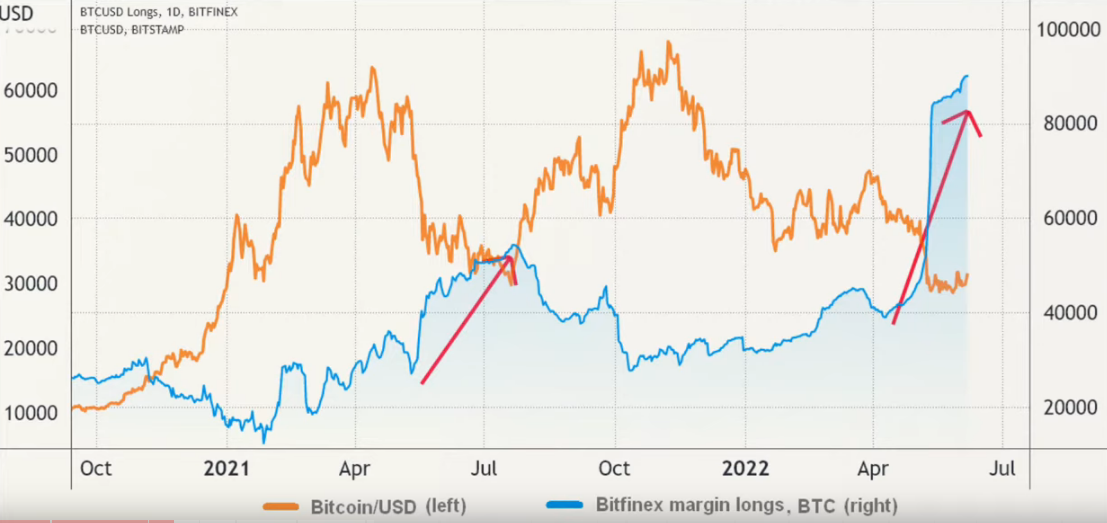
Source: InvestAnswers/YouTube
Bitcoin is currently trying to recover from a big drop on June 6th when it flash-crashed from $31,518 to $29,419.
BTC recaptured the $30,000 level but is down 3.62% over the last 24 hours and is changing hands for $30,615.