What Does The Bull Div On Ethereum RSI Mean For The Top Altcoin?

newsbtcPublié le 2022-06-08Dernière mise à jour le 2022-06-08

Résumé

Just like other altcoins, Ethereum too extended losses today.

Just like other altcoins, Ethereum too extended losses today. Over the last 24 hours, the altcoin slipped below the $1900 price level. Bitcoin also fell on its chart and major industry altcoins followed suit. Most coins over the past week and a half have been consolidating on their charts.


Following the consolidation, some altcoins attempted to rise on their charts but was soon met with the bears due to choppiness in the market. Overhead resistance for Ethereum continues to remain firm for the coin as market remains weak.


Buyers are still wary of their next step as ETH witnessed fluctuations in price level. Amidst bearish price action, Ethereum has managed to capture a bullish signal on the one day chart. If demand grows back, the coin could regain a bullish stance over the upcoming trading sessions.

Ethereum Price Analysis: One Day Chart

Ethereum

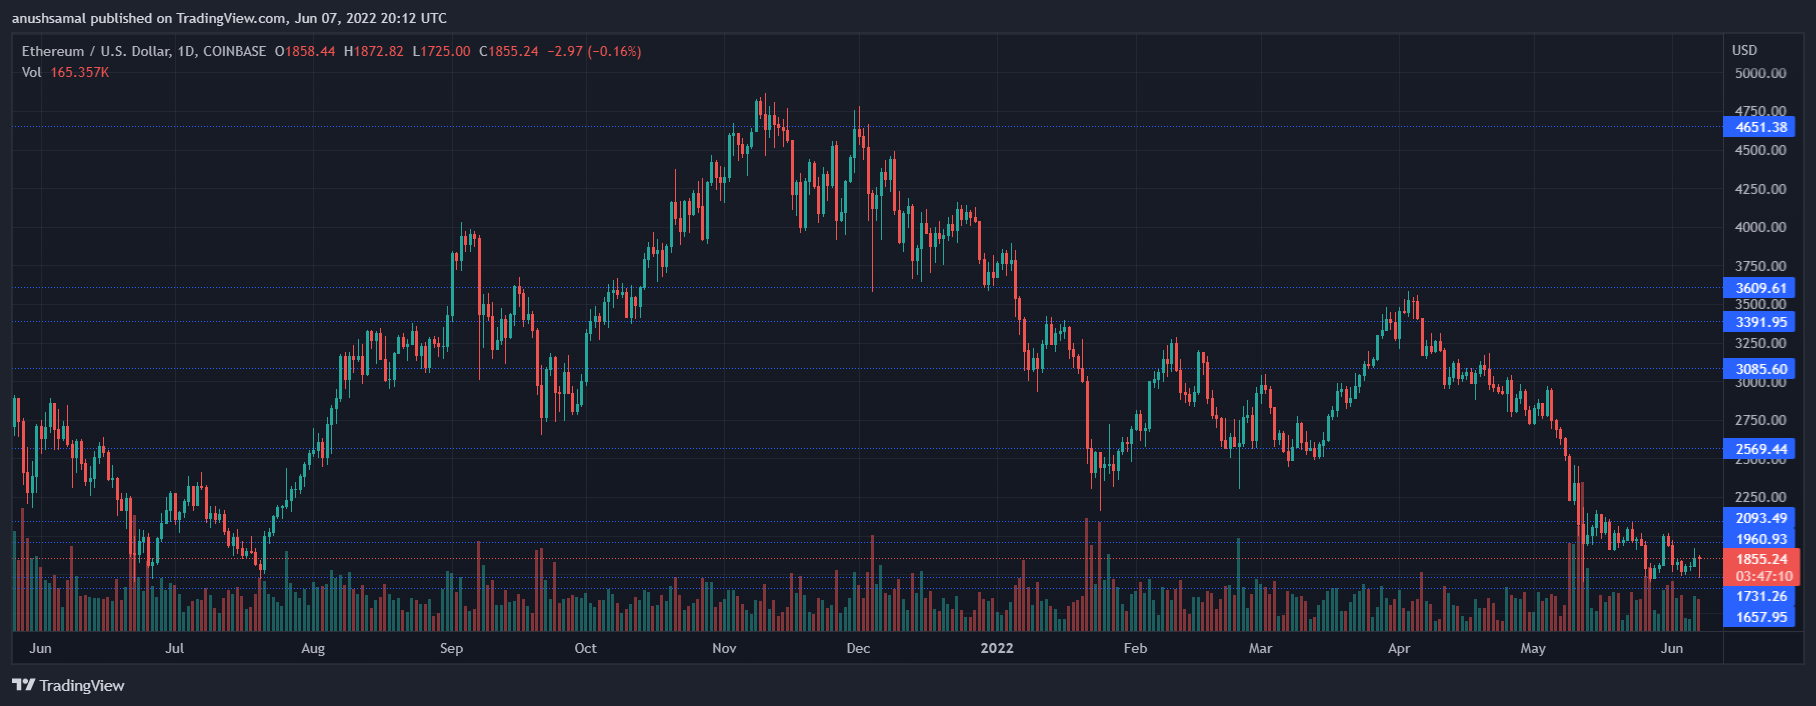
Ethereum was priced at $1800 on the one day chart | Source: ETHUSD on TradingView

ETH was exchanging hands at $1800 after it encountered stiff resistance at the $1900 price level. Over the last 24 hours, Ethereum lost 2.6% of its value. In the past week, ETH depreciated by almost 10%. A fall from the current price level will make ETH trade near the $1700 price mark.


Ethereum was back to trading at the price levels it last traded in the month of July 2021. Overhead resistance for the coin awaited at $1960. If demand remains consistent the altcoin could push itself to trade near the $2000 price mark.


The volume of Ethereum declined a little but the bar was red in colour. The red bar signified a bearish price action.


Technical Analysis

Ethereum

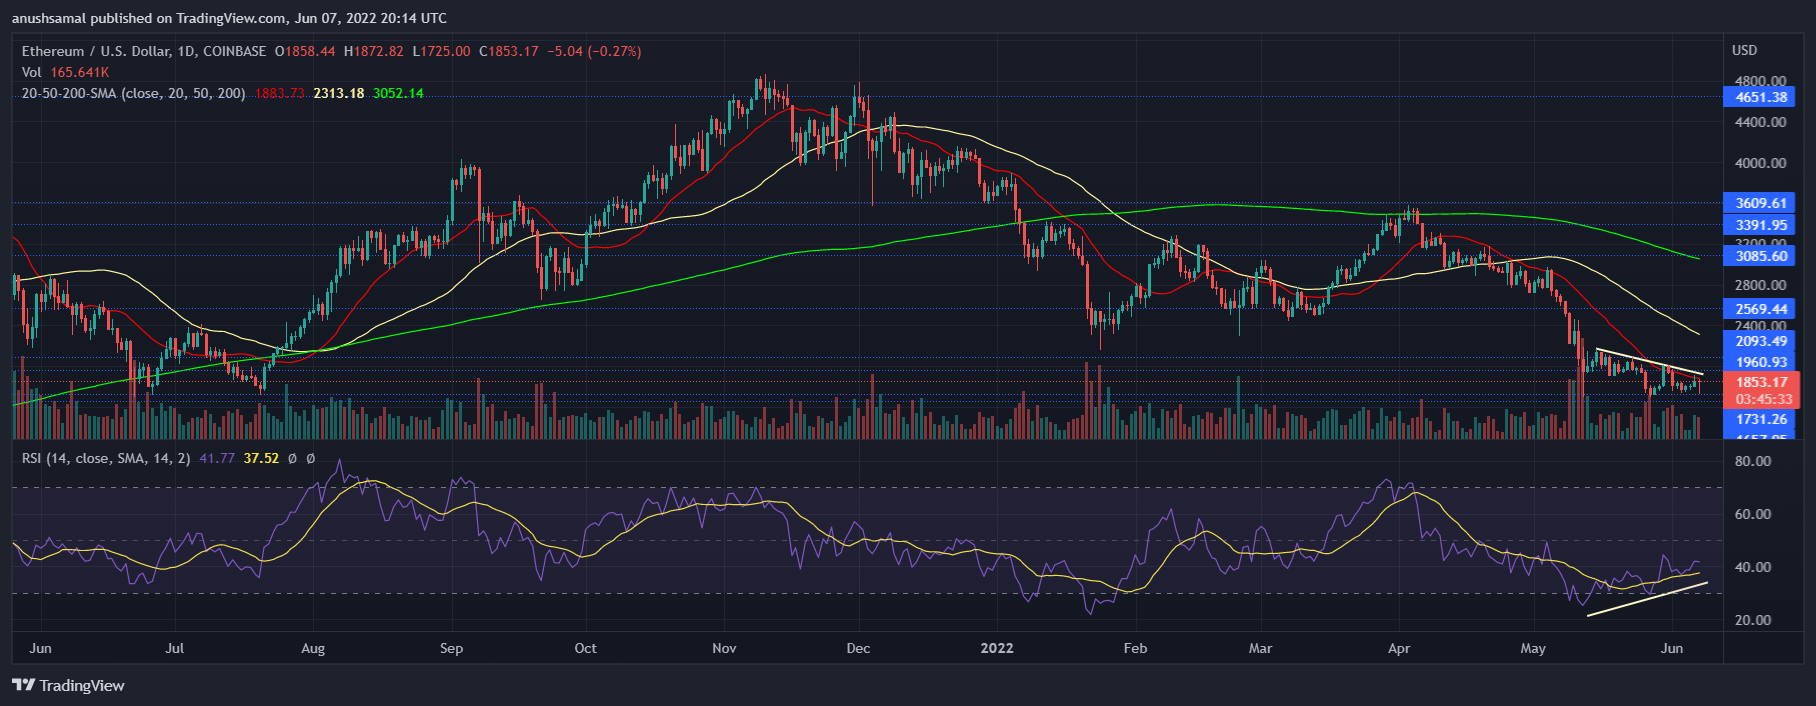
Ethereum displayed bullish divergence on the RSI on the one day chart | Source: ETHUSD on TradingView

The altcoin despite a fall in price noted considerable uptick in the number of buyers in the market. This signal paints optimism for the coin for the upcoming trading sessions. The Relative Strength Index noted a bullish divergence (Yellow).


This occurs when despite a price fall, buying strength increases in the market. This is a sign of upcoming bullishness. The RSI was headed towards the half-line although even at press time sellers outnumbered buyers in the market.


In correspondence to the same reading, Ethereum was pushing hard to rise above the 20-SMA. If it manages to maintain a buying strength the push can cause buyers to drive the price momentum in the market.

Ethereum

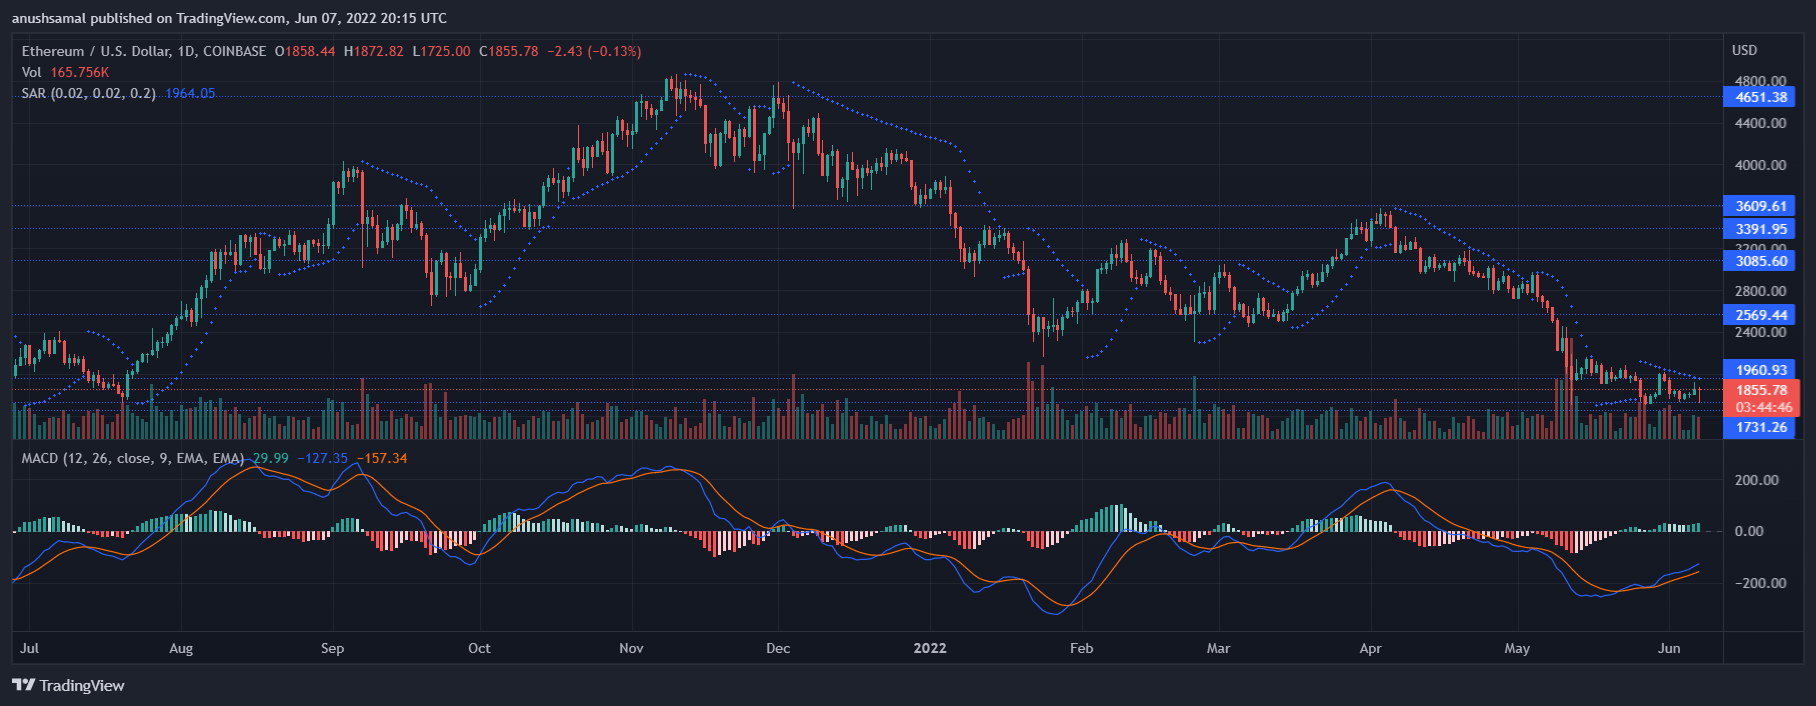
Ethereum registered a buy signal on the one day chart | Source: ETHUSD on TradingView

The altcoin continued to display that the bulls still haven’t completely faded. The Moving Average Convergence Divergence is supposed to read the price momentum and changes in the same. MACD underwent a bullish crossover and portrayed green signal bars.


The green signal bars are tied to a buy signal. If demand helps Ethereum, buyers can push price to $2000. The Parabolic SAR however, showed a trend reversal as the dotted lines moved above the price candlesticks. This is tied with bearishness in the market.


The Parabolic SAR however, is not always reliable while reading trend changes.

Lectures associées

Un portefeuille lié à une exploitation convertit des jetons volés en 18 510 ETH et 1 548 BNB

Un portefeuille lié à une exploitation a converti des actifs compromis en 18 510 ETH (évalués à environ 30,83 millions de dollars) et 1 548 BNB (environ 924 000 dollars), selon une alerte de suivi sur la chaîne partagée par WuBlockchain citant Lookonchain. L'attaquant, associé à des « jetons H » compromis, détient encore 111,36 millions de ces jetons d'une valeur d'environ 14 millions de dollars. Cette conversion vers des actifs plus liquides comme l'ETH et le BNB est une étape courante après une exploitation, souvent avant une tentative de retrait ou de mélange de fonds. Les grands échanges de ce type peuvent exercer une pression sur les liquidités, signaler les prochaines étapes de l'attaquant et offrir de nouvelles pistes de transaction à suivre pour les enquêteurs. Le suivi sur la chaîne, bien qu'utile pour visualiser les mouvements de fonds en temps réel, présente des limites : les portefeuilles peuvent fractionner les actifs rapidement, les déplacer entre différentes chaînes ou utiliser des adresses intermédiaires, compliquant le traçage. Les étiquettes attribuées aux portefeuilles peuvent également changer. Ces données représentent donc un instantané et non une estimation finale des pertes. Cet incident souligne l'utilité des comptes de surveillance sur la chaîne comme Lookonchain, qui peuvent révéler une activité avant la publication d'une enquête officielle. La conversion en actifs liquides rend également plus difficile et urgente toute tentative de récupération des fonds volés.

bitcoinistIl y a 1 h

Un portefeuille lié à une exploitation convertit des jetons volés en 18 510 ETH et 1 548 BNB

bitcoinistIl y a 1 h

« De 119 à 176 dollars » : Derrière l'entrée en bourse de SpaceX, MSX démontre à nouveau le circuit complet de son offre Pre-IPO

Après avoir livré un retour sur investissement de 300% pour Cerebras en mai, MSX a une nouvelle fois démontré l'efficacité de son modèle Pre-IPO avec l'introduction en bourse de SpaceX. Le 12 juin, SpaceX (SPCX) a fait son entrée sur le Nasdaq, atteignant un sommet de 176 dollars. Les utilisateurs de MSX ayant participé au projet Pre-IPO de SpaceX en mars à un prix de souscription de 119 dollars ont ainsi réalisé un gain allant jusqu'à 48%. Ce succès valide le parcours complet proposé par MSX : souscription, conservation, possibilité de rachat avant IPO, introduction en bourse, conversion en actif négociable et règlement. Cela distingue la plateforme d'autres acteurs du secteur, où certains utilisateurs ont dû être remboursés suite à des problèmes d'allocation. Ce résultat fait suite à la réussite similaire de Cerebras en mai, où les souscripteurs MSX avaient enregistré des rendements dépassant 300%. Deux introductions consécutives prouvent que MSX a établi un mécanisme fiable et reproductible pour l'accès à des actifs privés de qualité via la blockchain. Le véritable enjeu des produits Pre-IPO n'est pas seulement d'offrir un accès précoce, mais de garantir une voie de sortie claire après l'IPO. MSX continue d'élargir son portefeuille d'actifs Pre-IPO, ciblant notamment les secteurs de l'IA et des technologies de pointe, afin de permettre aux investisseurs de participer à la croissance des entreprises les plus prometteuses.

Odaily星球日报Il y a 5 h

« De 119 à 176 dollars » : Derrière l'entrée en bourse de SpaceX, MSX démontre à nouveau le circuit complet de son offre Pre-IPO

Odaily星球日报Il y a 5 h

Trading

Spot
Futures
活动图片