Ethereum Price On The Verge Of Rectangle Pattern Breakout: Is $2000 Within Reach?

newsbtcPublié le 2023-07-12Dernière mise à jour le 2023-07-12

Résumé

Over the past few days, the Ethereum price has remained relatively stable, with minor gains seen on the daily chart. Meanwhile, Bitcoin's indecisiveness has resulted in slower movement for altcoins....

Over the past few days, the Ethereum price has remained relatively stable, with minor gains seen on the daily chart. Meanwhile, Bitcoin’s indecisiveness has resulted in slower movement for altcoins.
Despite this, Ethereum has risen on its chart, although the technical outlook suggests low demand and accumulation due to reduced buying strength.
Despite the fall in buying strength, buyers still hold an advantage over sellers in the market. However, if Ethereum fails to move above its immediate resistance, the coin may retrace on its chart, potentially falling below its local support level and activating bearish sentiment.
Investors are now looking ahead to the release of US CPI data, which analysts predict will significantly impact the market in the coming weeks. The market capitalization of Ethereum has fallen slightly, indicating slow demand for the altcoin.
Ethereum Price Analysis: One-Day Chart

Ethereum

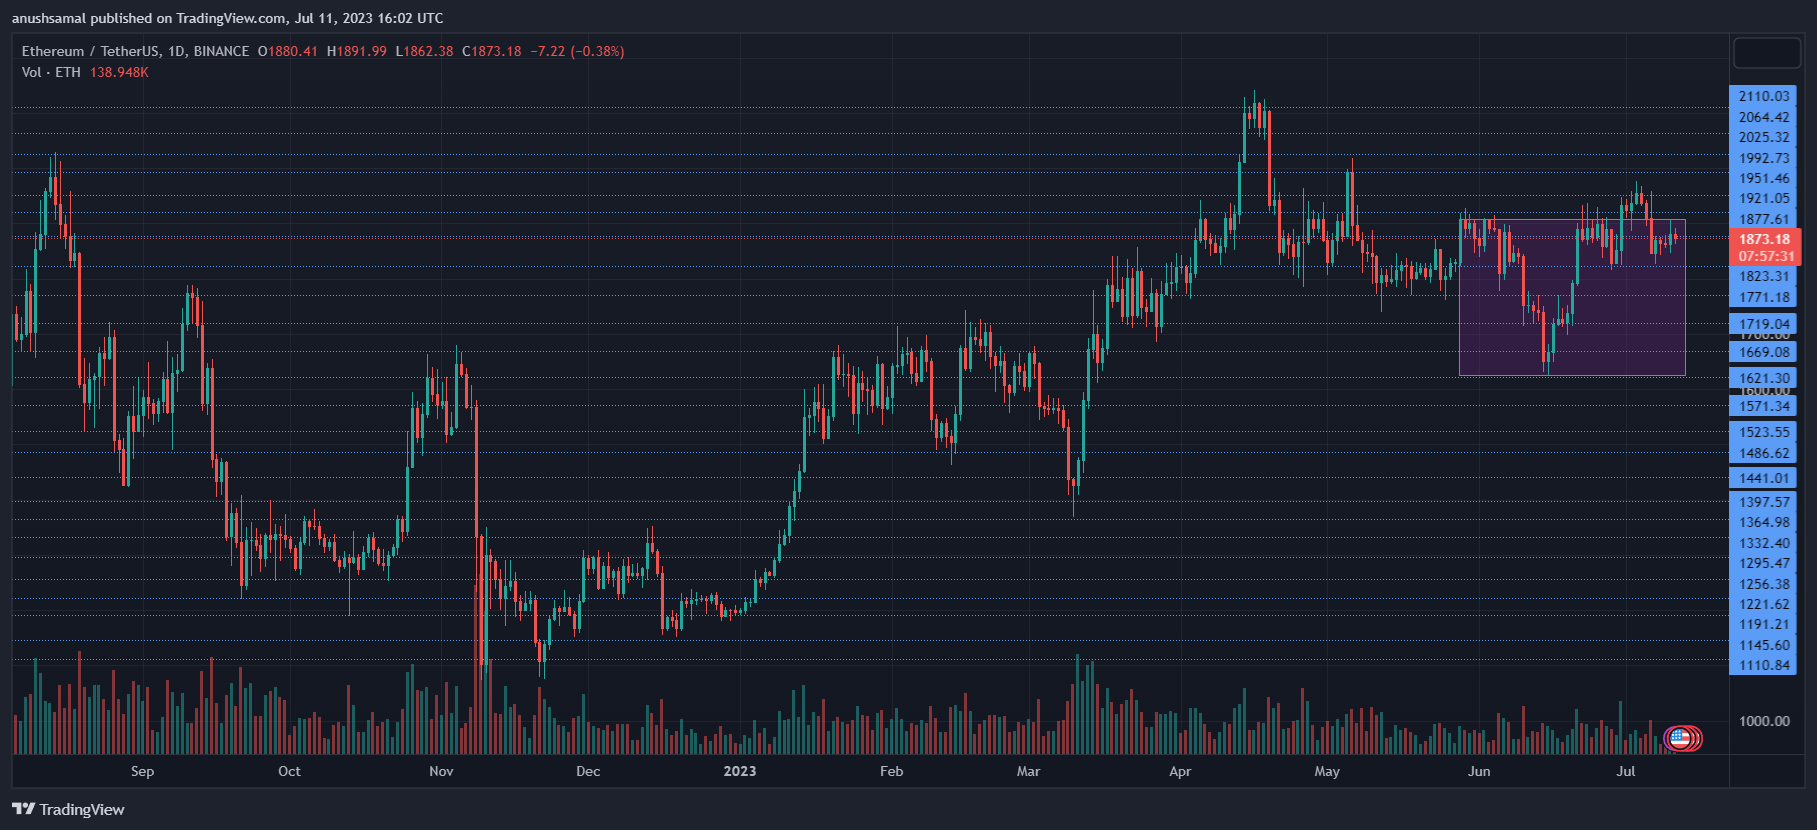
Ethereum was priced at $1,870 on the one-day chart | Source: ETHUSDT on TradingView

At the time of writing, ETH was priced at $1,870. The daily chart indicated a potential breakout as the price approached the upper boundary of a rectangle pattern. The crucial overhead resistance for Ethereum was identified at $1,880.
If the price managed to surpass this level, it could potentially exceed $1,900 and ultimately reach the milestone of $2,000.
However, it was essential for ETH to surpass the $1,880 mark in the upcoming trading sessions. On the downside, there was a local support level of $1,820. A dip below this point could lead to a decline towards $1,770.

Ethereum

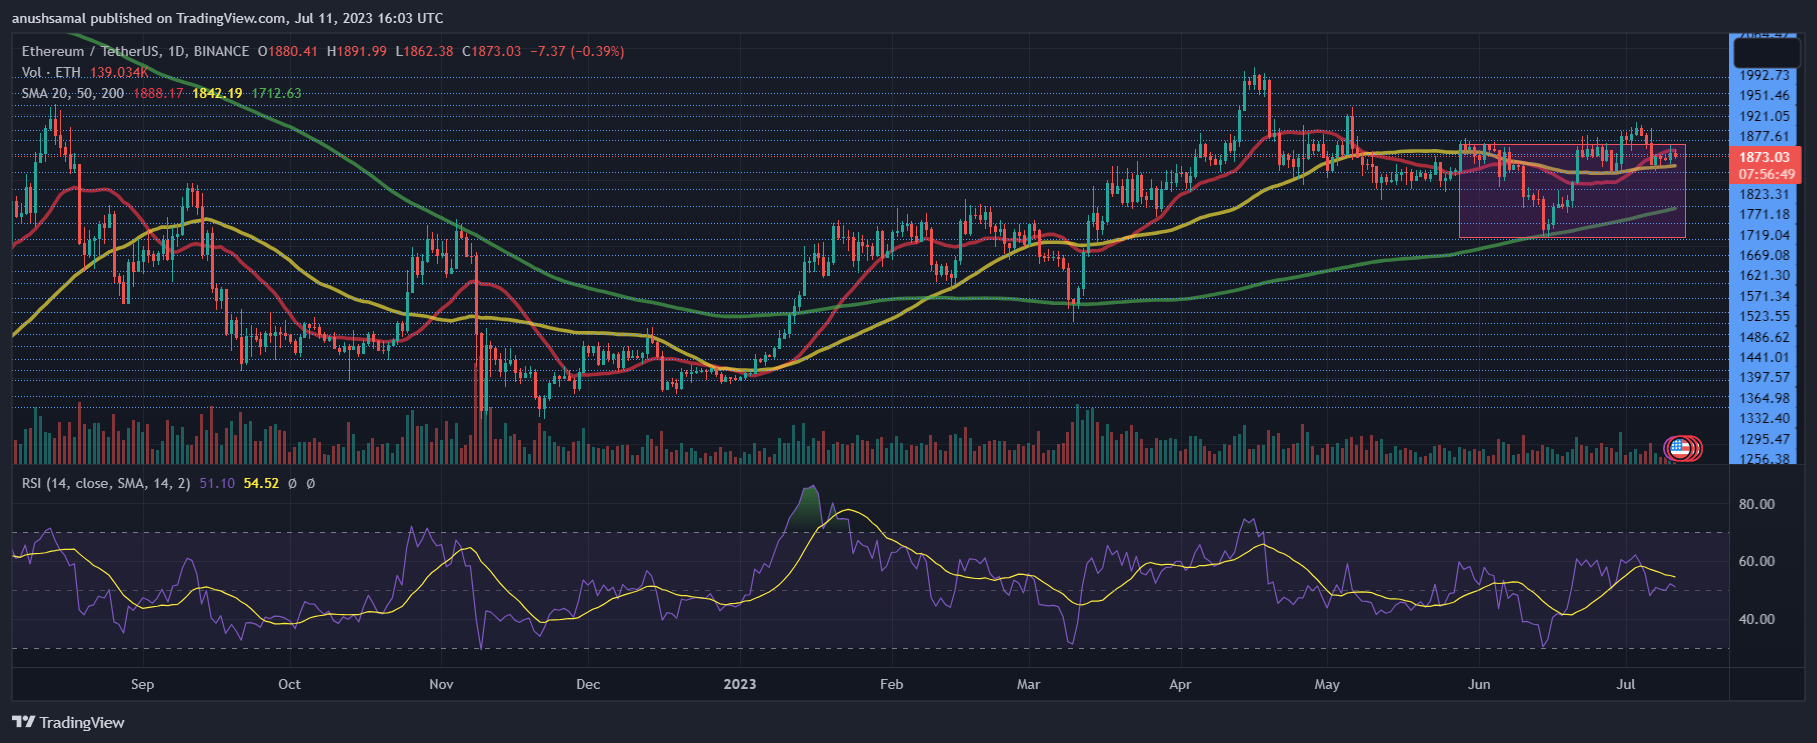
Ethereum depicted a downtick in demand on the one-day chart | Source: ETHUSDT on TradingView The inability to break through the $1,900 level had a detrimental impact on investor confidence, resulting in ongoing challenges for Ethereum regarding demand on the daily chart. The Relative Strength Index (RSI) remained positive, although it suggested a relatively low level of demand.
Furthermore, Ethereum’s current position below the 20-Simple Moving Average line indicated a decline in buying strength, indicating that buyers were gradually losing control of the price momentum.

Ethereum

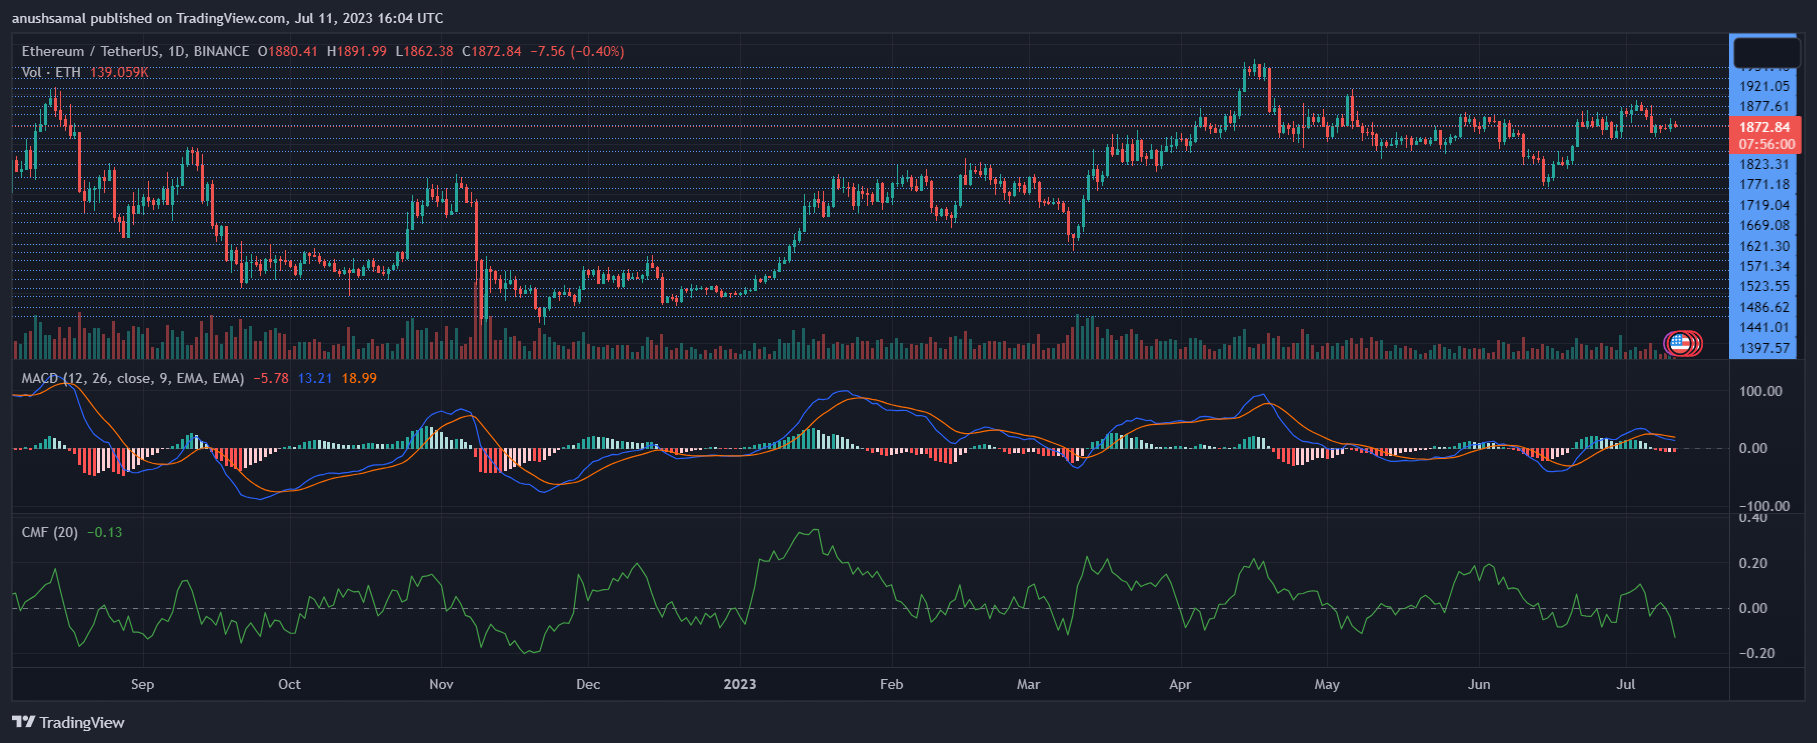
Ethereum depicted an increase in capital outflows on the one-day chart | Source: ETHUSDT on TradingView In addition to the low buying strength, ETH also experienced a decline on capital inflows. This indicated a decline in investor interest, as evidenced by the Chaikin Money Flow indicator.
Conversely, the Moving Average Convergence Divergence (MACD) formed declining red histograms, suggesting a potential breakout in the upcoming trading sessions. The MACD is a useful tool for identifying price momentum and trend changes.
The next trading sessions will be critical for ETH. It will determine whether the market will be driven by bears or bulls, ultimately influencing the price.

Lectures associées

La sénatrice Lummis pousse pour un vote sur la loi CLARITY avant la suspension des travaux parlementaires

La sénatrice Cynthia Lummis presse le Sénat américain de voter la loi CLARITY avant la période de congés, relançant ainsi le débat sur la réforme de la structure du marché des cryptomonnaies aux États-Unis. Ce projet de loi vise à clarifier la répartition de la supervision des actifs numériques entre les autorités des marchés de valeurs mobilières (SEC) et des matières premières (CFTC). L'industrie réclame depuis des années un cadre réglementaire plus précis pour les émissions de tokens, l'enregistrement des plateformes d'échange, la garde d'actifs et le domaine de la finance décentralisée (DeFi). Une avancée législative serait perçue comme un signe positif, susceptible d'encourager la participation des investisseurs institutionnels qui exigent une plus grande clarté juridique. Pour les acteurs du marché, l'enjeu est de transformer l'incertitude réglementaire actuelle en un cadre défini. Une adoption de la loi CLARITY pourrait soutenir l'essor des infrastructures institutionnelles. À l'inverse, un blocage maintiendrait le secteur dans un paysage fragmenté, régi principalement par des actions enforcement des régulateurs. Ainsi, le calendrier parlementaire constitue un test crucial pour savoir si la politique américaine en matière de cryptomonnaies peut passer du stade des discussions à celui de lois concrètes.

bitcoinistIl y a 18 mins

La sénatrice Lummis pousse pour un vote sur la loi CLARITY avant la suspension des travaux parlementaires

bitcoinistIl y a 18 mins

Le cycle du Bitcoin « évolue, mais n'est pas cassé » – Analyse de 21Shares

21Shares a publié son dernier rapport "State of Crypto", soutenant que le cycle de marché quadriennal traditionnel du Bitcoin n'est pas rompu. Bien que de nombreux analystes aient cru que le cycle s'était terminé début 2026, l'évolution du prix du BTC ressemble toujours étroitement aux cycles post-réduction de moitié précédents. Après un pic à près de 126 000 $ en octobre 2025, Bitcoin a subi une correction. Cependant, le repli actuel d'environ 50 % est moins sévère que les baisses de 80 à 90 % des cycles baissiers passés. Fait notable, le prix n'est pas encore tombé sous sa base de coût agrégée (54 000 $), évitant ainsi une capitulation généralisée qui marque traditionnellement le fond des cycles. Le rapport souligne que des fondamentaux plus solides ne rendent pas le Bitcoin imperméable aux cycles de marché, la sentiment restant lié aux conditions macroéconomiques. 21Shares projette néanmoins une reprise potentielle vers 100 000 $ d'ici fin 2026. Des signes de stress apparaissent, avec des sorties nettes des ETF en juin et mai 2026. Le ratio LTH/STH SOPR, récemment tombé à 0,7, indique que la pression vendeuse provient principalement des détenteurs à court terme. Une exposition gamma nette négative des market makers suggère également une volatilité potentiellement accrue. En résumé, le cycle du Bitcoin évolue mais n'est pas cassé. La prudence des investisseurs à court terme persiste, tandis que l'adoption institutionnelle continue de renforcer les fondamentaux à long terme.

ambcryptoIl y a 2 h

Le cycle du Bitcoin « évolue, mais n'est pas cassé » – Analyse de 21Shares

ambcryptoIl y a 2 h

Trading

Spot
Futures
活动图片