Bitcoin Cash: What’s the best entry point for buyers as BCH goes on a rally

AmbcryptoPublié le 2023-07-05Dernière mise à jour le 2023-07-05

Résumé

Even though waiting for a significant drop before buying sounds like a good plan, the majority of the market expects the same- Will the price action follow what the majority expects?

Disclaimer: The information presented does not constitute financial, investment, trading, or other types of advice and is solely the writer’s opinion.

The price action of BCH and retracement levels lined up pretty well near the $200 mark.

Yet this could be precisely why such a retracement could be risky for the buyers.

Bitcoin Cash [BCH] embarked on a rally that measured 214% in magnitude. The bulls accomplished this feat in under two weeks. While the price action and indicators showed strong bullishness, this was not a time for FOMO.

Traders can instead look to capitalize on a retracement if the market gives one. But Fib retracement levels are a popular tool, and if the entire market is looking at certain levels for a bullish reaction, it could become easy to trap the bulls before the real move.

Will Bitcoin Cash retrace some of its vast gains?

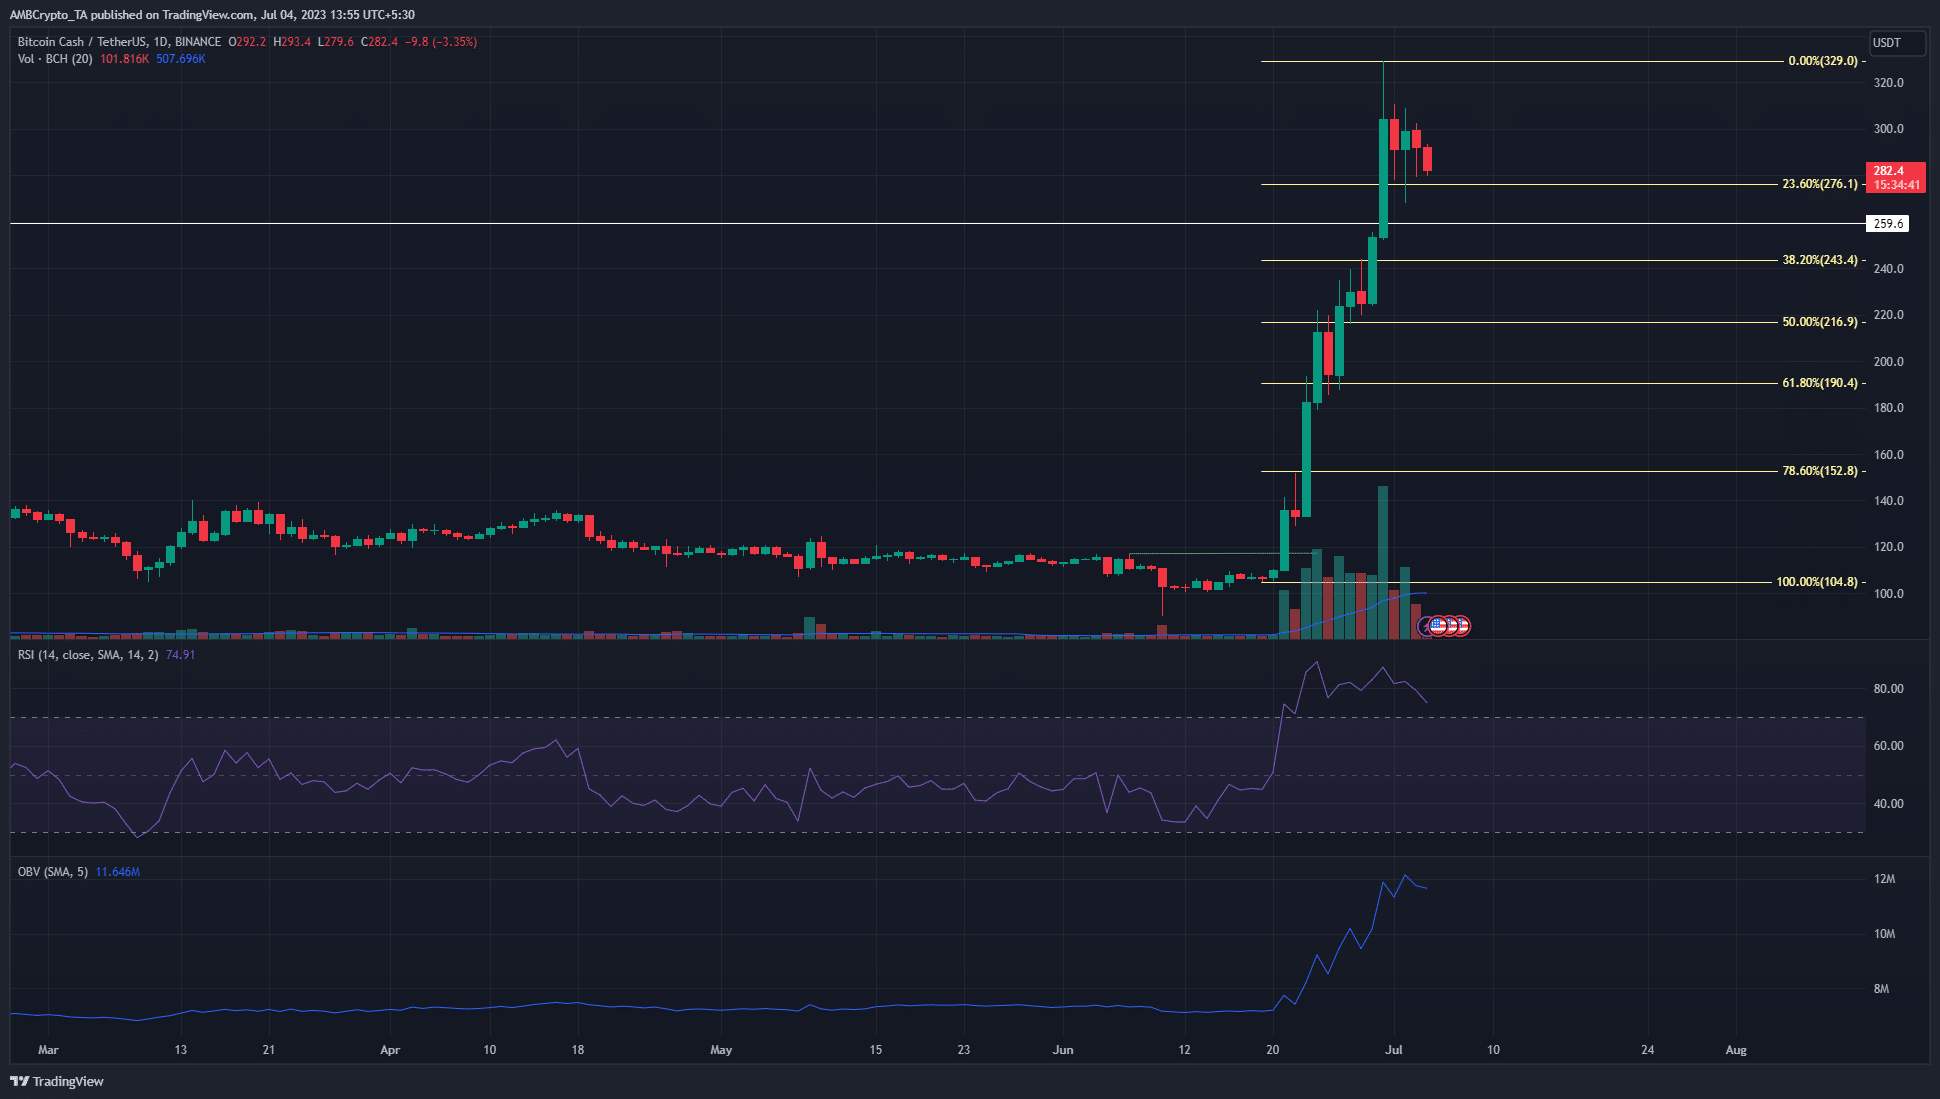
Source: BCH/USDT on TradingView

It was very likely that BCH would retrace at least a portion of its recent gains. But how much would that be? Will the bears begin to shed all the gains from the vertical upward move? This was possible. But with Bitcoin having a bullish bias on the higher timeframes, there could be another bullish move left for BCH in the coming weeks or months.

The RSI began to form a bearish divergence while BCH fell close to 15% from the high at $329. However, the price action remained strongly bullish. The Fibonacci retracement levels were drawn after BCH flipped its structure to bullish on the 1-day timeframe.

The 50% and 61.8% retracement levels lie at $190.4 and $216.9. Interestingly, a large red candle was present in this zone as well. Formed on 25 June, this area represented a region where some lower timeframe consolidation occurred before the explosive surge past $300.

Therefore, a revisit to this area could offer a buying opportunity. Bulls can look for a positive reaction from the $190-$220 region and another bullish structure break before looking to buy BCH- but must beware of becoming liquidity before a deeper retracement.

The rapid fall in the mean coin age could mean trouble
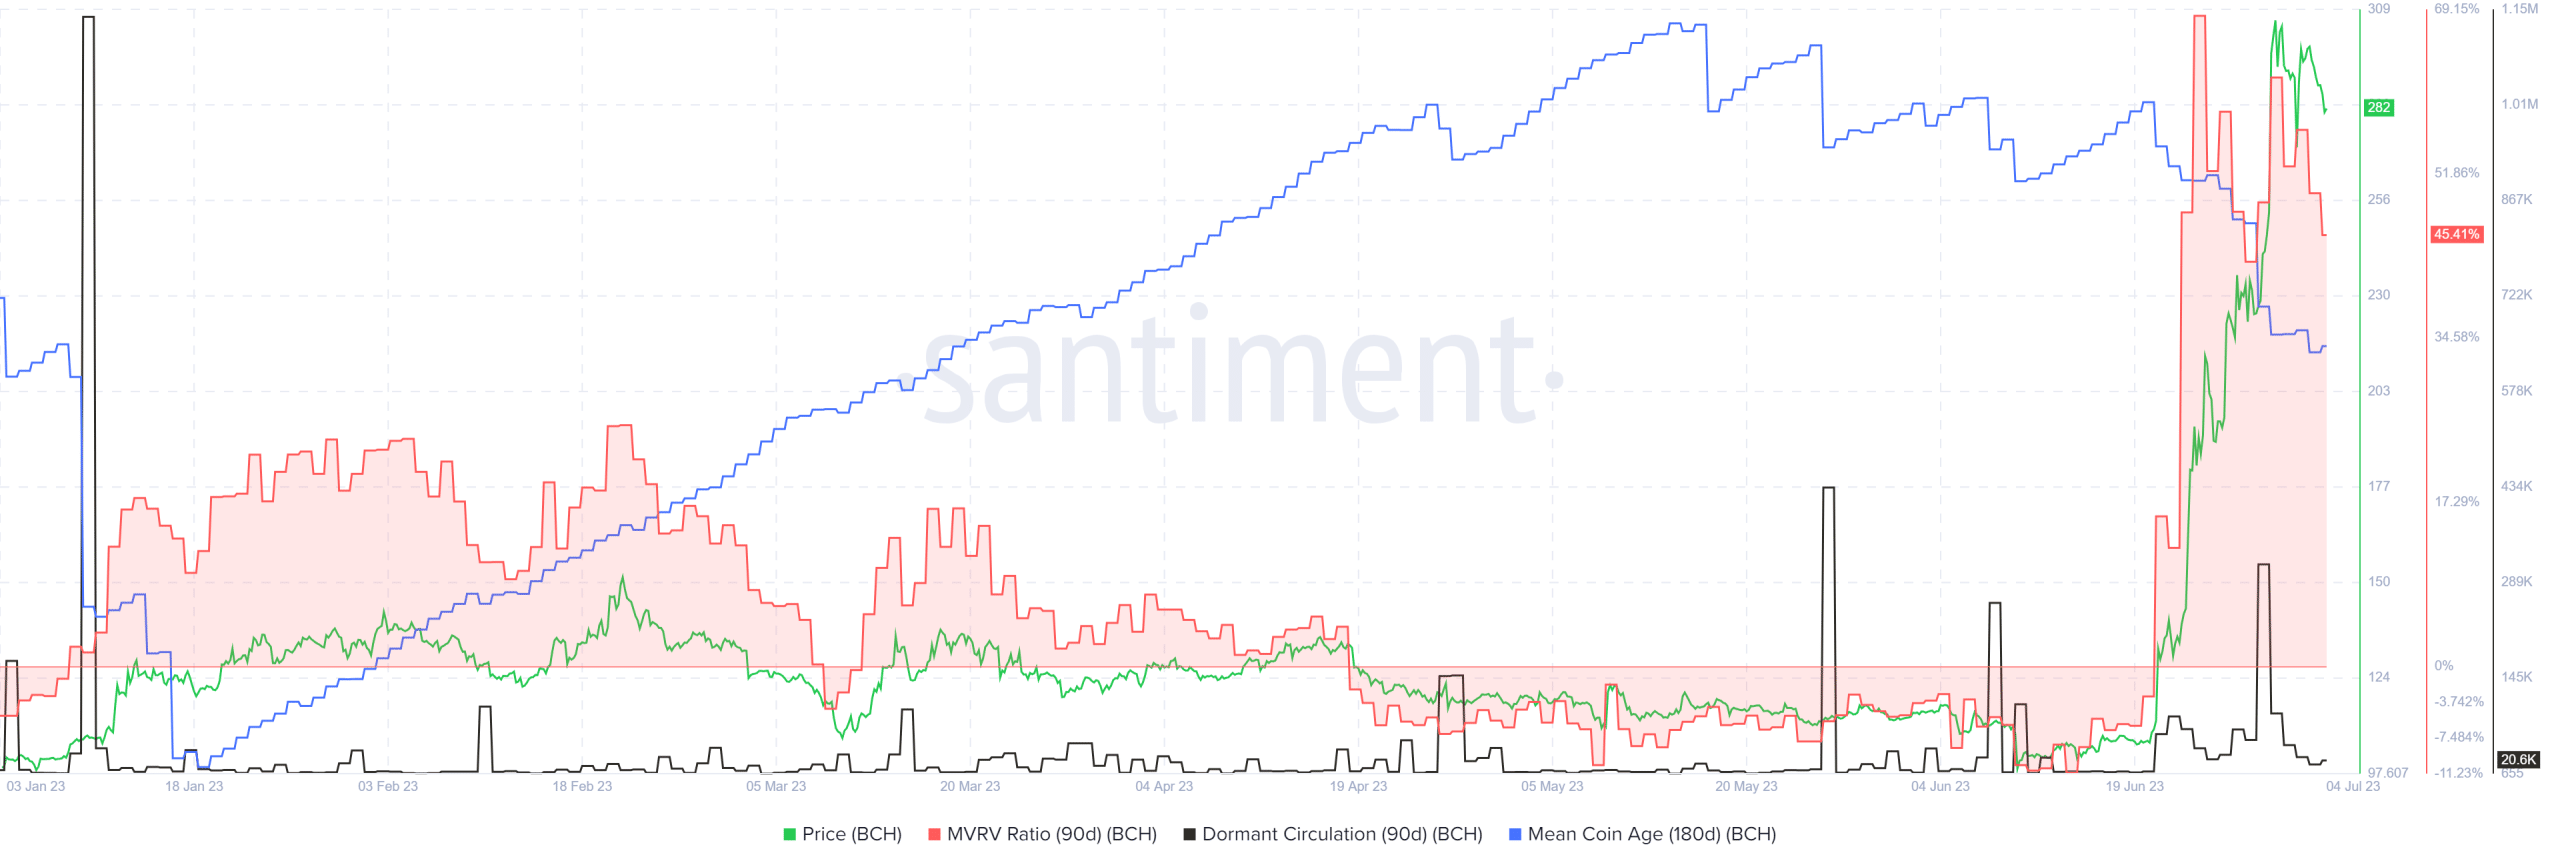
Source: Santiment

While the OBV shot upward to show strong buying pressure, the mean coin age was not as bullish. The metric began to decline even as Bitcoin Cash rocketed higher on the chart. The mean coin age was already in a downtrend in May and fell sharply as the asset embarked on its rally.

This showed a heightened movement of BCH between addresses, a sign that likely points toward increased selling. The MVRV ratio was also at a nearly two-year high. Taken together they suggested that sellers could force Bitcoin Cash lower once more.

A spike in the dormant circulation coincided with the surge to $329, which suggested a flurry of selling activity could have taken place then.

Lectures associées

Le cycle du Bitcoin « évolue, mais n'est pas cassé » – Analyse de 21Shares

21Shares a publié son dernier rapport "State of Crypto", soutenant que le cycle de marché quadriennal traditionnel du Bitcoin n'est pas rompu. Bien que de nombreux analystes aient cru que le cycle s'était terminé début 2026, l'évolution du prix du BTC ressemble toujours étroitement aux cycles post-réduction de moitié précédents. Après un pic à près de 126 000 $ en octobre 2025, Bitcoin a subi une correction. Cependant, le repli actuel d'environ 50 % est moins sévère que les baisses de 80 à 90 % des cycles baissiers passés. Fait notable, le prix n'est pas encore tombé sous sa base de coût agrégée (54 000 $), évitant ainsi une capitulation généralisée qui marque traditionnellement le fond des cycles. Le rapport souligne que des fondamentaux plus solides ne rendent pas le Bitcoin imperméable aux cycles de marché, la sentiment restant lié aux conditions macroéconomiques. 21Shares projette néanmoins une reprise potentielle vers 100 000 $ d'ici fin 2026. Des signes de stress apparaissent, avec des sorties nettes des ETF en juin et mai 2026. Le ratio LTH/STH SOPR, récemment tombé à 0,7, indique que la pression vendeuse provient principalement des détenteurs à court terme. Une exposition gamma nette négative des market makers suggère également une volatilité potentiellement accrue. En résumé, le cycle du Bitcoin évolue mais n'est pas cassé. La prudence des investisseurs à court terme persiste, tandis que l'adoption institutionnelle continue de renforcer les fondamentaux à long terme.

ambcryptoIl y a 19 mins

Le cycle du Bitcoin « évolue, mais n'est pas cassé » – Analyse de 21Shares

ambcryptoIl y a 19 mins

Le RSI Hebdomadaire du XRP Flashe un Signal de Survente Tandis que les Traders Surveillent le Support à 1,10 $

Le XRP a atteint une configuration technique de survente, certains traders la comparant aux conditions observées lors des creux de cycle précédents. Le token teste actuellement une zone de support clé autour de 1,10 $, tandis que son RSI hebdomadaire est entré en territoire fortement survendu. Ce signal technique attire l'attention car il survient alors que le XRP évolue habituellement selon un mélange de dynamique technique, d'actualités réglementaires et de cycles de liquidité. La question principale est de savoir si cette lecture de survente reflète une capitulation des vendeurs ou simplement la faiblesse d'un actif dans un marché baissier. La réponse dépendra de la capacité des acheteurs à défendre le niveau de support et de la stabilisation du marché crypto au sens large. En tant qu'altcoin de grande capitalisation suivi de près, les configurations techniques sur le XRP peuvent attirer rapidement l'attention des traders, mais cela comporte aussi un risque : les tentatives de rebond populaires peuvent s'inverser rapidement si le Bitcoin reste faible. Par conséquent, le signal RSI est avant tout un indicateur que le XRP se trouve à un point de décision important. Il ne garantit pas un plancher, mais suggère que le prochain mouvement autour du support pourrait façonner le sentiment des traders pour les sessions à venir. Dans l'ensemble, cette situation s'inscrit dans un contexte de marché plus large marqué par une liquidité réduite, des interrogations politiques et le développement de produits institutionnels. Elle doit donc être analysée comme un élément de cette structure de marché globale, et non comme un catalyseur de prix isolé et garanti.

bitcoinistIl y a 23 mins

Le RSI Hebdomadaire du XRP Flashe un Signal de Survente Tandis que les Traders Surveillent le Support à 1,10 $

bitcoinistIl y a 23 mins

Trading

Spot
Futures
活动图片