Bitcoin closed its first week of July in the green at $30,617, recording three consecutive bullish weekly candles since mid-June.
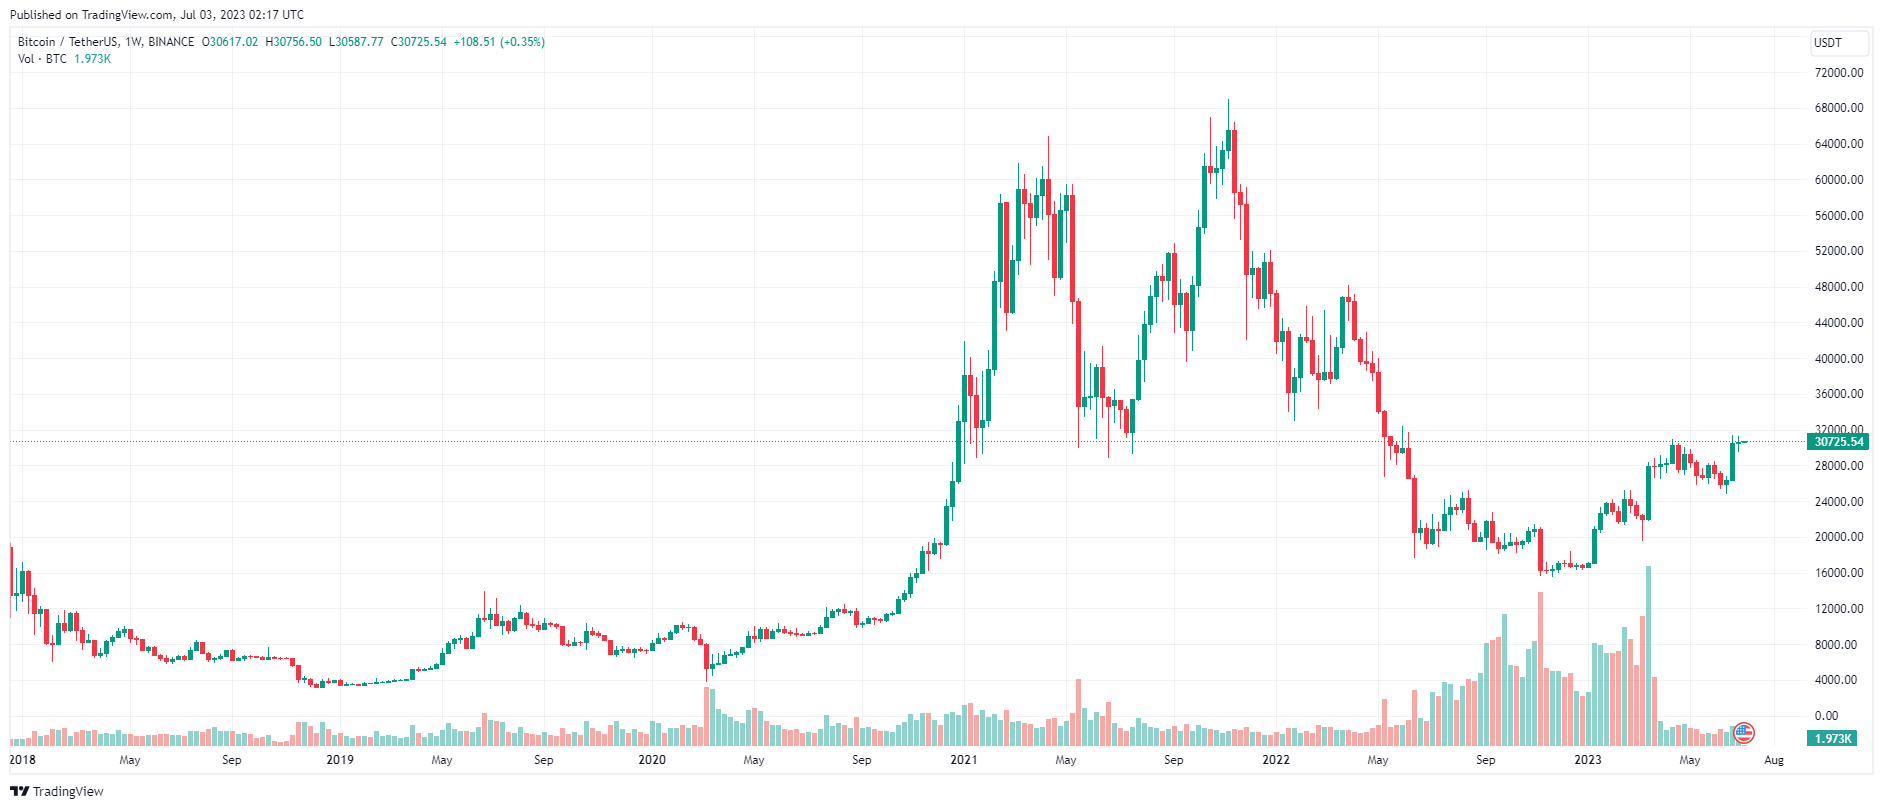
BTC Price Chart – 1 week | Source: TradingView
U.S. stock market futures were little changed on Sunday night, as traders braced for the second half of the year, as the market closed out the first half of 2023 with strong growth.
Futures contracts tied to the Dow Jones Index fell 17 points; S&P 500 and Nasdaq-100 futures were mostly unchanged.
Tesla shares were little changed in overnight trading after the electric-car maker reported delivery and production numbers that beat analyst expectations. Shares of United fell slightly as bad weather contributed to flight disruptions for the airline over the long holiday weekend.
Stocks are gearing up for the start of 2023. On Friday, the Nasdaq Composite closed with its highest first-half growth since 1983, up 31.7%; while the S&P 500 gained 15.9%, marking its best first half of the year since 2019. The Dow Jones index, up 3.8% for the period.
This comes as enthusiasm around artificial intelligence drives tech stocks. Recent data showing the US economy is resilient despite higher interest rates also helped lift investor sentiment, easing some fears on Wall Street about the recession that has been awaited since long.
Stocks began a short trading week on Monday, with markets closed for the National Day holiday. Investors will look at the latest PMI data for June on Monday morning, ahead of Friday's key jobs report.
Journalist Wu Blockchain shared a report showing that the value of Bitcoin increased by 83.8% in the first half of 2023, topping and outpacing other major assets in the world. In second place is Nasdaq with a value increase of 31.7%.
With a 37% drop, natural gas was in last place after prices of other energy sources also plummeted during the year.
Bitcoin's trajectory in 2023 is clear and bullish. The leading cryptocurrency has started the year with strong bullish sentiment, having bounced up 47% in the first month of the year, setting the stage for the following weeks.
Bitcoin's price then dropped to $19,569 in March, after crossing the $25,000 mark for the first time since August 2022.
Many Bitcoin analysts have identified a rise above $25,000 as the key move to confirm the end of the bear market. Despite the subsequent drop, the majority of Bitcoin supporters see this as an opportunity for consolidation and accumulation. That belief is supported by predictions of a bull run before the next halving event, which takes place in 2024.
Another phase of the uptrend returned to the Bitcoin market in mid-March. The top Cryptoasset surged more than 58% in about 4 weeks, as the price surpassed the $30,000 mark for the first time since June 2022.
After that spike, Bitcoin entered another accumulation phase, returning to the $25,000 support area. After hitting a local Dip at $24.756, the upside momentum has returned above $30,000.
Data from TradingView shows that Bitcoin closed June above the $30,000 region. Bitcoin also just ended the first week of July in the green at $30,617, recording three consecutive weeks of growth since mid-June.
Altcoin markets continue to thrive after Bitcoin stoked hopes of a fresh bull run.
Leading the way is Compound (COMP) with a strong growth of nearly 30% on the day, bringing the total profit this project has recorded in the past 7 days to more than 76%.
The Graph (GRT) and Flow (FLOW) are two projects that have shown gains of over 10% in the last 24 hours, bouncing 14% and 11% respectively.
BitDAO (Bit), Maker (MKR), Litecoin (LTC), Bitcoin Cash (BCH), Filecoin (FIL), Polkadot (DOT), Solana (SOL)… are also projects with good day activity, with profit from 4-9%.
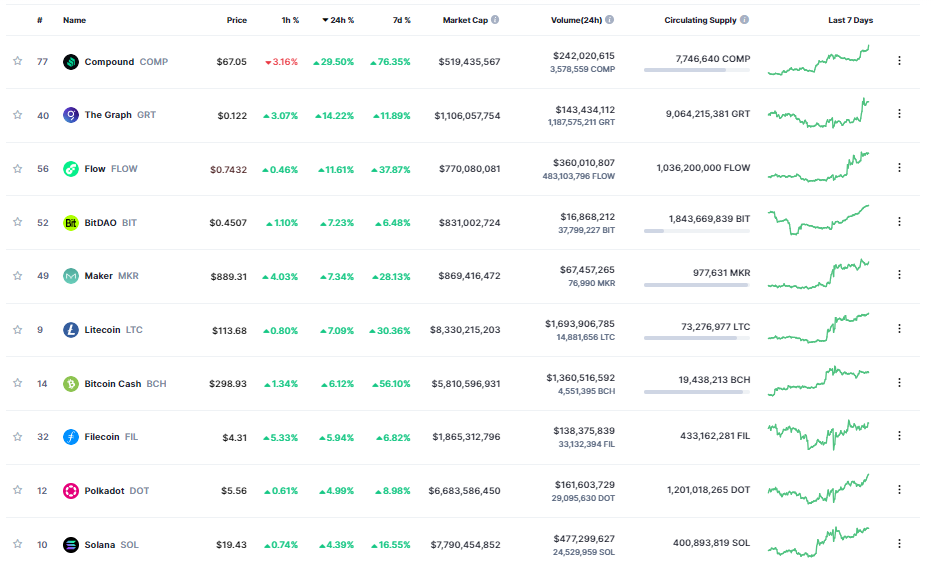
Source: Coinmarketcap
Ethereum (ETH) continues to show strength during the day. After successfully defending the price above the $1,900 area, the market's largest smart contract Token has been trying to break through $1,950, in an attempt to head towards its highest peak since early June.
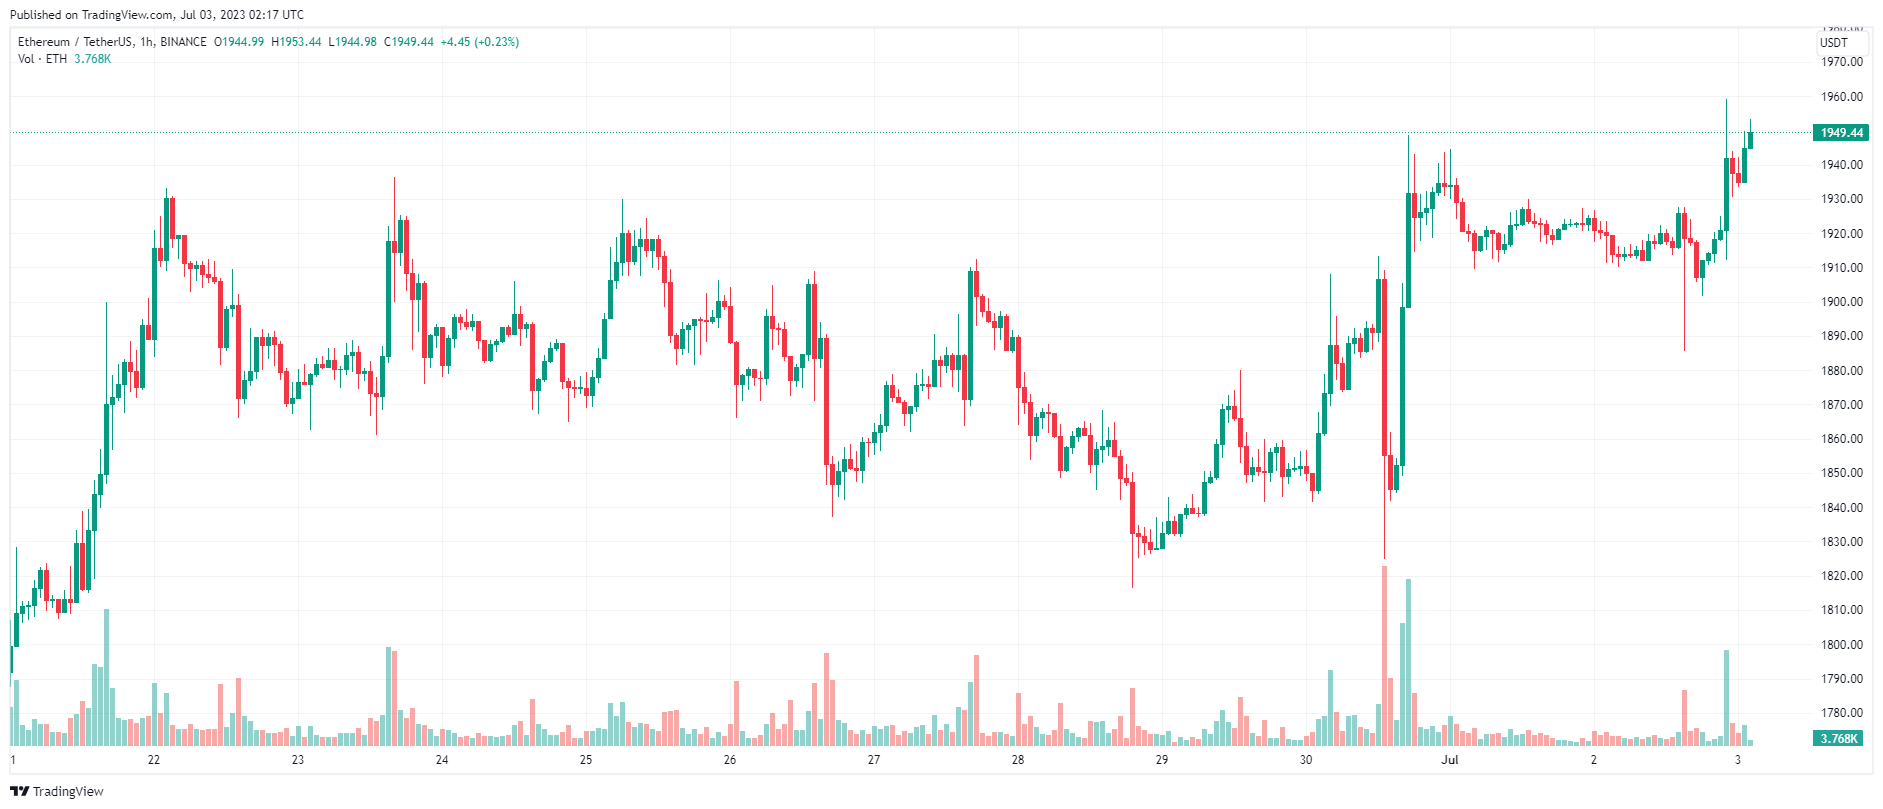
ETH price chart – 1 hour | Source: TradingView