
Abstract
2022 was a tough year for Bitcoin and Crypto Markets. We have seen cascades of capitulations. While people are expecting a $10k Bitcoin price, the market seems to have proved them wrong. We review the price development of Bitcoin in this cycle and arrive at a more solid expectation.
Bitcoin, being a risky asset, together with other major cryptos, are significantly affected by the contraction and expansion of macro liquidity. This analysis views Bitcoin in the lens of macro liquidity modelling and debunks the major driving forces behind Bitcoin and cryptos.
This analysis is composed of three sections. The first section defines and explains the correlation between the liquidity source (Fed Balance Sheet in this case) with the general crypto market as a risky asset. The second section debunks major driving forces behind the Fed Balance Sheet Liquidity. The third (last) section suggests various important Bitcoin on-chain metrics which can be interpreted together with the liquidity models.
Chapter 1 — Defining the correlation between liquidity source (Fed Balance Sheet) and Risky Assets (Cryptos)
1.1 A surfeit of liquidity in the Fed Balance Sheet pumped risky assets
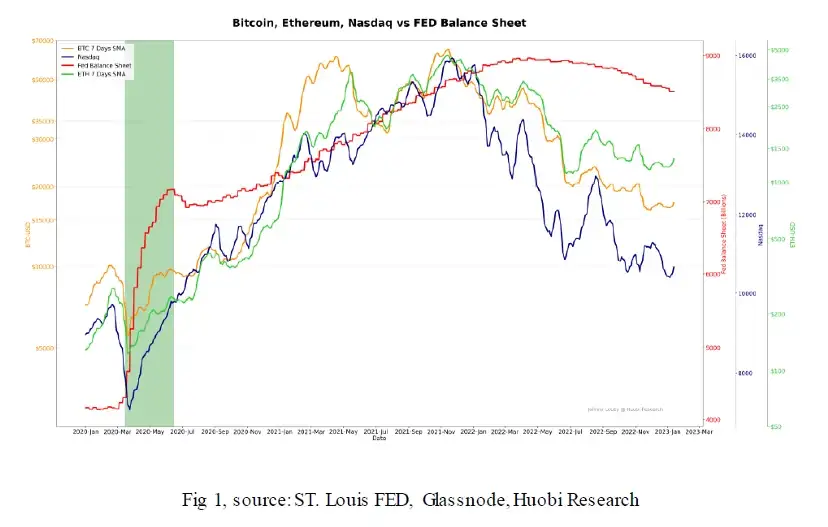
Since 2020 started the Covid Crash, the Fed adopted QE and inflated their balance sheet significantly. The money created circulated into various markets, and crypto was one of the outperforming risky assets.
Below is a chart featuring the correlation between Fed Balance Sheet and risky assets. The green shaded area represents the liquidity bootstrap period when the Fed injected tremendous liquidity.
1.2 Sub-zero rates encouraged more economic activities (lending & borrowing, investments)
There was also an additional contributor to Crypto’s crazy rally in 2020 — U.S. T-bill yields hanging sub-zero levels, plus a surfeit of liquidity in commercial banks.

The light-blue shaded area represents the sub-zero rates period, which incentivized economic activities. It is also worth noticing that the excess liquidity in commercial banks came from the Fed, aggressively purchasing treasuries from these banks. As the interest rate does not guarantee considerable returns that the yield is at a sub-zero level, money instead seeks for more lucrative opportunities other than the money market, such as equities. Borrowing and lending activities were readily enabled so that institutional adoption was fast-paced in 2020.
1.3 Quantitative Tightening Stealthily Began Before the Fed Announced
The situation was tricky because liquidity started to dry up in Jan 2022, signatured by the exponentially increasing amount of Reverse Repo (Please refer to section 2.1 for a complete explanation of Reverse Repo).
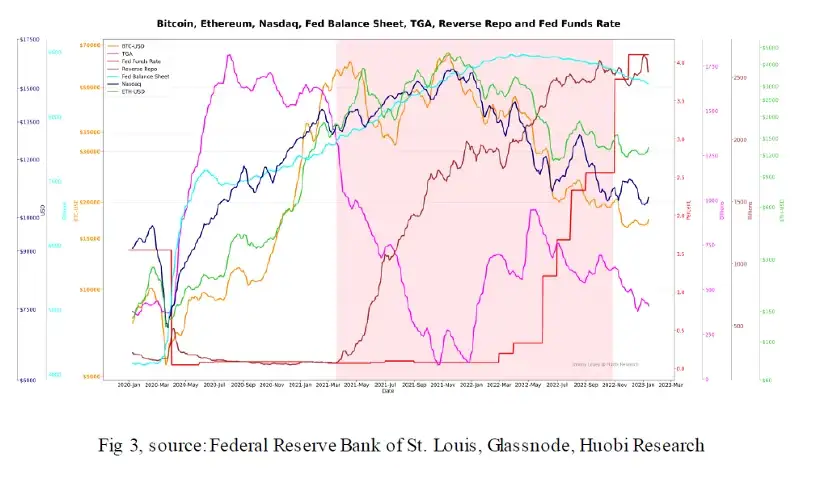
The red shaded area represents the period where the demand for Reverse Repo surged exponentially, money preferred less risky investments instead of risky assets.
The expression of “Quantitative Tightening stealthily began in Jan 2022” depicts the nadir of TGA in Dec 2021. The increase in TGA in Jan 2022 is, in other words, a decrease in bank reserves, which was detrimental to economic activities, especially market participation in risky assets. Driving forces behind the liquidity will be elaborated in Chapter 2.
Chapter 2 — Debunking Fed Balance Sheet and extracting liquidity drivers
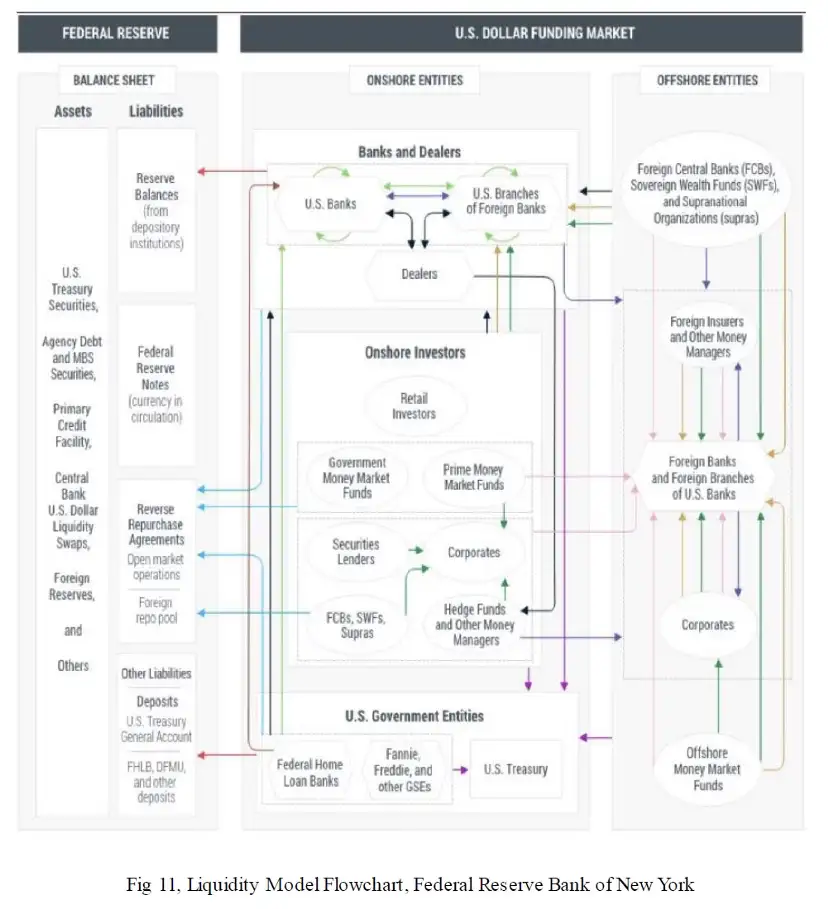
The Fed Balance Sheet is mainly composed of three important elements when considering effective drivers of liquidity: Total Assets, Treasury General Account, and Reverse Repurchase Agreement. It is critical to understand how these three elements affect the markets.
2.1 Understanding Reverse Repurchase Agreement
Reverse Repurchase Agreement is an instrument used by the Fed to control the Fed Funds Rate and liquidity to “cool the markets”[1].
The Fed adjusts the Effective Federal Funds Rate (i.e., interest rate) by raising and lowering the award rate for Reverse Repo and Interest Rate On Reserve Balance (IORB).
In simple terms, when the Fed raises interest rate, they increase the award rate for Reverse Repo, making Reverse Repo more attractive because the rewarding interest rate increases, therefore money market funds will park their huge liquidity into RRP. Thus, liquidity is absorbed by the Fed, since it is the best risk-free investment to all investors.
[1] For a complete explanation, please refer to my report: https://medium.com/huobi-research/reverse-repurchase-agreements-as-an-indicator-for-btc-ca8619442890)
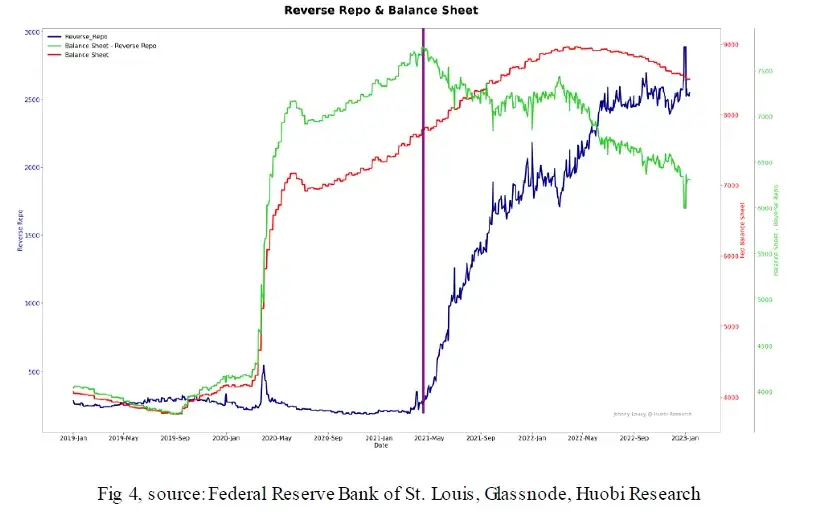
Please note that RRP started to climb up significantly since April 2021, despite that the Fed kept inflating their Balance Sheet. QT actually began in mid-April 2021, indicated by the purple line, when Total Asset of Fed (minus RRP) peaked. Since April, Reverse Repo was increasing significantly, withdrawing liquidity from the markets.
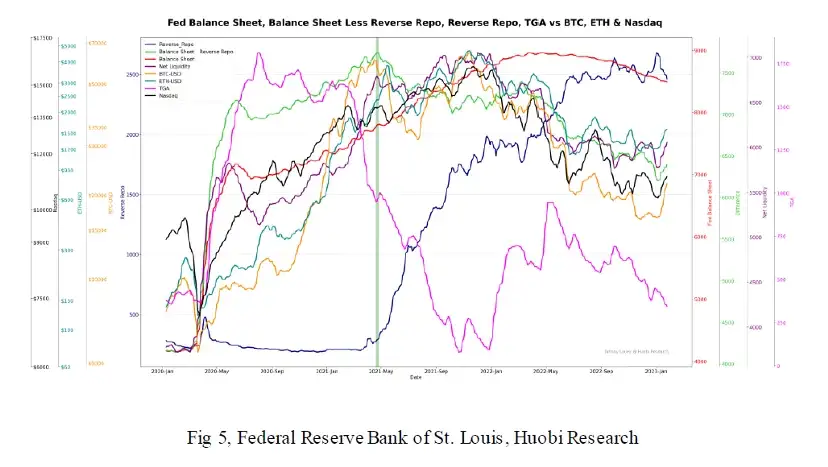
Fig 5 shows that the Balance Sheet Minus Reverse Repo peaked and coincidently Bitcoin also peaked at that time. Bitcoin entered a distribution phase (could be due to less liquidity availability, refer to Net Liquidity first time tumbling and struggling to climb up higher), plus denoted by its Wyckoff Distribution pattern.
There is no doubt that RRP exhibits an inverse relationship with risky assets, therefore I created an Inverted RRP Indicator, illustrating the positive correlation with risky assets.
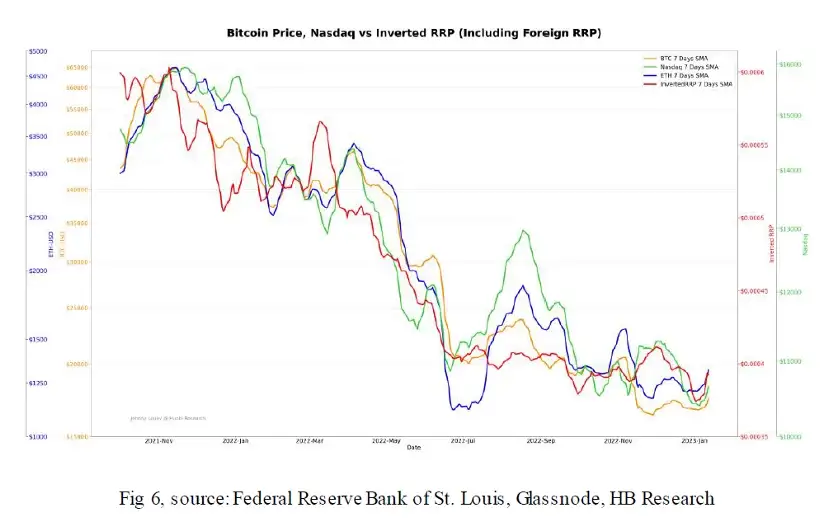
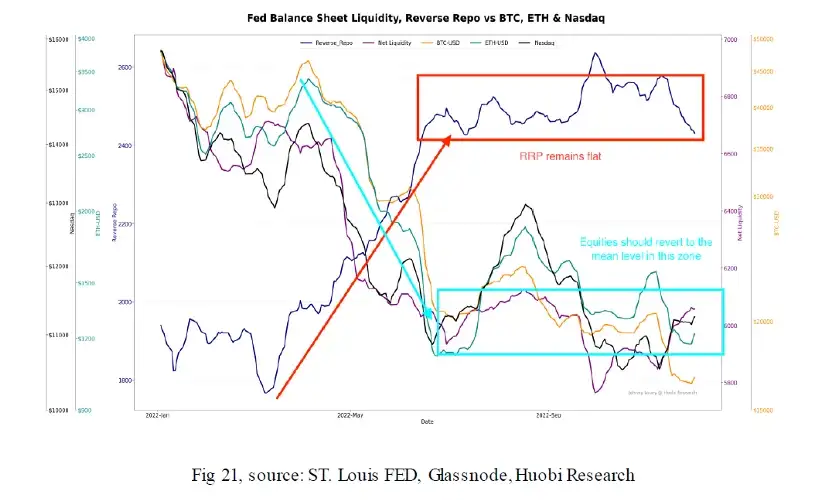
Please be reminded that a flattened RRP means an ease (less hawkish) on the liquidity availability, the market could react in a positive way, causing potential bear market rallies.
Conclusion: A surge in Inverted RRP leads to a greater chance of risky assets rallying. At the moment, Inverted RRP remains structurally flat, and equities should be reverting to the mean level in this period.
2.2 Understanding Treasury General Account
The Treasury General Account is the checking account opened by the Department of the U.S. Treasury in the Federal Reserve Bank, from which the U.S. government makes all of its payments. The Treasury General Account is used for U.S. government disbursements, where tax payments are deposited, and where funds from the sale of Treasury debt is collected.
The TGA sits on the Fed’s balance sheet as a liability, along with notes, coins and bank reserves. But the Fed’s liabilities must match its assets. So a drop in the TGA must see a rise in bank reserves and vice versa. Last year’s reserves drain (2021) was masked by the Fed’s $3 trillion in asset purchases. But when cash flows leave the TGA, bank reserves rise — potentially increasing lending or investment in the wider economy or markets.
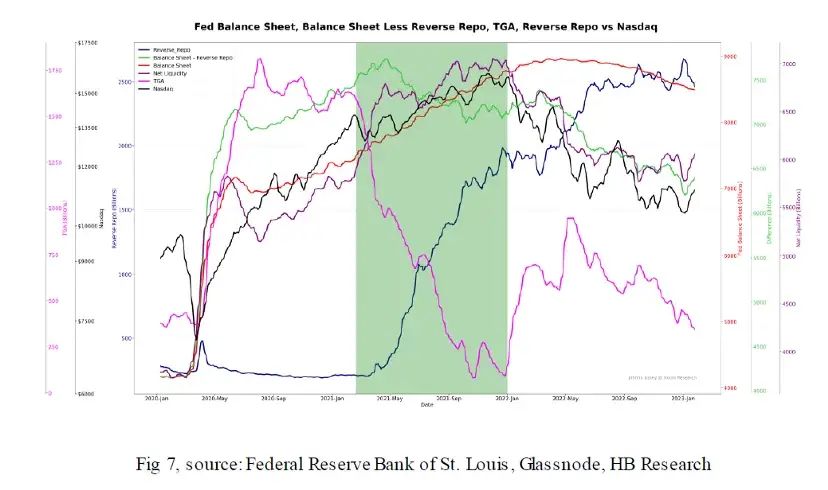
According to Fig 7, the green shaded area was the period where the Fed spent down the TGA from 1.6 Trillion to almost zero, offsetting the effect by the surging RRP and inflating the Net Liquidity, thus, causing Nasdaq to rally.
2.3 Interpreting the Fed Balance Sheet, TGA and RRP together with bills and coupons issuance to forecast liquidity availability
This Net Liquidity Model was effectively functioned in 2020–2022 until recently the Fed hit its debt ceiling.
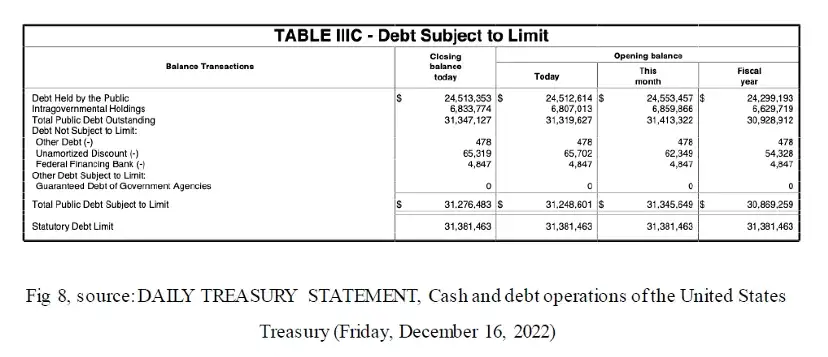
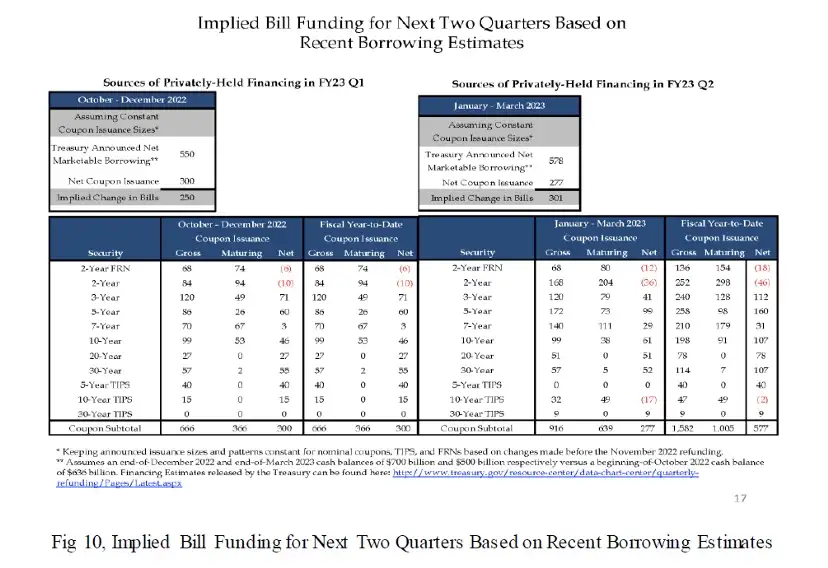
Having its total debt hitting the $31,381 billion debt ceiling indicates that the Treasury cannot issue more bills and coupons unless the balance of TGA is exhausted; when all the funds in TGA are budgeted and incurring as cost to fund government spending, official proposals must be submitted in the congress to raise its debt ceiling. Less bills will be issued when TGA is specifically spent on government expenditures as less bills will be needed. However, coupons, longer duration bonds are not affected. The demand for T- Bills (a probable cause could be the desire to meet ROI requirement of end investors)has to be settled somewhere else. It is unlikely the demand will go to crypto and risky assets under this bearish economic environment, which leaves the only haven being RRP. Therefore, in the coming months, RRP (including Foreign RRPs) will play more significant role rather than the TGA account in the Fed Liquidity Model.
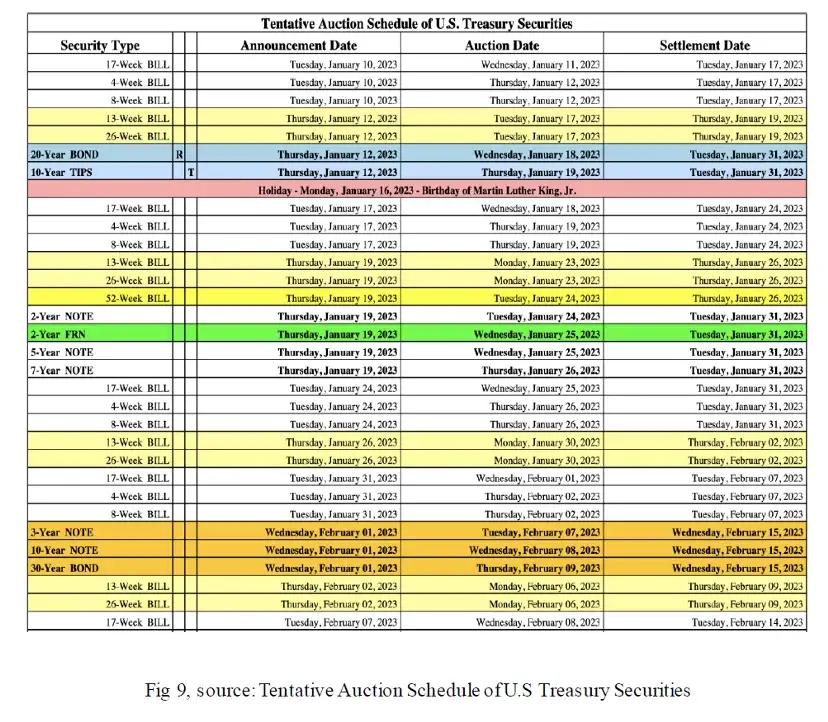
Therefore, it is also crucial to monitor 2023 Q1 bills and coupon issuance[2]. If the Treasury issues less bills, the demand for these bills will be shifted to RRP. If the Treasury issues more bills, RRP will drop and risky assets might have a chance to rally. (Also important to monitor RRP levels).
[2] Data can be found at: https://home.treasury.gov/system/files/221/Tentative-Auction-Schedule.pdf
2.4 Liquidity Model Reference
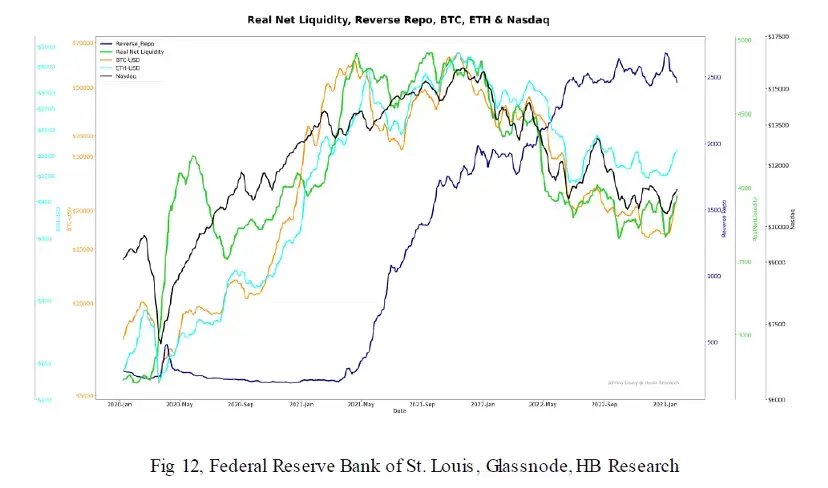
The Real Net Liquidity takes into account the TGA, RRP as well as new debts issued by the Treasury to track the trends of risky assets.
2.5 Fed Funds Rate Projection
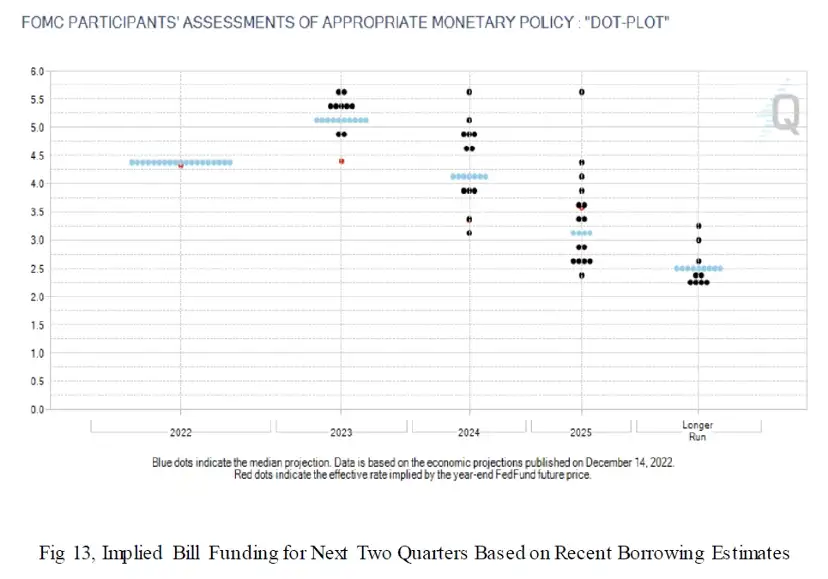
This is a projection of the upcoming FOMC rate hikes probabilities. The general trend is inclined to predict rate cuts in 2024, which indicates that interest rate will maintain at the terminal rate of 5.25% throughout 2023.
In my opinion, under high interest rate regime, investment sentiment will be dire; risky assets are unlikely to rally as money now prefers less risky investments. Under such macro condition, it is almost impossible to witness another boom of that in 2020.
Nonetheless, it is not necessarily implying the doomsday of crypto, as the market is always forward-looking, let alone the market has effectively responded to the rate hikes of the Fed as it should have. The following Bitcoin Price Models suggest that the crypto market has come to a historical “Value Zone” where smart money would accumulate. Without further bad news coming out in the near future, crypto is within the bottom range right now.
Chapter 3 — Bitcoin Price Models
3.1 Bitcoin Holders Cost Basis Model
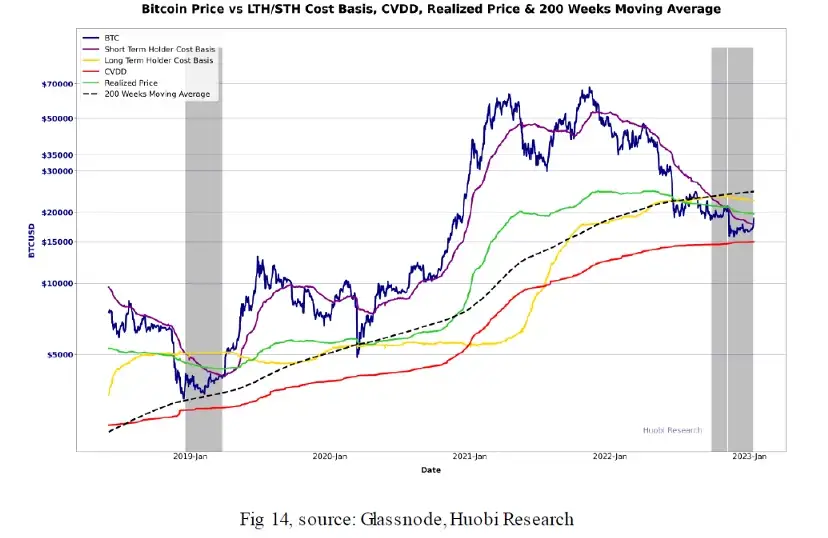
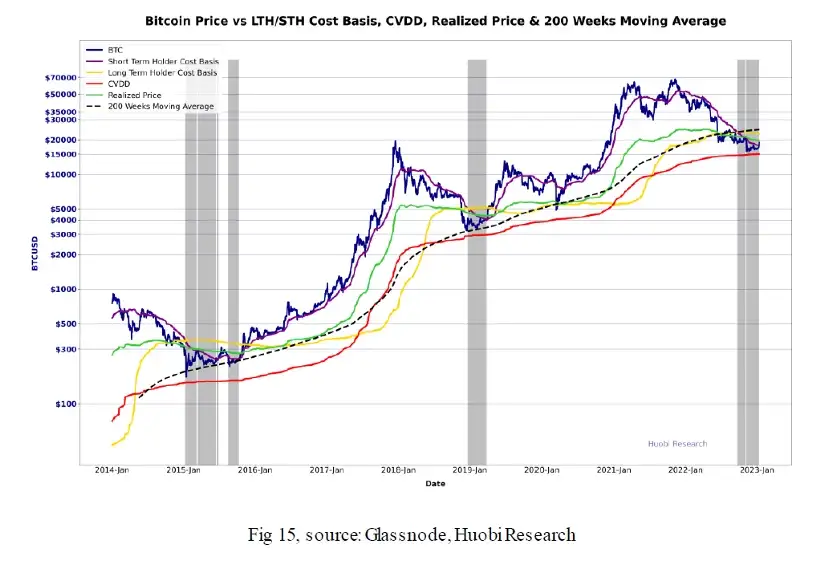
This multi-cost basis model suggests it has entered the capitulation period once in a 4-year cycle. According to CVDD, somewhere between 13.5k-16k could be the final capitulation floor price. The grey shaded area is where Long Term Holder Cost Basis is higher than Short Term Holder Cost Basis. This only occurs once in a 4-year cycle, which depicts a typical capitulation period.
3.2. Realised Profit and Loss
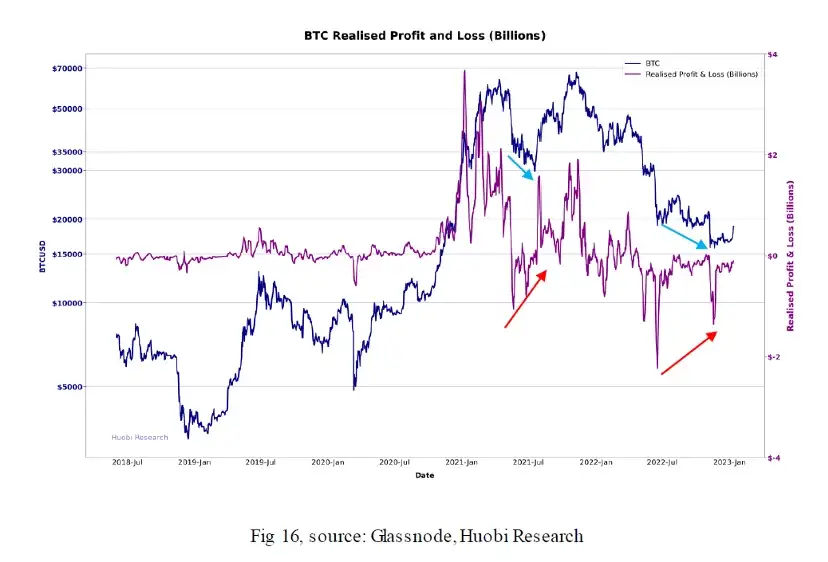
A diminishing realized loss was incurred in recent capitulation; a further capitulation event accompanied with a minimized realised loss implies the absence of sellers, and it is typically spotted in a bull market that very few is willing to sell.
3.3 Stablecoin Supply Ratio Model
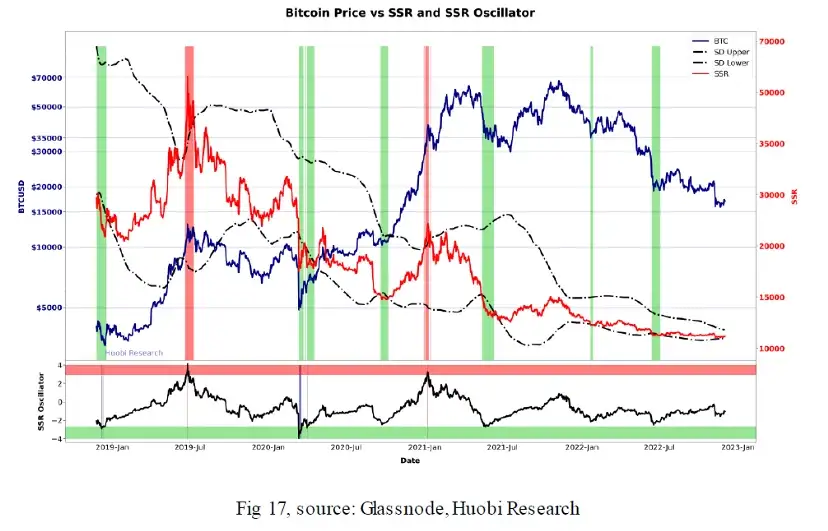
The Stablecoin Supply Ratio (SSR) has been effective for confirming a market bottom when the SSR penetrates the lower boundary of its lower band standard deviation. Currently it is residing near its lower boundary, which could possibly indicate that the purchasing power in stablecoin has nearly reached a threshold for an uptrend to follow.
3.4 Bitcoin vs Yields
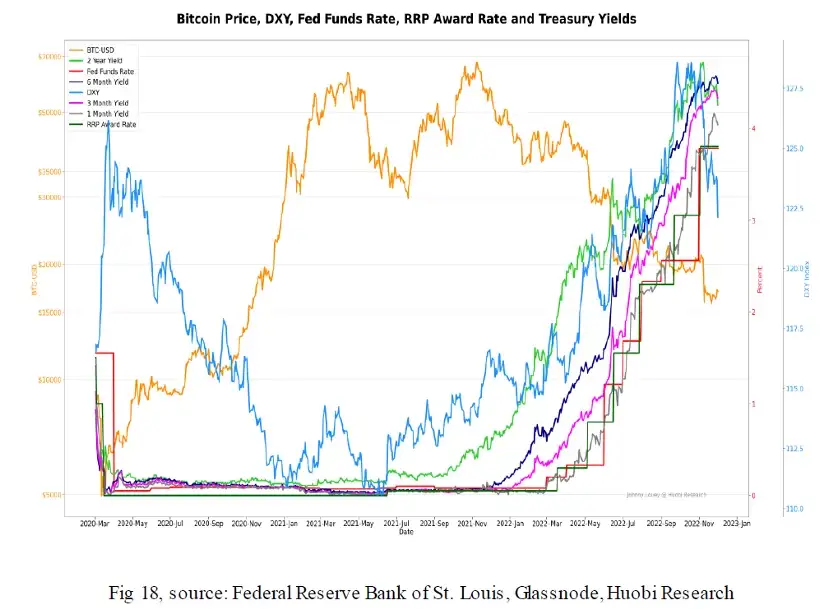
Yields are still in an uptrend. DXY has been showing signs of weakness. Yields have developed an inverse correlation to risky assets, and a bull market can be detected when yields are on a downward slope. Strong yields also discourage DeFi growth and development; not until the yields are lower than current offering of DeFi can the TVL of DeFi to recover.
3.5 Bitcoin Cycles Comparison
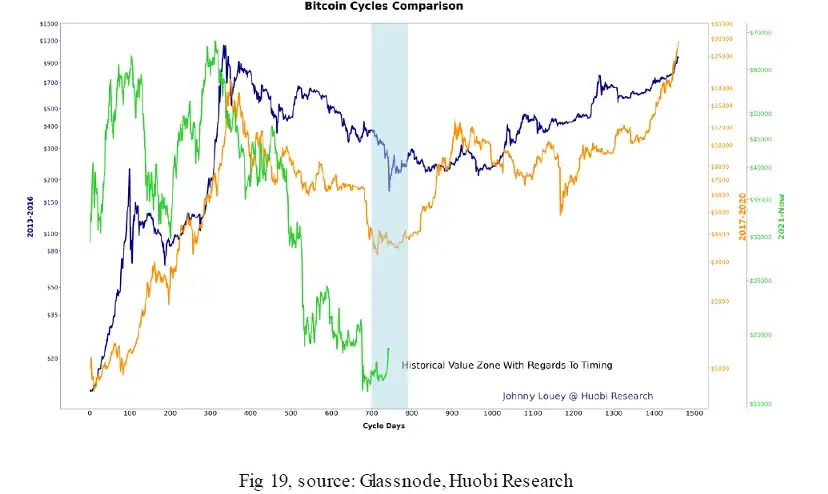
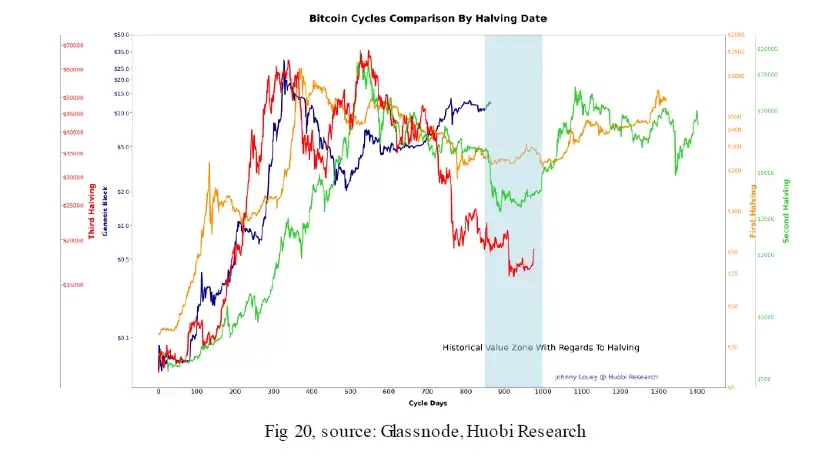
Finally, through the lens of Bitcoin in a 4 Year Cycle, we are now at the historical “Value Zone”. This zone begins on the 700th day of previous cycles which usually lasts for 2–3 weeks. In this zone, capitulation event strikes and it comes with FUD. The Crypto Fear and Greed Index now is 27 (out of 100). If Bitcoin cycles are to be scanned since its every Halving, the zone typically begins since the 850th Day and lasts for 3 months.
Chapter 4 — Conclusion
4.1 Bitcoin has entered the historical value zone after cascades of capitulations.
All of the Bitcoin Metrics mentioned above are hinting that the price of Bitcoin is currently undervalued. It is possible that we see Bitcoin price reverts to its fair value before the FTX implosion. However, further rally to reclaim $30,000 or above has to be justified by a positive macro liquidity condition plus improved investment sentiment towards risky assets.
4.2 While RRP remains flat, risky assets should be seeing less downward pressure.
It is crucial to monitor the Real Net Liquidity Indicator and the Inverted RRP for a trend continuation confirmation. In the other words, these two indicators needs to show signs of strength continually for Crypto markets to continue the rallies.
About Huobi Research Institute
Huobi Blockchain Application Research Institute (referred to as “Huobi Research Institute”) was established in April 2016. Since March 2018, it has been committed to comprehensively expanding the research and exploration of various fields of blockchain. As the research object, the research goal is to accelerate the research and development of blockchain technology, promote the application of the blockchain industry, and promote the ecological optimization of the blockchain industry. The main research content includes industry trends, technology paths, application innovations in the blockchain field, Model exploration, etc. Based on the principles of public welfare, rigor and innovation, Huobi Research Institute will carry out extensive and in-depth cooperation with governments, enterprises, universities and other institutions through various forms to build a research platform covering the complete industrial chain of the blockchain. Industry professionals provide a solid theoretical basis and trend judgments to promote the healthy and sustainable development of the entire blockchain industry.
Contact us:
Website:http://research.huobi.com
Email:research@huobi.com
Twitter:https://twitter.com/Huobi_Research
Telegram:https://t.me/HuobiResearchOfficial
Medium:https://medium.com/huobi-research
Disclaimer
1. The author of this report and his organization do not have any relationship that affects the objectivity, independence, and fairness of the report with other third parties involved in this report.
2. The information and data cited in this report are from compliance channels. The Sources of the information and data are considered reliable by the author, and necessary verifications have been made for their authenticity, accuracy and completeness, but the author makes no guarantee for their authenticity, accuracy or completeness.
3. The content of the report is for reference only, and the facts and opinions in the report do not constitute business, investment and other related recommendations. The author does not assume any responsibility for the losses caused by the use of the contents of this report, unless clearly stipulated by laws and regulations. Readers should not only make business and investment decisions based on this report, nor should they lose their ability to make independent judgments based on this report.
4. The information, opinions and inferences contained in this report only reflect the judgments of the researchers on the date of finalizing this report. In the future, based on industry changes and data and information updates, there is the possibility of updates of opinions and judgments.
5. The copyright of this report is only owned by Huobi Blockchain Research Institute. If you need to quote the content of this report, please indicate the Source. If you need a large amount of references, please inform in advance (see “About Huobi Blockchain Research Institute” for contact information) and use it within the allowed scope. Under no circumstances shall this report be quoted, deleted or modified contrary to the original intent.