This week, Bitcoin continued its rebound above the low of $57,820, with the price approaching the critical resistance zone of $65,700~$67,300. The battle between bulls and bears has entered a white-hot stage—if the rebound is rejected and falls back within this zone, a daily-level correction may resume; if it breaks through effectively, the short-term structure will shift to a stronger bullish logic. HYPE extended its correction from the high of $72.97, with this week's focus on the battle outcome in the $62~$63.5 zone. The medium-term view remains bearish-dominated, while short-term operations should strictly follow model signals, dynamically switching between Plan A and B.
Summary of This Week's Core Trading Views:
- BTC Multi-Timeframe Structure Analysis (Detailed in Part 1)
- BTC Weekly Market Forecast & Medium/Short-term Trading Strategies (Detailed in Part 2)
- HYPE Hourly Chart Structure Analysis (Detailed in Part 3)
- HYPE Weekly Market Forecast & Short-term Trading Strategies (Detailed in Part 4)
Market Verification of Last Week's Trading Strategies & Core Views:
- BTC Market Forecast Verification: Last week's article clearly stated that Bitcoin's daily chart entered a short-term consolidation pattern. The subsequent market movement confirmed our prediction.
- BTC Short-term Trading Performance: One short-term long trade (1x leverage) on Bitcoin was completed last week, achieving a profit of approximately 3.45%. (Detailed in Part 5)
- HYPE Market Forecast Verification: Last week's article clearly stated: If prices rebound early in the week but fail to break the previous high of $72.97, it would signal a reversal of the prior uptrend, indicating a daily-level correction starting from the high of $72.97. The current market movement is highly consistent with our judgment.
一、Bitcoin Multi-Timeframe Structure Analysis
1、Bitcoin Daily Chart Structure Analysis: (Based on post-May 6th price action)
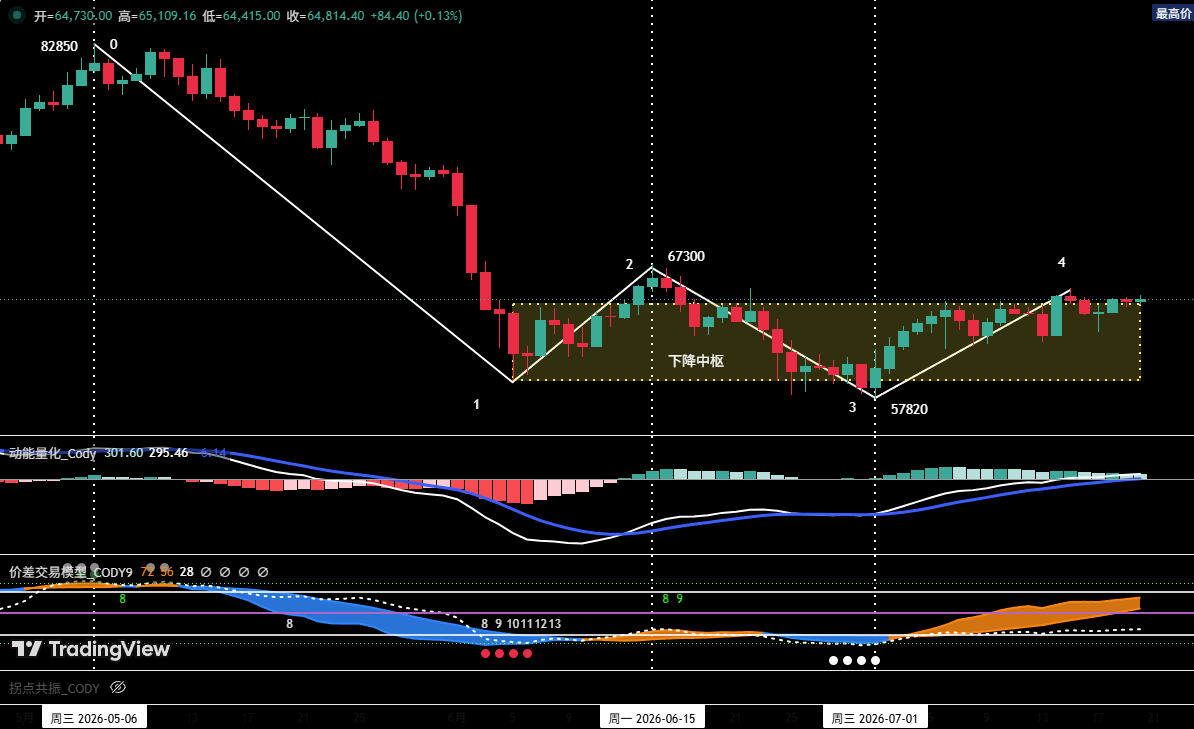
1 As shown in (Figure 1): The corrective move starting from the May 6th high of $82,850 has formed a four-segment corrective structure on the daily chart: (0-1), (1-2), (2-3), (3-4).
2 After touching the low of $57,820 on July 1st, the market is currently in the (3-4) rebound segment. The rebound high has reached $65,600, with the price approaching the key resistance around $65,700. Currently, this rebound segment may not be over, and the recent high of $65,600 is likely not the terminal point "Endpoint 4".
3 If the (3-4) rebound segment shows clear signs of exhaustion and adjustment upon encountering resistance in the $65,700~$67,300 zone, then the first daily-level segment (i.e., wave a) of the rebound starting from the July 1st low of $57,820 may have concluded.
2、In-Depth Analysis of Bitcoin Hourly Chart Structure: (Using 4-hour as analysis cycle)
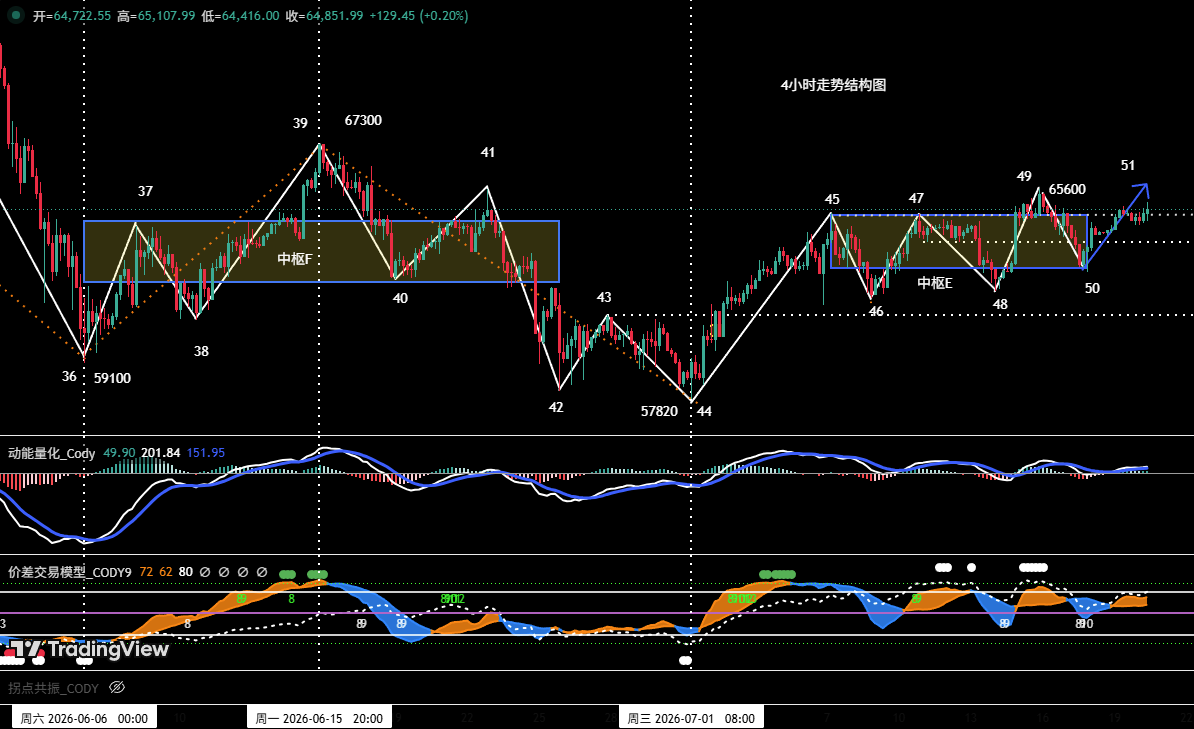
1 In the 4-hour chart, the rebound from the July 1st low of $57,820 has clearly presented a seven-segment structure from (44-45) to (50-51). Among them: segments (45-46), (46-47), (47-48), (48-49), (49-50) overlap, forming a "five-segment" consolidation zone E.
2 Based on the current structure analysis, the price is currently in the (50-51) rebound segment.
- If the price effectively breaks above the $65,700 resistance and the rebound continues, the probability of this segment upgrading into the breakout leg from the consolidation zone increases significantly. At that point, its momentum should be compared with the entry leg (44-45). If a momentum divergence forms between them when "Endpoint 51" terminates, the rebound starting from "Endpoint 44" (~$57,820) may end, with a high probability of a subsequent correction.
- If the rebound fails to effectively break above the $65,700 resistance, the price is likely to remain in range-bound consolidation in the short term.
二、Bitcoin Weekly Market Forecast & Trading Strategies
1、BTC Weekly Market Forecast:
Core View for the Week: Focus on the test results when the price rebounds to the key resistance zone of $65,700~$67,300.
2、Core Resistance Levels:
- First Resistance Zone: $65,700~$67,300 area (Previous significant resistance)
- Second Resistance Zone: $69,500~$71,000 area (Previous significant resistance)
3、Core Support Levels:
- First Support Level: Around $64,700 (Previous important support)
- Second Support Zone: $60,950~$62,000 area (Previous important support)
- Third Support Level: Around $57,820 (Previous important support)
4、Weekly Trading Strategies (Excluding sudden news impacts)
1 Medium-term Strategy:
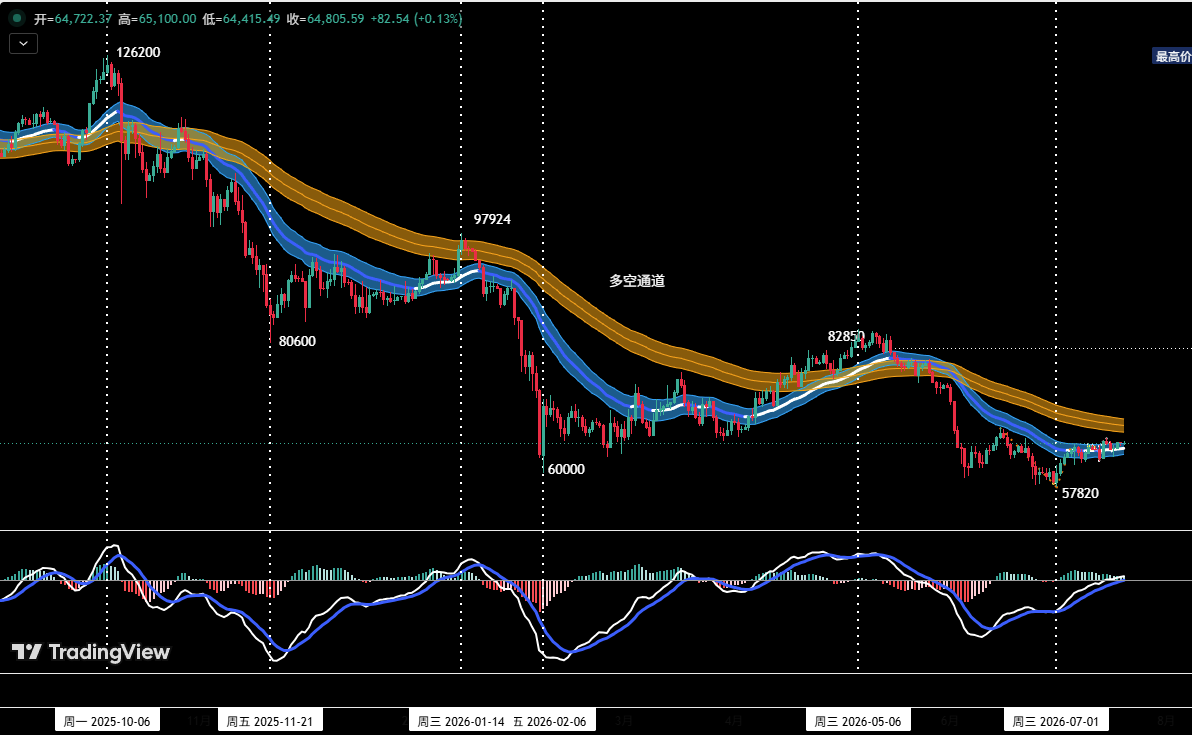
Position Monitoring Model: As shown in (Figure 3), the current price has effectively broken below the "Bull-Bear Channel," confirming a shift to a bearish-dominated market structure.
- Current medium-term bearish positions are maintained at around 20%.
- If the price shows signs of exhaustion upon rebounding to the $65,700~$67,300 zone, combined with top signals from the proprietary quantitative model, consider increasing medium-term bearish positions to within 50%.
2 Short-term Strategy:
Utilize 30% of capital, set stop-losses, and look for "spread" trading opportunities based on support and resistance levels. (Using 30-minute/60-minute as the operation cycle)
3 In short-term operations, to dynamically respond to complex market changes, we have prepared two specific contingency plans: A and B.
Plan A: Tentative Short at Strong Resistance Zone
- Entry: If the price encounters resistance upon rebounding to the $65,700~$67,300 zone, combined with top signals from the quantitative model, consider establishing a short position of around 30%.
- Risk Control: Set an initial stop-loss.
- Exit: Gradually close the position to realize profits when the price adjusts near important support levels, combined with model signals.
Plan B: Light Long Test at Strong Support Zone
- Entry: After the price is rejected from the $65,700~$67,300 zone and falls back, if signs of stabilization appear above the previous low of $57,820, combined with bottom signals from the quantitative model, consider establishing a long position of around 30%.
- Risk Control: Set an initial stop-loss.
- Exit: Gradually close the position to realize profits when the price rebounds near important resistance levels, combined with model signals.
三、HYPE Hourly Chart Structure Analysis
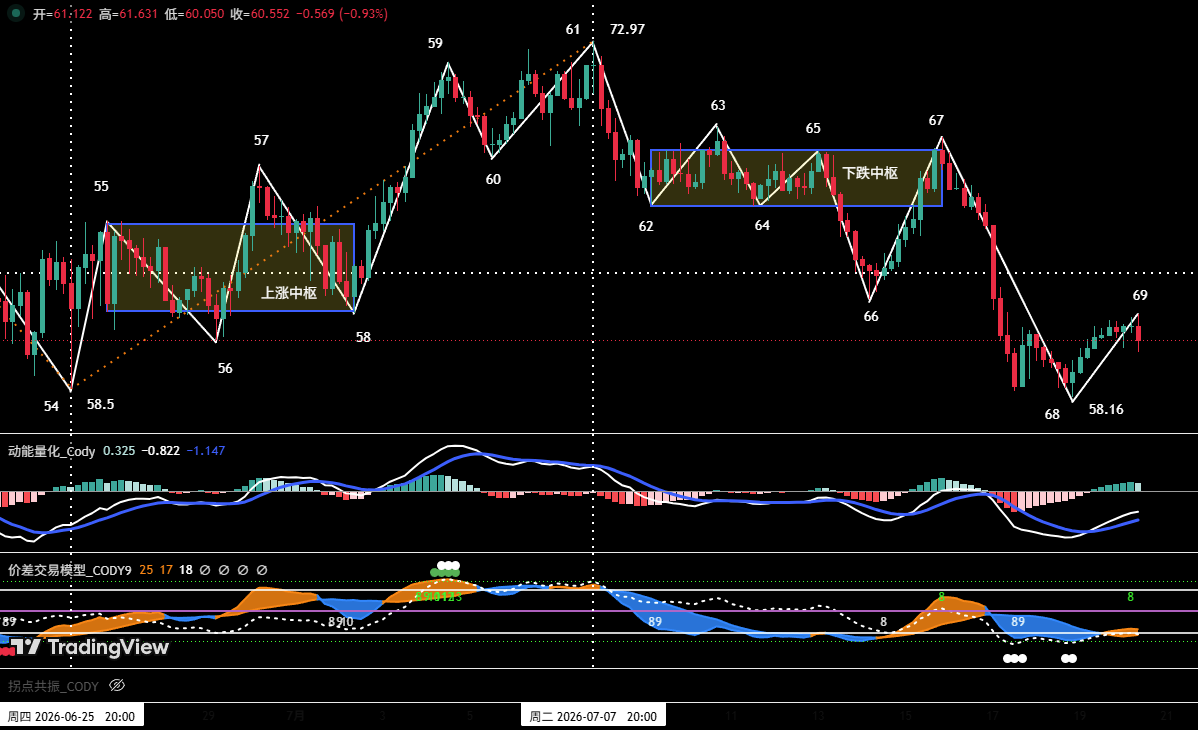
1. As shown in (Figure 4), the correction in HYPE starting from the July 7th high of $72.97 (Endpoint 61) can be subdivided into an eight-segment corrective structure on the 4-hour chart. Segments 62-63, 63-64, 64-65, 65-66, 66-67 overlap, forming a "five-segment" bearish consolidation zone.
2. Last week's review pointed out: When the market subsequently ran the (62-63) rebound segment, if "Endpoint 63" failed to break the previous high "Endpoint 61" ($72.97), it would mean the end of the daily uptrend from "Endpoint 54 to Endpoint 61," and the market would start a daily-level correction from "Endpoint 61." The market corrected as expected last week, falling from "Endpoint 63 to Endpoint 68," with a maximum decline of approximately 16.17%.
3. Based on the 4-hour chart analysis:
Comparing the momentum of the breakout leg (67-68) with the entry leg (61-62), the downward momentum of the breakout leg is significantly stronger than the former. This suggests a lower probability that "Endpoint 68" ($58.16) is the low of this correction. The market is currently in the (68-69) rebound segment, after which prices may potentially test new lows.
四、HYPE Weekly Market Forecast & Short-term Trading Strategy: (07.20~07.26)
1、HYPE Weekly Market Forecast:
1 Core Resistance Levels:
- First Resistance: $62~$63.5 area
- Second Resistance: $68~$69.5 area
- Third Resistance: Around $72.97
2 Core Support Levels:
- First Support: Around $58.16
- Second Support Zone: $52~$55 area
Core HYPE View for the Week: Monitor the test results when the price rebounds to the $62~$63.5 zone.
2、HYPE Weekly Short-term Trading Strategy:
If the price shows clear adjustment signals upon rebounding to near $62~$63.5 or higher resistance areas, investors may consider entering light short positions. Strict stop-loss discipline is required, with position size controlled within 30%.
五、Bitcoin Short-term Trade Review
We strictly followed the operation plan and the trading signals issued by our proprietary "Spread Trading Model" and "Momentum Quantitative Model," completing one short-term (long) trade last week, achieving a total trading profit of approximately 3.45%.
1、Short-term Trade Record: (See Table 1)
Bitcoin Short-term Trade Details Summary: (Leverage ×1)
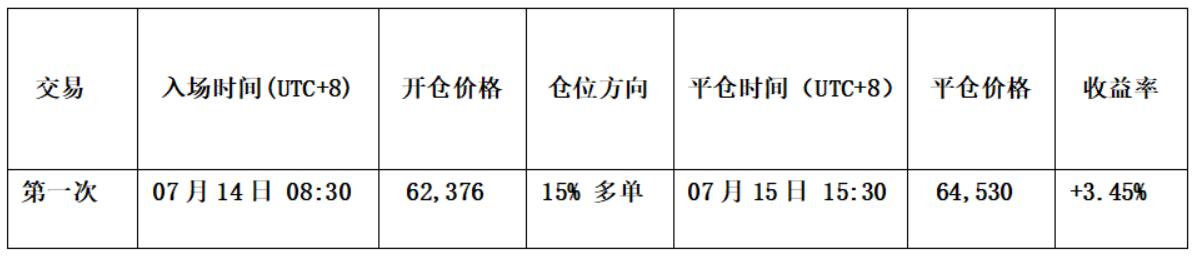
Table 1
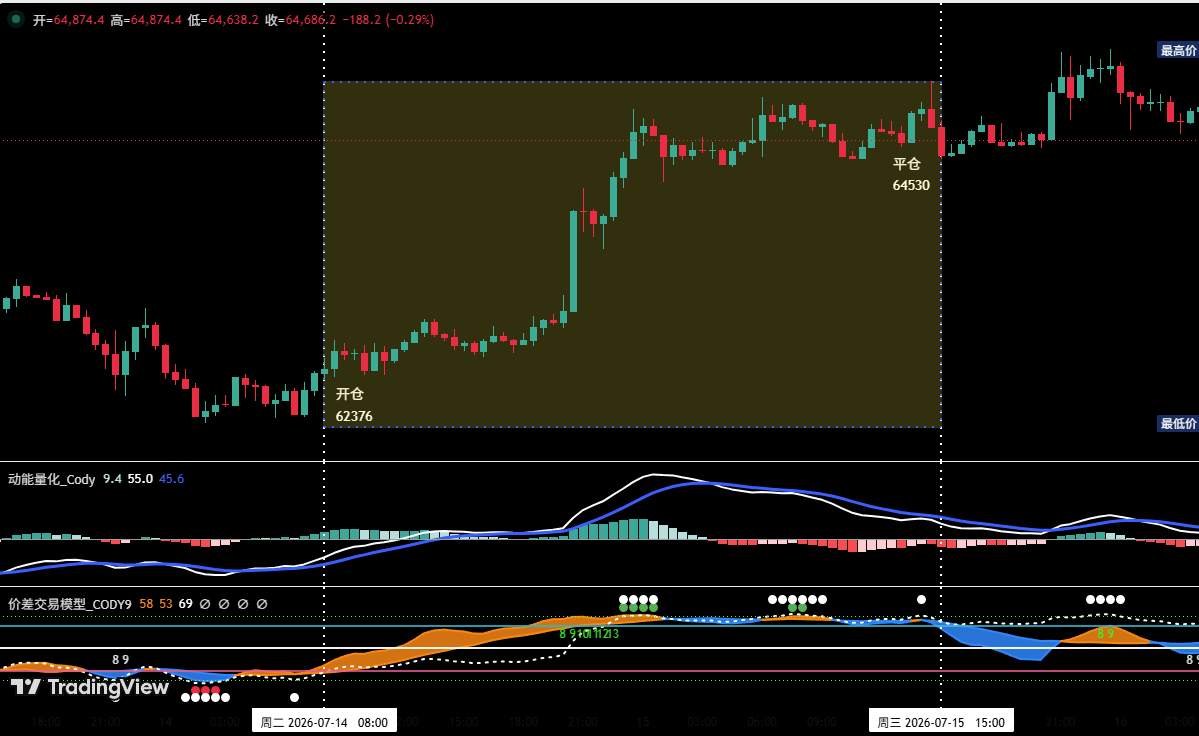
2、Short-term Trade Review: (See Figure 5)
Entry Strategy:
a. When the price adjusted above $61,000, signs of stabilization appeared, and the candlesticks formed a "bottom reversal" pattern.
b. The "Momentum Quantitative Model" formed a bullish divergence signal.
c. After the "Spread Trading Model" triggered a strong bottom warning signal (white dot + red dot), the signal band (orange-yellow) in the chart broke above the horizon line (purple-red), issuing a bottoming rebound signal.
Therefore, we established a 15% long position at $62,376.
Exit Strategy:
a. When the price showed signs of exhaustion upon rebounding near $65,700, forming a "top reversal" candlestick pattern.
b. After the "Spread Trading Model" continuously triggered top warning signals (white dot + green dot), the signal band (blue) in the chart broke below the skyline (green), forming a top resonance signal with the "Momentum Quantitative Model."
Therefore, we closed the entire position around $64,530.
Summary: This trade successfully yielded a profit of approximately 3.45%.
3、Short-term Trade Schematic
六、Special Instructions:
- Upon Entry: Immediately set an initial stop-loss.
- When Profit Reaches 1%: Move the stop-loss to the entry price (breakeven point) to ensure capital safety.
- When Profit Reaches 2%: Move the stop-loss to the 1% profit level.
- Continuous Tracking: Thereafter, for every additional 1% profit, move the stop-loss up by 1% accordingly, dynamically protecting and locking in profits.
Financial markets are ever-changing. All market analysis and trading strategies require dynamic adjustment. All views, analytical models, and operational strategies mentioned in this article are derived from personal technical analysis and are solely for personal trading log purposes. They do not constitute any investment advice or basis for operation. The market carries risks; invest with caution. Do not make decisions based solely on this content.