BTC7338
08/13 14:09
Zooming a lot further out, the 2-week chart contin
Zooming a lot further out, the 2-week chart continues to look bullish for the $BTC price. In the price action it can be observed that should this two-week period close more or less as is, the current candle will envelop the previous one. If one looks back to the previous bull flag, a similar enveloping candle was what took the price up to the next bull flag.
At the bottom of the chart, the Relative Strength Index reveals that the indicator line is right up against the descending trendline. A breakthrough here would likely result in a strong surge to the upside. Watch this closely.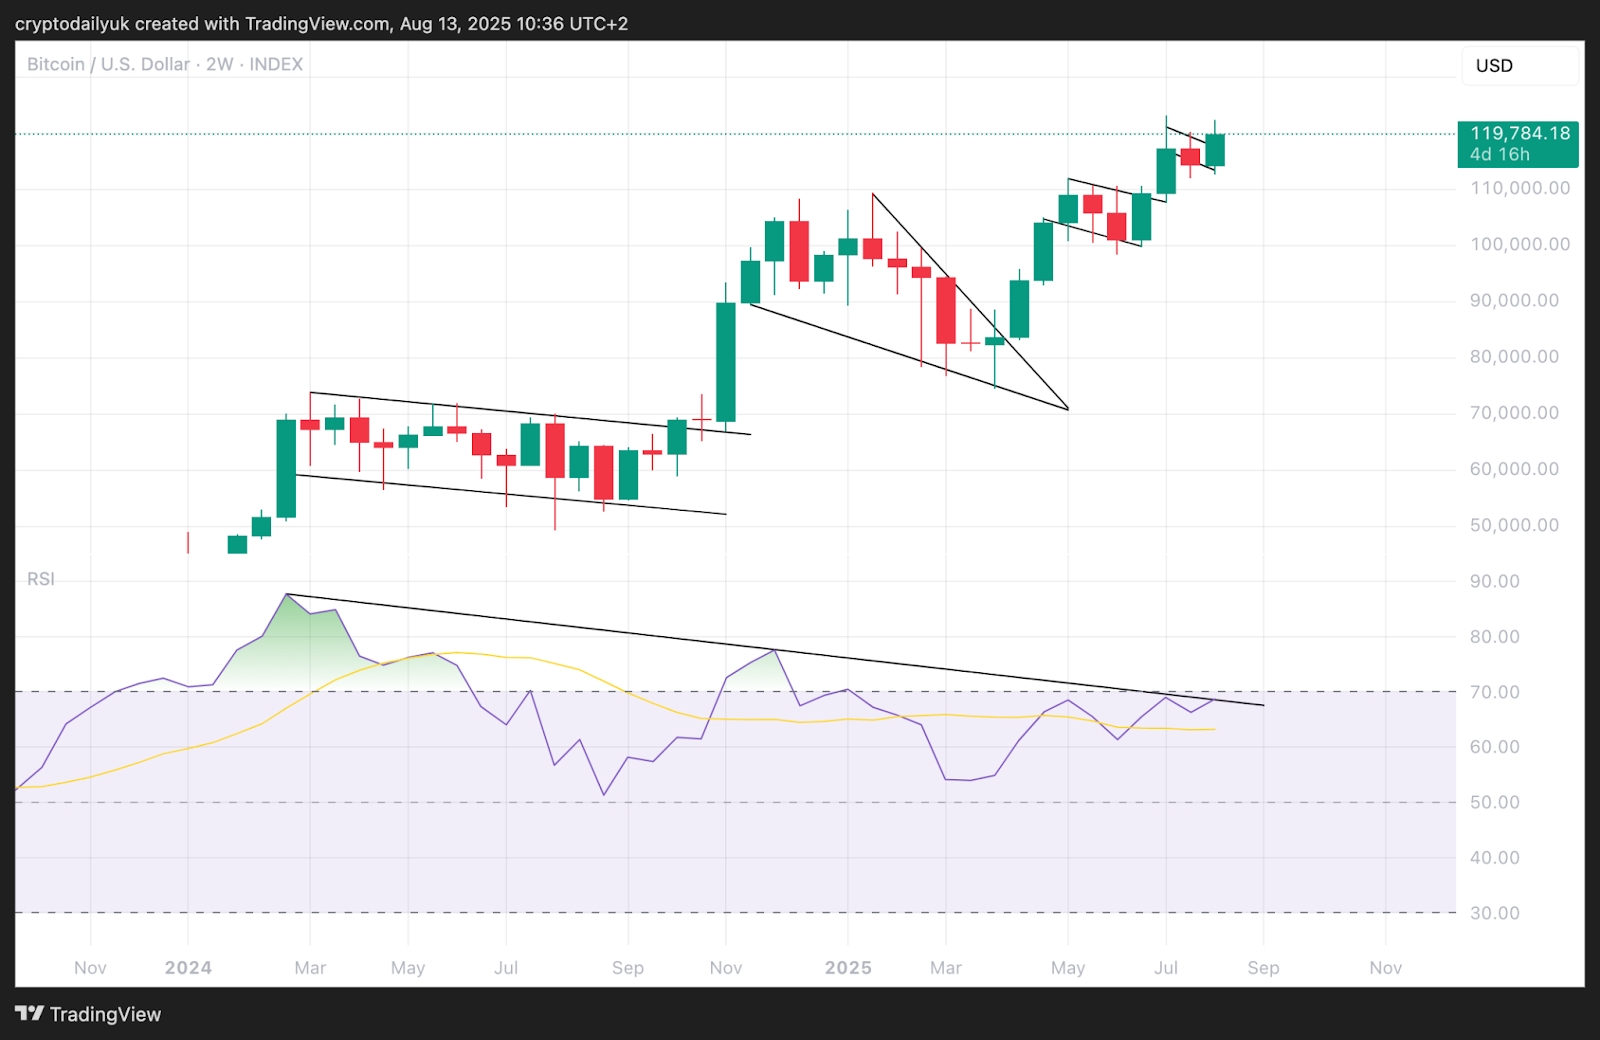
#Claim1,200 USDT in the Monthly Creation Challenge
9Share
All Comments0LatestHot