Crypto Express
07/11 03:32
Vechain’s technical analysis and key levels
The technical analysis revealed that VET, with its recent rally, has broken out of a prolonged consolidation phase and a resistance level formed by a descending trendline.
Moreover, the asset has successfully closed a daily candle above this breakout level, suggesting that VET is now on the verge of an upside rally.
Meanwhile, VET’s weekly chart also reflects a strong bullish outlook.
According to the chart, VET appeared to be forming a bullish double-bottom price action pattern at the time of writing.
Additionally, it showed a bullish divergence, suggesting a potential upside rally in the coming days.
Another catalyst for VET’s potential upside is the support level at $0.019, coupled with a bullish candlestick pattern.
Since November 2023, VET has hit this support level six times, each leading to a strong rally, which investors expect to repeat.
Technical indicators across both daily and weekly charts show that VET may have broken free from its prolonged bearish trend and is now positioned for a sharp move upward.
If bullish momentum holds and VET stays above $0.022, the token could climb as much as 40%, potentially reaching $0.032.
However, falling below the $0.022 level could trigger either a pullback or sideways movement.
Despite recent gains, VET was trading under its 200-day Exponential Moving Average (EMA), as of writing, indicating that it hasn’t fully exited the broader downtrend.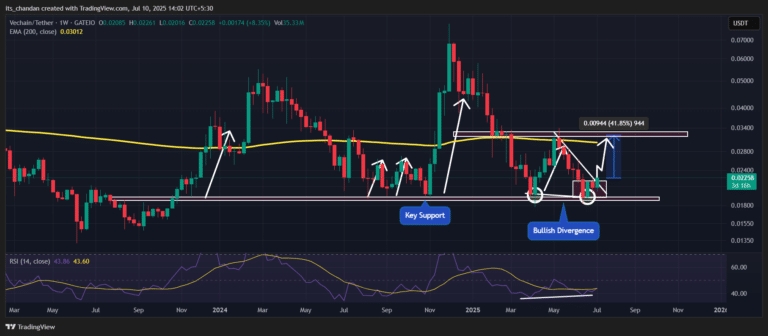
#HTX 12th-Anniversary Carnival#Share Your Thoughts on Popular Assets in June#Claim1,200 USDT in the Monthly Creation Challenge#Do you think BULLA is promising?#Do you think LISTA is promising?
79Bagikan
Semua Komentar0TerkiniHangat