Stellar’s $0.142 test – Why it may be the buying chance traders await

ambcryptoPublicado a 2026-06-26Actualizado a 2026-06-26

Resumen

Stellar's XLM extended its decline, dropping 7.85% to $0.1514 despite a 10.55% increase in trading volume. This suggests active selling rather than support for a recovery. Key technical indicators point to persistent bearish control. XLM broke a key horizontal support and remains below a descending trendline, with the MACD in a bearish crossover and Parabolic SAR dots above the price. The RSI is at 34.42, nearing oversold territory, and the DMI shows bearish momentum is intact. The analysis indicates XLM is likely to drift toward the next major demand zone at $0.142 before any potential recovery attempt can gain traction.

Stellar [XLM] extended its decline after sellers retained firm control despite a pickup in market activity.

The token traded at around $0.1514 at press time, reflecting a 7.85% daily loss, while trading volume climbed 10.55% to $236.47 million. The combination suggests market participants actively traded into the decline instead of supporting a recovery.

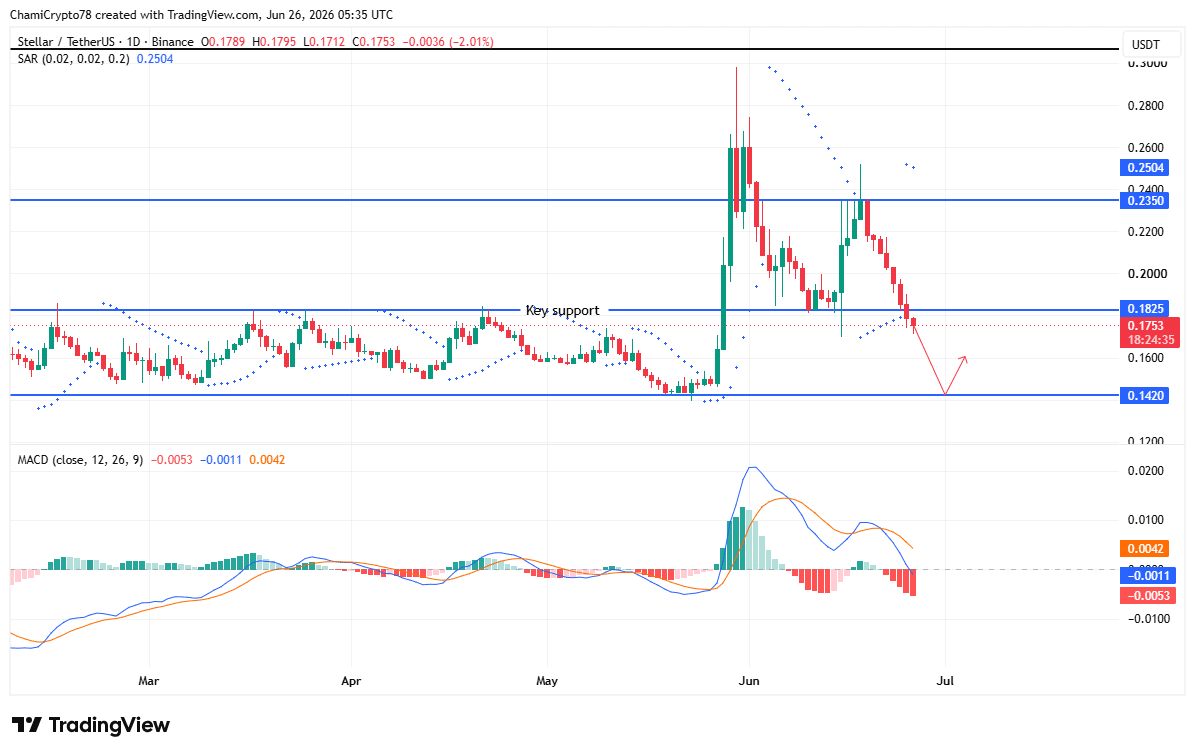
XLM drifted toward its next demand zone

XLM broke below a key horizontal support after failing to preserve its previous trading structure, leaving the $0.142 demand zone as the next major downside objective.

Price remained below the descending trendline, reflecting continued bearish control across the chart.

The MACD maintained a bearish crossover as the histogram stayed below the zero line, showing downside pressure had not eased despite recent consolidation attempts.

In addition, the Parabolic SAR dots continued forming above the candles, reinforcing the existing downtrend instead of signaling a reversal.

Buyers repeatedly attempted to reclaim lost ground, yet every recovery stalled beneath former support, strengthening the bearish structure.

If sellers maintained control, XLM could continue drifting toward $0.142 before any meaningful recovery attempt emerged.

Source: TradingView

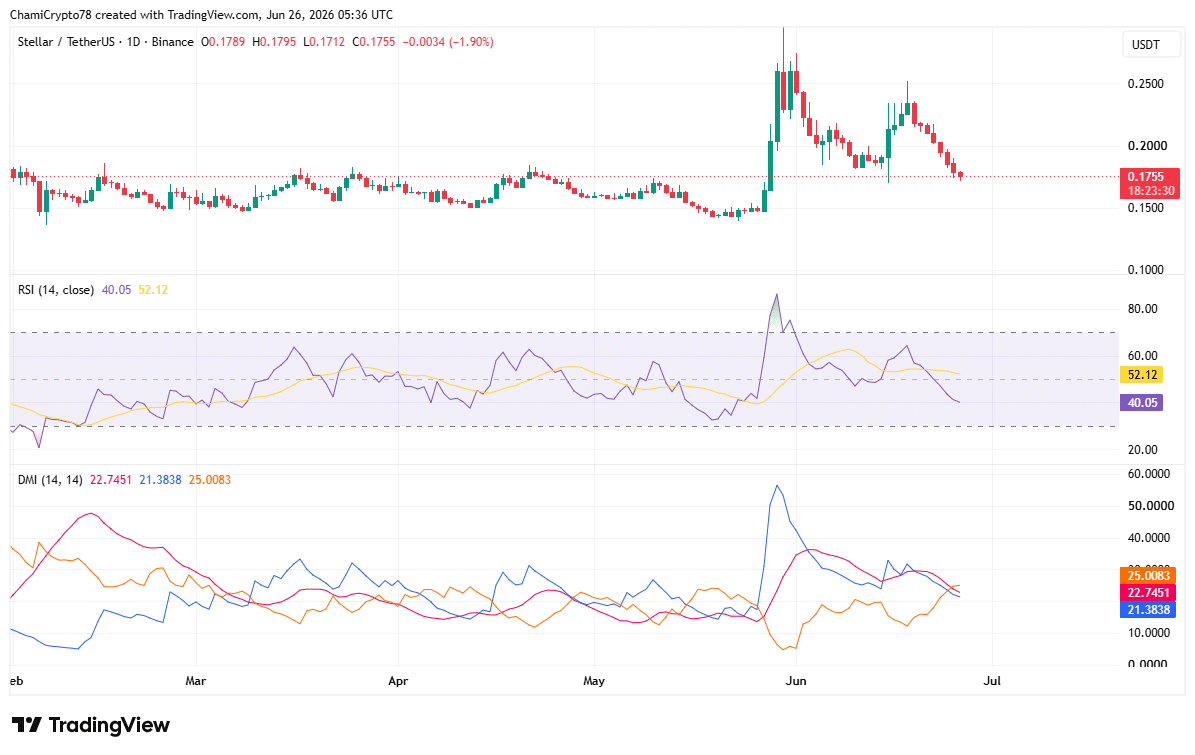
Buyers weakened as bears retained control

Momentum indicators continued favoring sellers as XLM approached another important technical test.

The Relative Strength Index (RSI) fell to 34.42, placing it close to oversold territory after extended selling pressure reduced buying participation.

Although the reading suggested the decline had become increasingly stretched, it had not yet confirmed a reversal signal.

Meanwhile, the Directional Movement Index (DMI) showed -DI at 25 remained well above +DI at 21.38, while the ADX climbed to 22.75.

This combination indicates the prevailing bearish trend retained enough strength to remain intact.

Buyers would likely need to reclaim control of directional movement before sentiment improves. Otherwise, weakening participation could continue supporting another leg lower toward the next demand area.

Source: TradingView

Is XLM headed for the $0.142 demand zone?

Current market conditions favored another decline toward the $0.142 demand zone before buyers could attempt a sustained recovery.

Selling pressure dominated both Spot order flow and price structure, while trend indicators continued supporting the bearish outlook.

However, if buyers successfully defend the demand zone and momentum indicators stabilize, XLM could begin building a recovery from that area. Until those signals emerge, the downside scenario remains the more probable outcome.


Final Summary

  • Rising trading activity failed to slow XLM’s decline as sellers continued controlling the market.
  • XLM could test the $0.142 demand zone before buyers attempt a meaningful recovery.

Criptos en tendencia

Preguntas relacionadas

QWhat is the current trading price of Stellar (XLM) and its daily percentage change as mentioned in the article?

AThe token traded at around $0.1514 at press time, reflecting a 7.85% daily loss.

QWhat is the next major downside price target for XLM according to the technical analysis?

AThe $0.142 demand zone is identified as the next major downside objective for XLM.

QWhat do key momentum indicators like the MACD and Parabolic SAR suggest about the market trend for XLM?

AThe MACD maintained a bearish crossover and the histogram stayed below the zero line. The Parabolic SAR dots continued forming above the candles, both reinforcing the existing downtrend and indicating continued bearish control.

QWhat does the Relative Strength Index (RSI) reading imply about XLM's current market condition?

AThe RSI fell to 34.42, placing it close to oversold territory, which suggests the decline has become increasingly stretched but has not yet confirmed a reversal signal.

QAccording to the article's conclusion, what is the more probable short-term outcome for XLM's price?

AThe downside scenario, with XLM declining towards the $0.142 demand zone, remains the more probable outcome until buyers show successful defense of that zone and momentum indicators stabilize.

Lecturas Relacionadas

Margin Exhausted, "Brother Huang Li Cheng" Begins Selling Monkeys at a Loss

Taiwanese crypto whale "Machi Big Brother" Jeffrey Huang has been forced to sell his prized Bored Ape Yacht Club (BAYC) NFTs at significant losses to cover mounting losses from a highly leveraged ETH long position on Hyperliquid. Over the past month, Huang sold 34 BAYC NFTs for 326 ETH (approx. $514,000), realizing a loss of 399 ETH (approx. $631,000). The proceeds were transferred to Hyperliquid to replenish margin for his perpetual contract trades. One ape, BAYC #6057, bought for 76.84 ETH four years ago, was sold for just 7.65 ETH, a 90% loss in ETH terms. Huang began his high-leverage (25-40x) ETH long strategy in September 2025 when ETH was around $4,700. While his account once showed over $45 million in unrealized profit, the subsequent crash of ETH to the $1,600 range erased all gains. As of June 26, his cumulative losses on Hyperliquid reached $33.85 million, with over 335 liquidations earning him the community nickname "King of Liquidations." With conventional funds depleted, Huang's once-valuable NFT collection, which at its peak included around 200 BAYCs and was worth tens of millions, has become a lifeline. His remaining ~150 BAYCs, valued at roughly $1.6 million at current floor prices, provide only limited runway for his persistent high-stakes trading. Huang rose to prominence in crypto as a key figure in popularizing BAYC NFTs in Asia during the 2021 bull market. His pivot to perpetual contracts has now led to a cycle where his iconic "monkeys" are being sold to fund a failing trading strategy.

Foresight NewsHace 36 min(s)

Margin Exhausted, "Brother Huang Li Cheng" Begins Selling Monkeys at a Loss

Foresight NewsHace 36 min(s)

Quantum Computing Approaches "Q-Day": How Encryption Policy, Investment Logic, and Risk Management Are Reshaping the Landscape

Quantum Computing Nears 'Q-Day': Shaping Encryption Policy, Investment Logic, and Risk Management Quantum technology is increasingly intersecting with cryptocurrency policy and cybersecurity discussions as the potential 'Q-Day'—when quantum computers could break current encryption—approaches. While summer brings fast-paced crypto market dynamics, new U.S. legislation, and AI debates, the emerging dimension is how quantum advancements will reshape the digital asset landscape. The next phase of crypto investment is being shaped by two converging forces: clearer regulatory frameworks and cryptographic evolution driven by quantum computing. Investors stand to benefit from reduced uncertainty, but must also recognize that quantum readiness is becoming a core risk factor. Public blockchains rely on cryptography for security, and sufficiently advanced quantum machines could undermine these foundations. This does not mean imminent network collapse, but investors can no longer dismiss the timeline as irrelevant. Key questions now include whether projects have identified their cryptographic dependencies, formulated migration plans to post-quantum cryptography, and established governance for upgrades. For policymakers, the link is clear. Effective crypto policy must look beyond token classification and disclosure to address the underlying infrastructure. As stablecoins, tokenized assets, and blockchain payments integrate deeper into finance, cryptographic resilience becomes a systemic issue. Failure to prepare could lead to investor losses, operational failures, and legal disputes. Policy should encourage risk disclosure, require major intermediaries to maintain upgrade and response plans, and foster coordination across the ecosystem—rather than impose a single technical fix. The sustainability of cryptocurrencies will increasingly depend on their security infrastructure's ability to adapt to these accelerating technological pressures.

Foresight NewsHace 1 hora(s)

Quantum Computing Approaches "Q-Day": How Encryption Policy, Investment Logic, and Risk Management Are Reshaping the Landscape

Foresight NewsHace 1 hora(s)

Bitcoin's Five-Wave Adjustment Nears End, Opportunities Emerge in HYPE Support Zone | Invited Analysis

**Bitcoin's Five-Wave Adjustment Nears End, HYPE Support Zone Presents Opportunity | Guest Analysis** This week, Bitcoin (BTC) is in the final stage of a five-wave corrective structure. The formation of 'Endpoint 44' is key: a level above $58,110 suggests a high probability of a technical rebound, leading likely to wide-range consolidation. A break below $58,110 without bullish divergence warrants caution for further downside. Mid-term bearish positions are maintained at 20%, with 30% of capital reserved for short-term scalping opportunities based on predefined support/resistance levels and three scenario-based plans (A/B/C). Simultaneously, HYPE has entered the 55-56 segment of its own five-wave correction from its $76.94 high. If 'Endpoint 56' forms above the prior low (Endpoint 54), creating a double-bottom pattern, a rebound is significantly likely. A light long position (under 30% allocation) can be considered upon stabilization in the support zone. Last week's BTC short-term strategy, guided by proprietary quantitative models, successfully executed two short trades (1x leverage), yielding a total return of approximately 6.21%. The market move validated the prior weekly forecast of a retest towards the $59,100 support. **Core Trading Views Summary:** * **BTC:** Focus on the formation of 'Endpoint 44'. A scenario above $58,110 allows for tentative longs. Key resistances: $60,900-$62,300, ~$65,500, $67,300-$69,500. Key supports: ~$58,100, ~$55,000. * **HYPE:** Monitor the final position of 'Endpoint 56'. Key resistances: ~$65.5, ~$71.5. Key supports: ~$58.5, $52-$54 zone. Strategy favors buying on dips upon stabilization in support areas with confirmed model signals, with strict position control. **Risk Disclaimer:** Financial markets are volatile. All analysis, models, and strategies herein are based on personal technical analysis for journaling purposes only, not investment advice. Trade at your own risk.

Odaily星球日报Hace 1 hora(s)

Bitcoin's Five-Wave Adjustment Nears End, Opportunities Emerge in HYPE Support Zone | Invited Analysis

Odaily星球日报Hace 1 hora(s)

Trading

Spot

Artículos destacados

Cómo comprar XLM

¡Bienvenido a HTX.com! Hemos hecho que comprar Stellar (XLM) sea simple y conveniente. Sigue nuestra guía paso a paso para iniciar tu viaje de criptos.Paso 1: crea tu cuenta HTXUtiliza tu correo electrónico o número de teléfono para registrarte y obtener una cuenta gratuita en HTX. Experimenta un proceso de registro sin complicaciones y desbloquea todas las funciones.Obtener mi cuentaPaso 2: ve a Comprar cripto y elige tu método de pagoTarjeta de crédito/débito: usa tu Visa o Mastercard para comprar Stellar (XLM) al instante.Saldo: utiliza fondos del saldo de tu cuenta HTX para tradear sin problemas.Terceros: hemos agregado métodos de pago populares como Google Pay y Apple Pay para mejorar la comodidad.P2P: tradear directamente con otros usuarios en HTX.Over-the-Counter (OTC): ofrecemos servicios personalizados y tipos de cambio competitivos para los traders.Paso 3: guarda tu Stellar (XLM)Después de comprar tu Stellar (XLM), guárdalo en tu cuenta HTX. Alternativamente, puedes enviarlo a otro lugar mediante transferencia blockchain o utilizarlo para tradear otras criptomonedas.Paso 4: tradear Stellar (XLM)Tradear fácilmente con Stellar (XLM) en HTX's mercado spot. Simplemente accede a tu cuenta, selecciona tu par de trading, ejecuta tus trades y monitorea en tiempo real. Ofrecemos una experiencia fácil de usar tanto para principiantes como para traders experimentados.

308 Vistas totalesPublicado en 2024.12.13Actualizado en 2026.06.02

Cómo comprar XLM

Discusiones

Bienvenido a la comunidad de HTX. Aquí puedes mantenerte informado sobre los últimos desarrollos de la plataforma y acceder a análisis profesionales del mercado. A continuación se presentan las opiniones de los usuarios sobre el precio de XLM (XLM).

活动图片