Hyperliquid: Should HYPE investors wait as price nears $32 zone?

ambcryptoPublicado a 2026-04-02Actualizado a 2026-04-02

Resumen

Hyperliquid (HYPE) has continued its short-term downtrend, falling below the key $37 support level on April 2nd. Despite previous bounces, none of the recent rebounds were strong enough to push the price toward the local high of $43.7. The broader market sentiment remains pessimistic, with Bitcoin and other altcoins also facing selling pressure. The long-term structure, however, remains bullish. HYPE experienced a significant rally in 2025, nearly reaching $60, before pulling back to $20 by year-end. The recent rise to $43.7 is considered part of a new bullish wave, with the current retracement viewed as a temporary setback. Key Fibonacci retracement levels suggest further potential declines toward the $29.5–$32.44 zone, which long-term buyers are eyeing as a demand area. Technical indicators, including the RSI below 50 and a negative CMF reading of -0.15, reflect bearish momentum and capital outflows. Traders are advised to wait rather than rush into buying. A move above $41.59 would invalidate the current bearish retracement outlook and signal potential new highs. Until then, investors should monitor the $29–$32 range for a buying opportunity.

Hyperliquid [HYPE] continued its short-term downtrend to fall below the $37 level on the 2nd of April. Since the 15th of March, $37 has acted as a reliable short-term support.

Each retest has seen a price bounce, but none of the bounces of the past two weeks were enough to drive prices to the local highs at $43.7. The final week of March saw a move above the psychological $40 mark, but the bears were quick to seize control of the trends thereafter.

At the same time, Bitcoin [BTC] and many prominent crypto altcoins were posting losses and reeling under selling pressure. The market sentiment remained extremely pessimistic.

Does this mean HYPE investors should sell and wait for the downtrend to continue?

HYPE investors should not miss THIS chance
Source: HYPE/USDT on TradingView

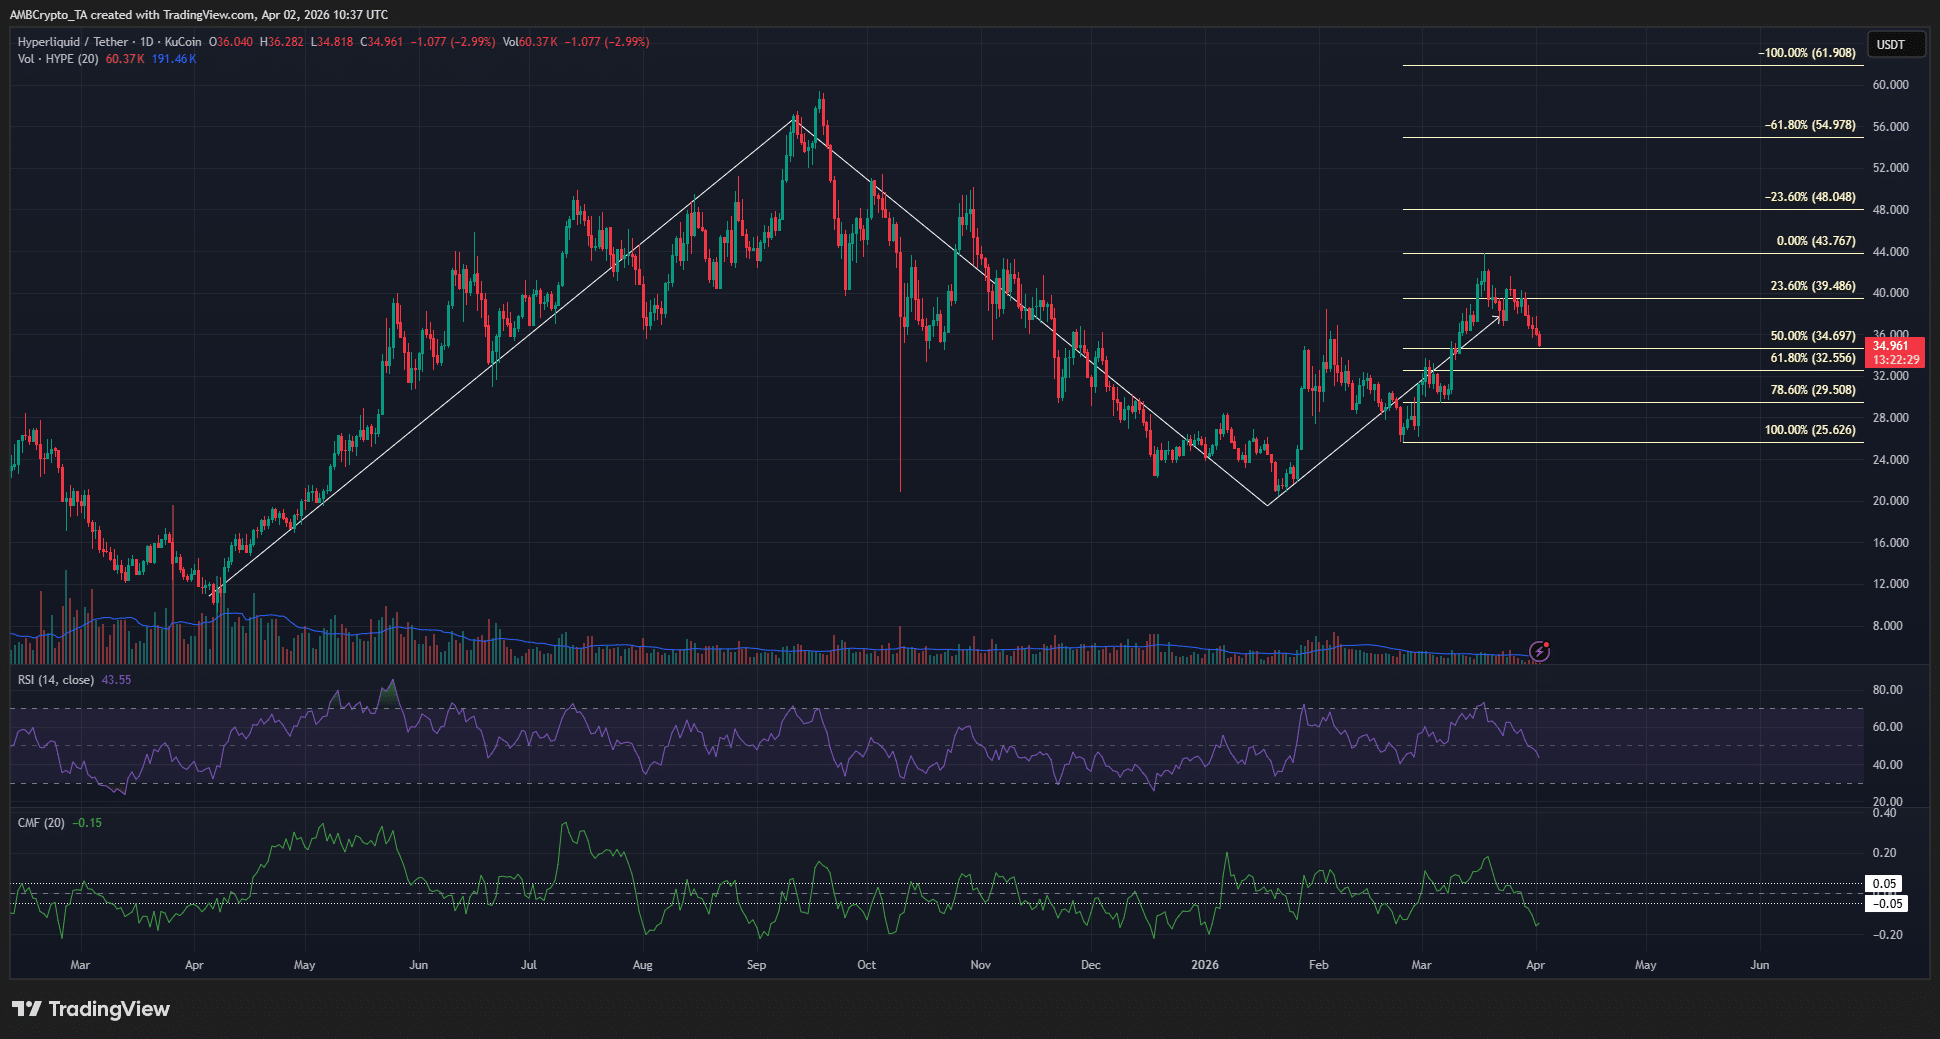
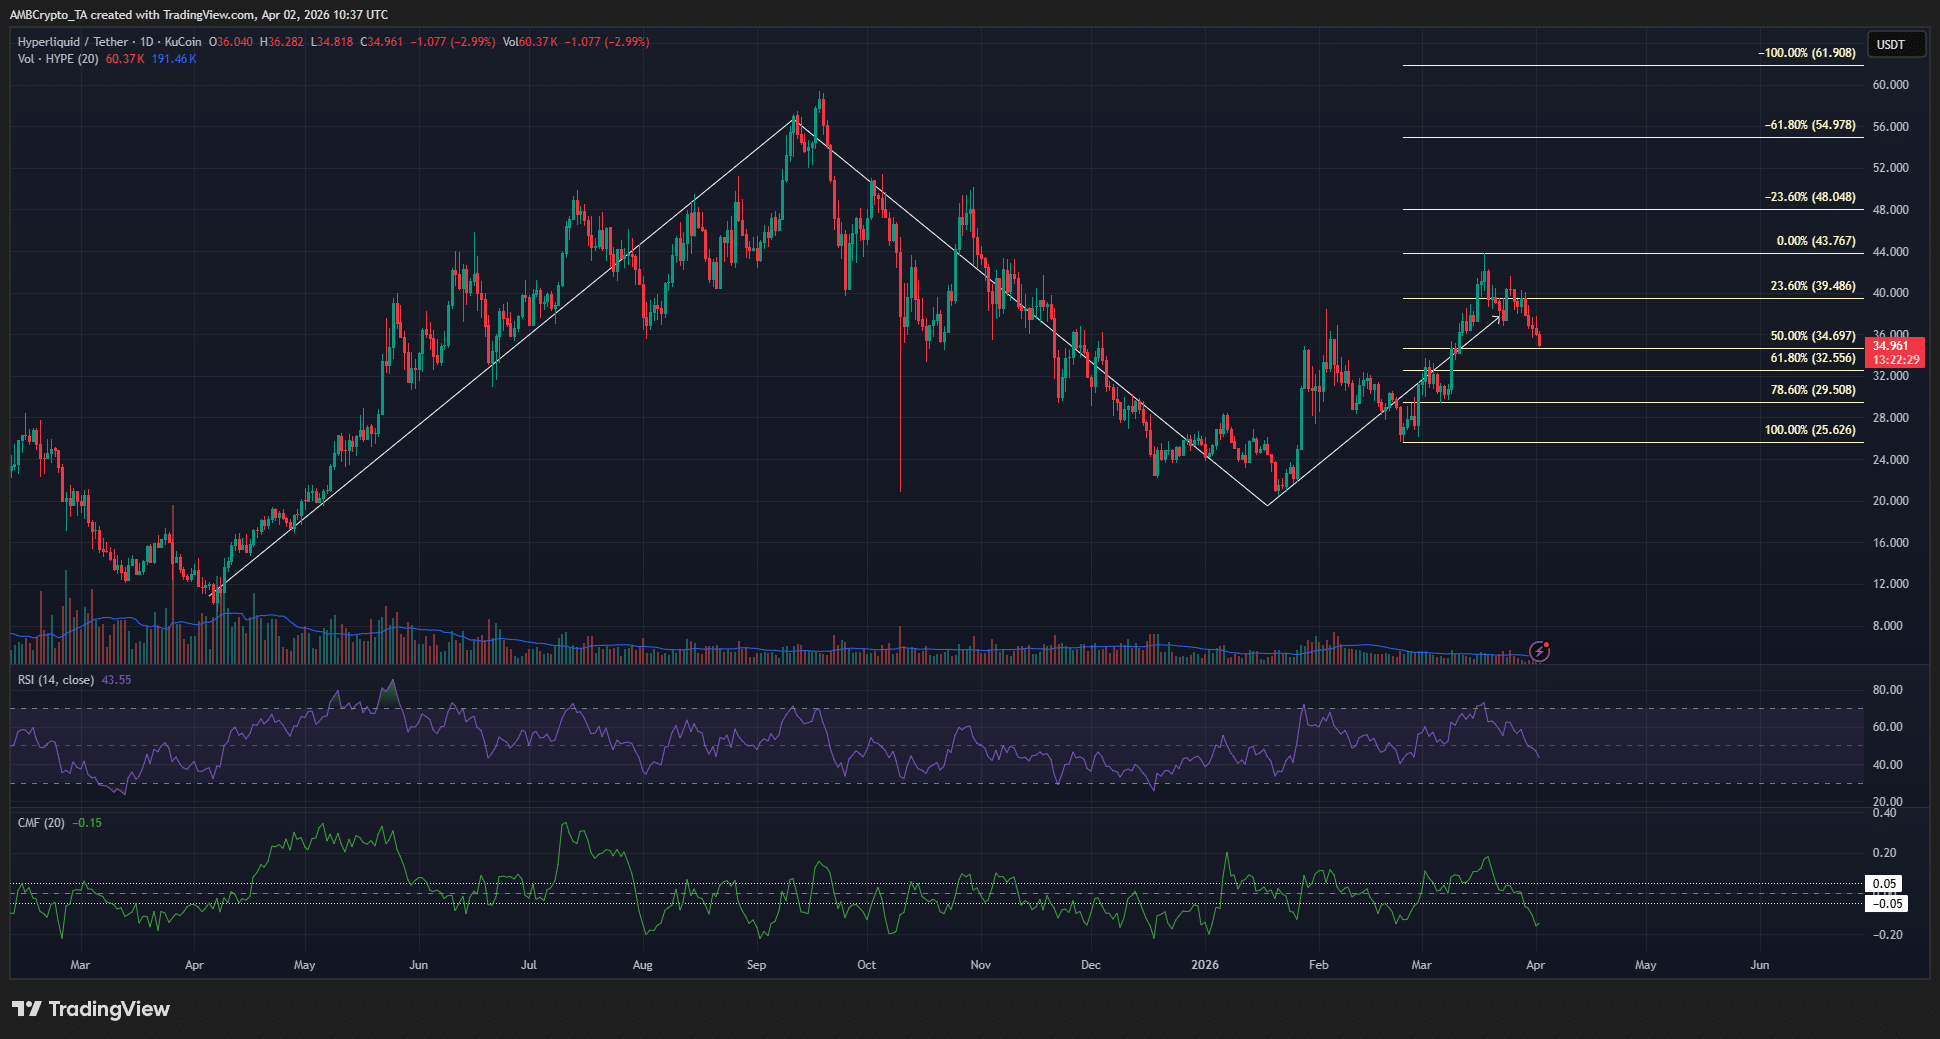
While the recent Hyperliquid token price losses seem grievous, they might just be part of a retracement. The long-term structure showed that HYPE saw a rally in 2025 that nearly reached $60, then pulled back to $20 by year-end.

The push higher to $43.7 since then has been part of the next bullish wave higher. The rally in March saw a pullback over the past two weeks, and this retracement could continue for a bit longer.

The Fibonacci retracement levels plotted for the most recent swing move higher from $25.6 showed that there was more space for HYPE to fall. The $32.44 and $29.5 were the levels in the golden pocket that long-term buyers will want to keep an eye on.

Yet, they shouldn’t rush to buy, either. At press time, the RSI showed that the momentum had turned bearish, with the RSI sliding below neutral 50. The CMF also reflected hefty capital outflows from the market, with a reading of -0.15.

Traders’ call to action: Wait
Source: HYPE/USDT on TradingView

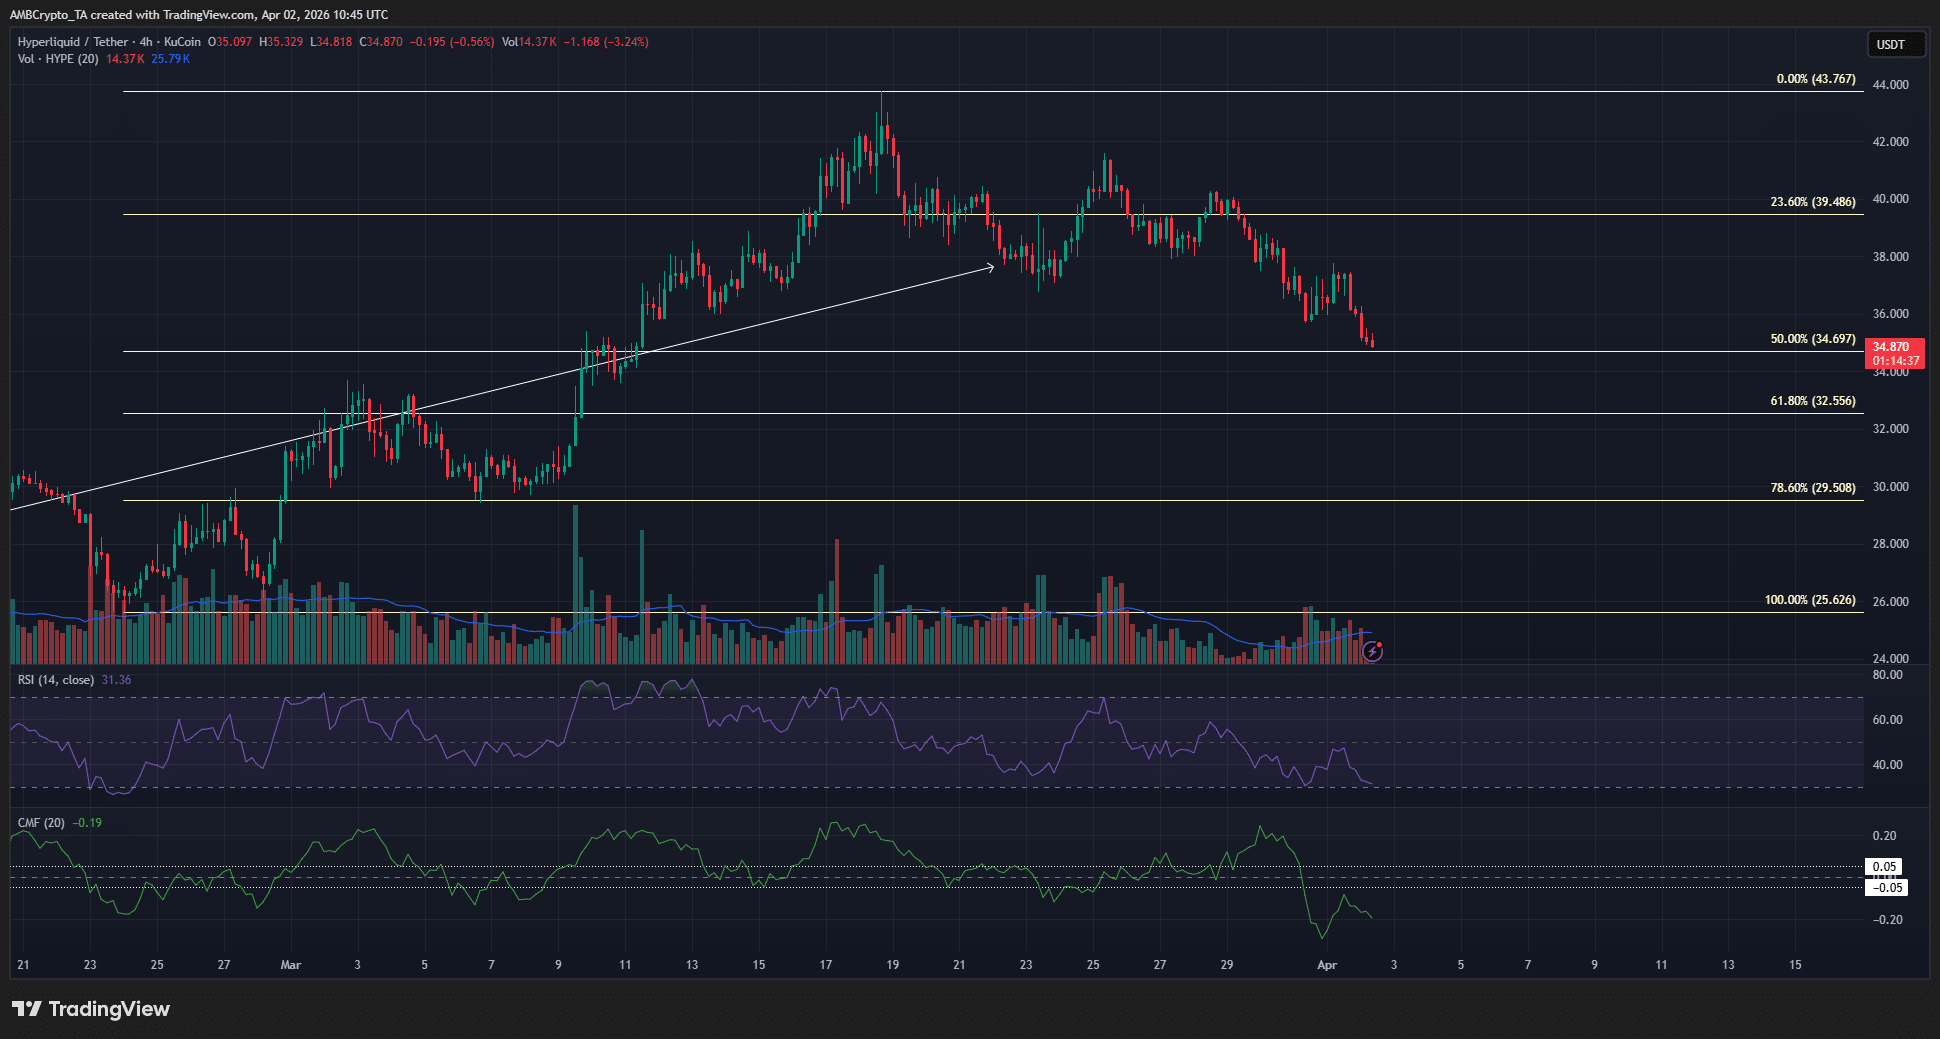
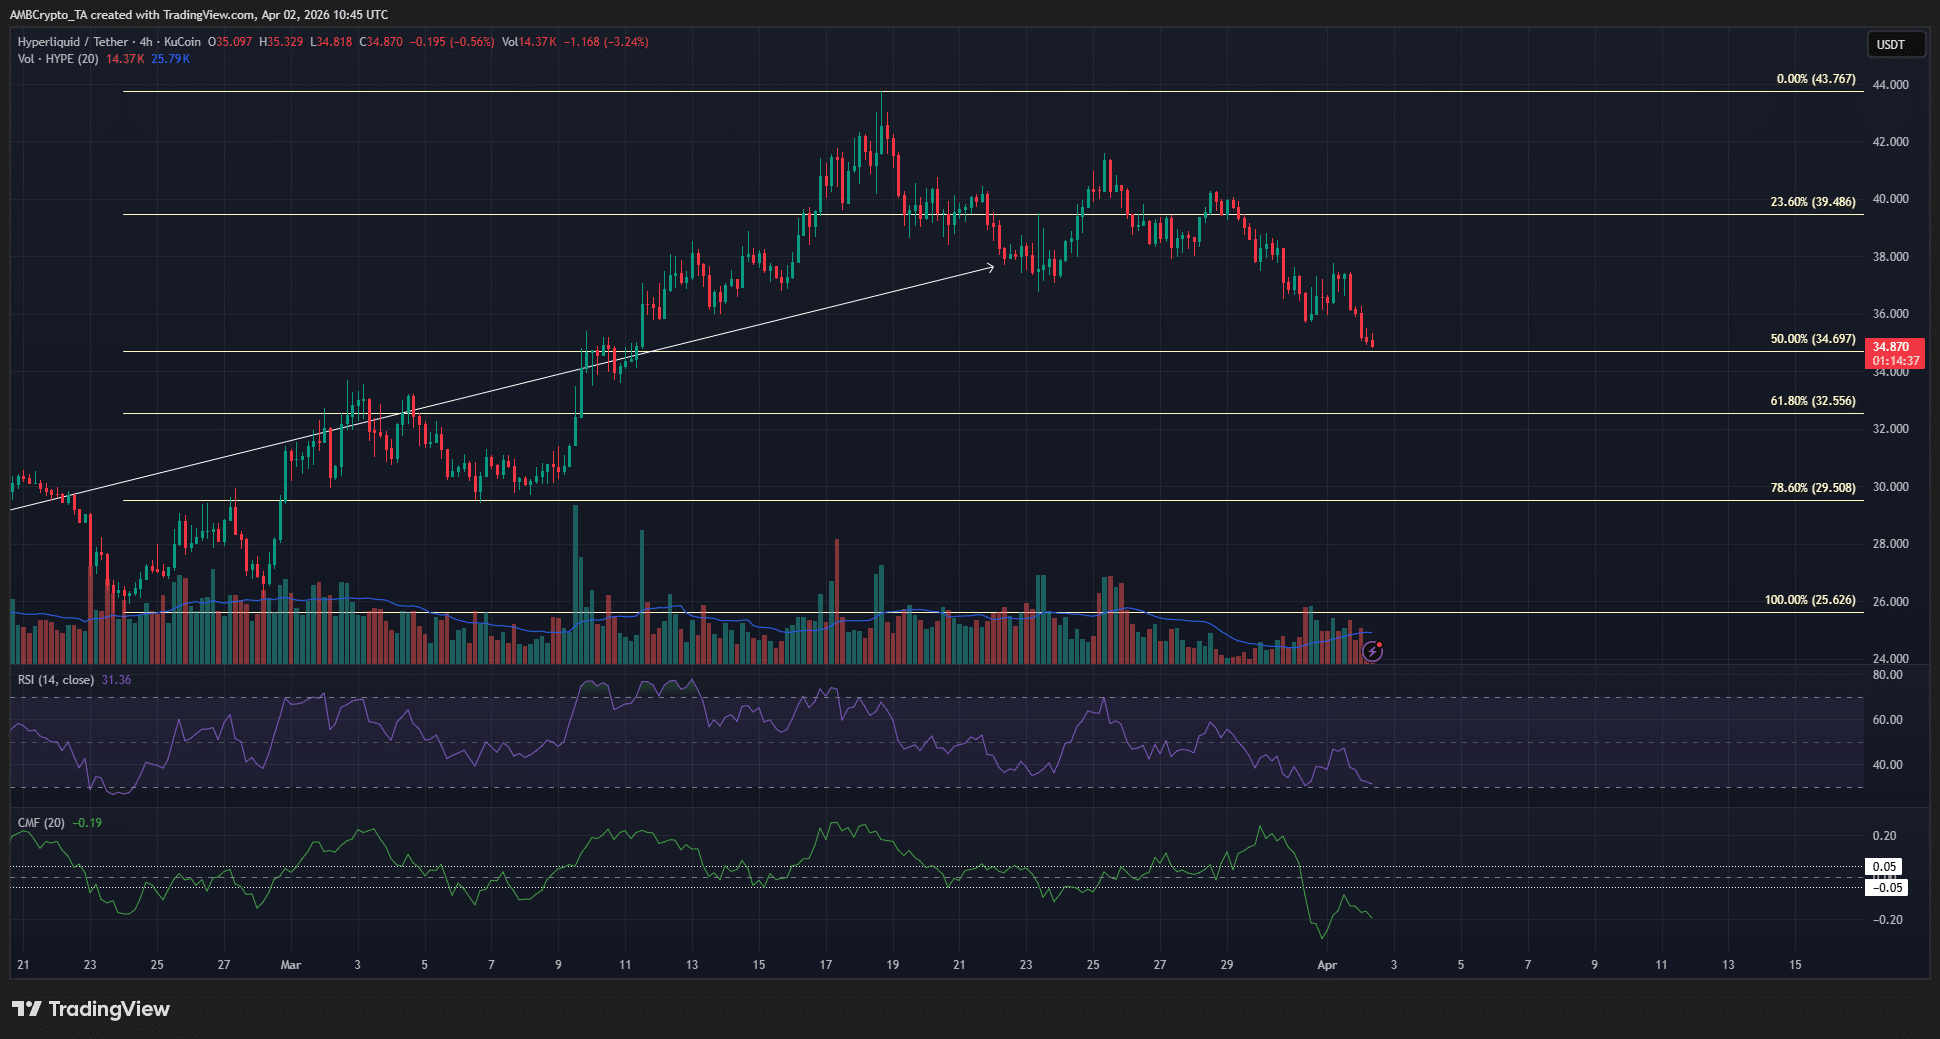
The 4-hour chart showed a bearish structure in place for HYPE. The lower high it set below $42 on the 25th of March was the swing high on this timeframe. Meanwhile, the $29.55-$32.5 zone remained the demand zone for buyers to defend.

A move back above $41.59 is needed to prove this retracement idea wrong and show that the token has what it takes to make new highs past $43.7. Until this happens, long-term investors can wait for the retracement to end before buying.


Final Summary

  • The long-term Hyperliquid token price trend was bullish, but the current short-term trend was bearish.
  • The current sell-off comes with the longer-term structure’s pullback. Therefore, investors with a time horizon will be watching the $29-$32 demand zone.


Preguntas relacionadas

QWhat key support level did Hyperliquid (HYPE) fall below on April 2nd, which had been reliable since mid-March?

AHyperliquid fell below the $37 support level on April 2nd, which had acted as a reliable short-term support since March 15th.

QAccording to the Fibonacci retracement levels, which two price zones are identified as the 'golden pocket' for potential long-term buying opportunities?

AThe Fibonacci retracement levels identified the $32.44 and $29.5 price zones as the 'golden pocket' for potential long-term buying opportunities.

QWhat two indicators are mentioned as showing bearish momentum and capital outflows for HYPE at press time?

AAt press time, the RSI had slid below the neutral 50 level, indicating bearish momentum, and the CMF had a reading of -0.15, reflecting hefty capital outflows.

QWhat price does HYPE need to move back above to prove the current retracement idea wrong and signal potential for new highs?

AHYPE needs to move back above $41.59 to prove the current retracement idea wrong and show potential to make new highs above $43.7.

QWhat is the overall recommendation for long-term HYPE investors based on the article's final summary?

AThe overall recommendation for long-term investors is to wait for the current retracement to end and to watch the $29-$32 demand zone as a potential buying opportunity, as the long-term trend remains bullish despite the short-term bearish trend.

Lecturas Relacionadas

In Jinjiang, Fujian, a Storage Super Unicorn Lies Quiet

In Fujian's Jinjiang, a city known for sportswear, lies a quiet semiconductor giant: Fujian Jinhua Integrated Circuit Co. (JHICC). Once a promising domestic DRAM manufacturer alongside Yangtze Memory and ChangXin Memory Technologies (CXMT), its journey was derailed in 2018 when the U.S. placed it on an Entity List and filed criminal charges for alleged trade secret theft. This halted production for years. A turning point came in February 2024 when a U.S. federal court found JHICC not guilty. However, it had lost crucial time. While CXMT soared to become a top-valued A-share company in 2024, JHICC, with an estimated valuation of 80 billion RMB, was just restarting. Its current output is primarily customized DDR4 chips, not the advanced DDR5/HBM demanded for AI, but it still benefits from the broader memory chip upcycle. JHICC's story is tied to Chen Zhengkun, a veteran engineer who left Micron to lead the venture. Founded in 2016 with state-backed funding, JHICC partnered with Taiwan's UMC to develop DRAM technology. Rapid progress was cut short by the U.S. actions, which Micron initiated, partly due to its heavy reliance on the Chinese market. Post-sanctions, Chen's team worked to rebuild the production line with reduced reliance on U.S. technology. According to its records, JHICC achieved small-scale production and revenue growth under immense pressure. It now focuses on the stable "niche" DRAM market (e.g., TVs, routers) with a monthly capacity of ~40,000 wafers, aiming for 60,000 by 2026. It holds over 1,000 patents but remains on the Entity List. For Jinjiang, investing in JHICC was a bold industrial leap. The local government provided unwavering financial and logistical support during the crisis, helping the company survive. JHICC has become the anchor for a growing local semiconductor cluster. Though its scale lags behind domestic peers, JHICC's persistence symbolizes a hard-won foothold in a global market long dominated by Samsung, SK Hynix, and Micron. Having missed one boom, it seeks a place in the new AI-driven memory supercycle.

marsbitHace 51 min(s)

In Jinjiang, Fujian, a Storage Super Unicorn Lies Quiet

marsbitHace 51 min(s)

Trading

Spot
活动图片