Ethereum "Cooling Off" to Build Momentum? ETF Funds Quietly Flow Back, Is the Historic Rally Script About to Play Out Again?

marsbitPublicado a 2025-12-12Actualizado a 2025-12-12

Resumen

Ethereum's price has been consolidating near $3,200 after facing resistance between $3,350 and $3,650, a zone reinforced by the 200-day EMA. Despite this, signs of recovery are emerging in spot ETF flows. Since November 21, ETH ETF assets under management have increased by 28%, from $16.8 billion to $21.5 billion, indicating a gradual return of buyer interest. Although net flows remain negative at -$138 million, this marks a significant improvement from October’s -$500 million, suggesting weakening selling pressure. The 30-day moving average of net active buying is also rising, resembling a pattern seen in early 2025 that preceded a major price surge. On the 4-hour chart, ETH is testing a key demand zone between $3,100 and $3,180. A hold above this level could lead to a retest of the 200-day EMA and a breakout toward $3,900. However, a breakdown may trigger a drop toward $3,000. Derivatives data shows neutral sentiment with mild funding rates and open interest, indicating cautious optimism. The key for Ethereum’s next major move depends on sustained defense at current support levels, coupled with growing ETF inflows and active buying momentum.

Ethereum's price action has flattened this week, encountering significant resistance in the supply zone between $3,650 and $3,350. The token is currently consolidating near $3,200. This resistance level roughly coincides with the 200-day Exponential Moving Average (EMA), further reinforcing the overhead pressure in this area. Notably, just as this is happening, spot Exchange Traded Fund (ETF) flows are beginning to show initial signs of recovery.

Key Points:

  • Since November 21st, the Assets Under Management (AUM) for spot Ethereum ETFs have increased from $16.8 billion to $21.5 billion, a gain of 28%.
  • Net active buying volume is showing an upward trend, indicating that the previously strong selling pressure is weakening, while buying power is gradually returning.
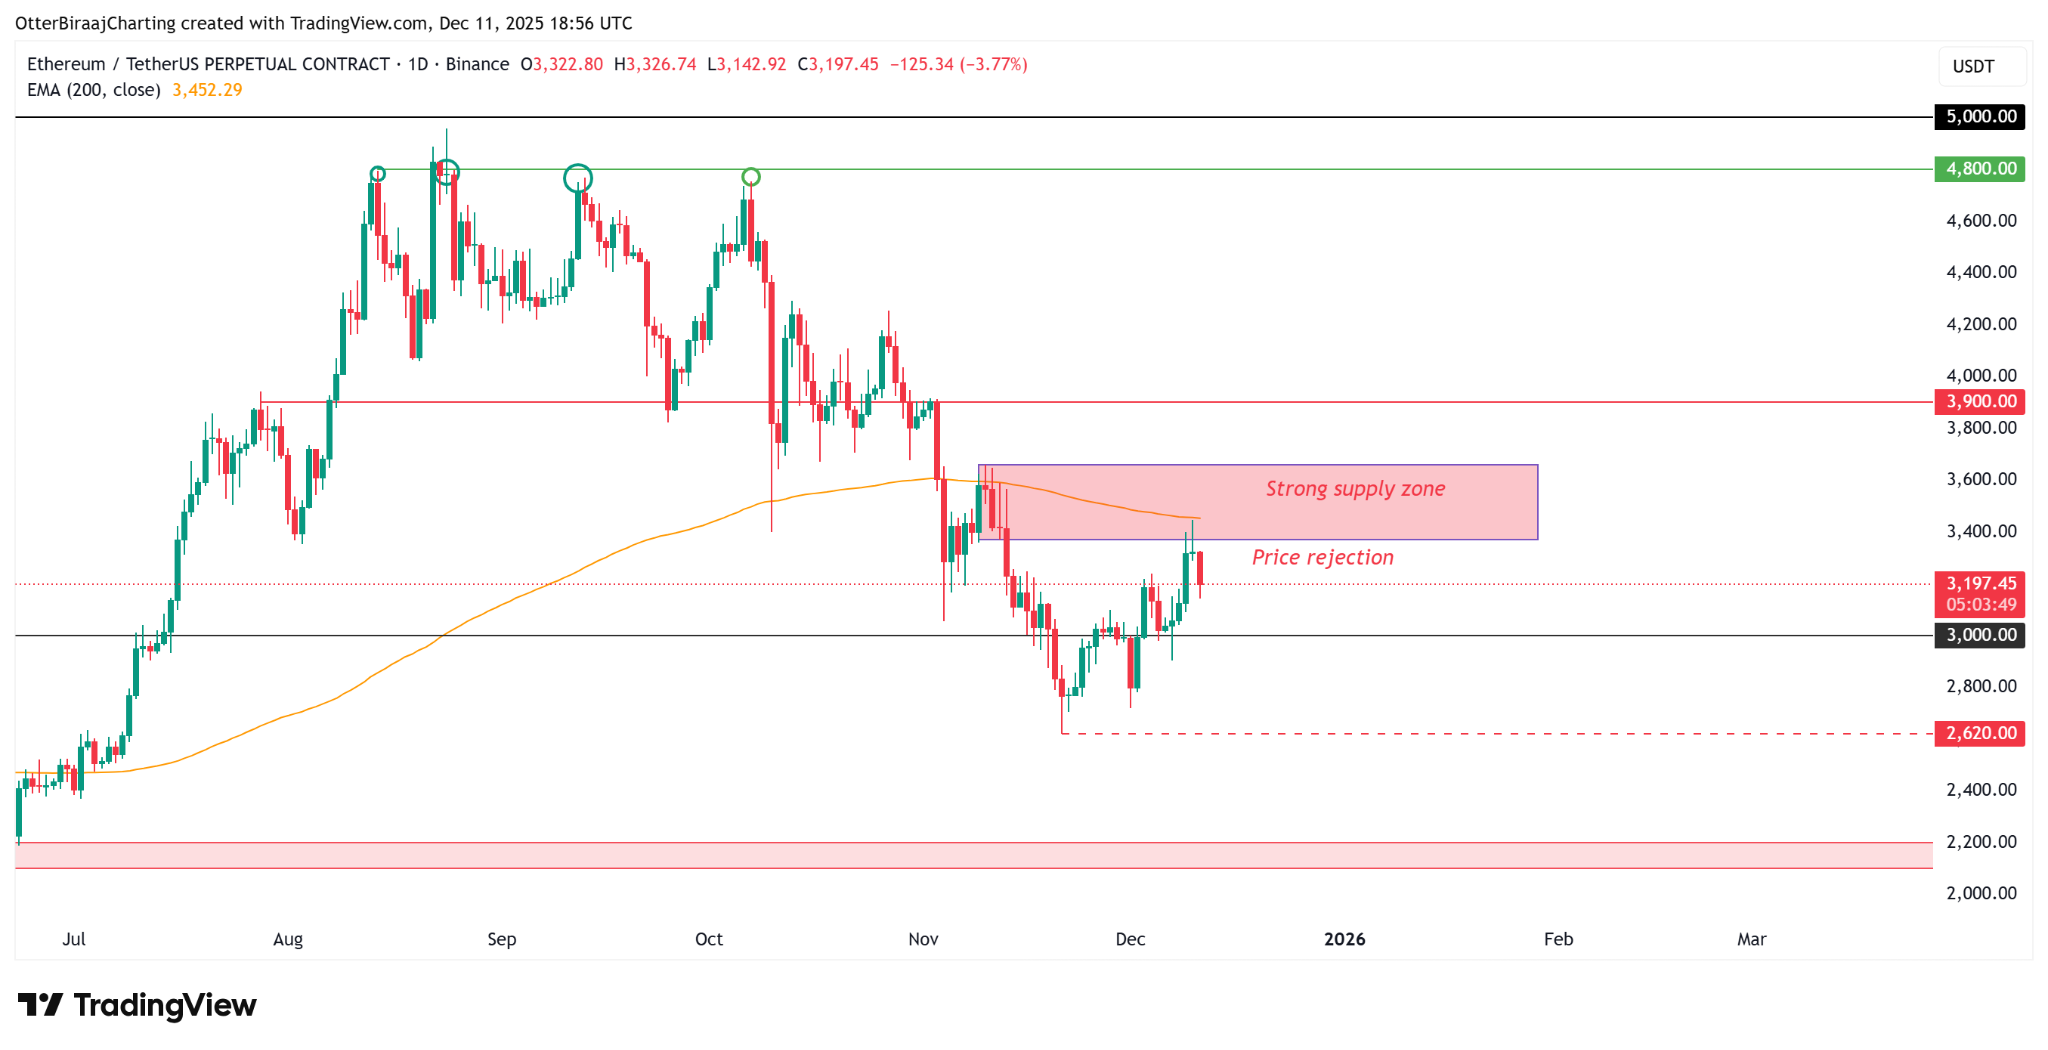
Ethereum Daily Chart. Source: TradingView


ETF Inflows Resume, But Charts Reflect Lingering Investor Caution

According to data from Glassnode, after weeks of consecutive outflows, spot ETH ETFs are finally showing initial "signs of recovery." Since November 21st, ETF net asset values have rebounded by 28%, suggesting potential improvement in market demand before year-end. However, compared to the peak of $32 billion in early October, the magnitude of this rebound remains modest, indicating that institutional confidence has not yet fully recovered.
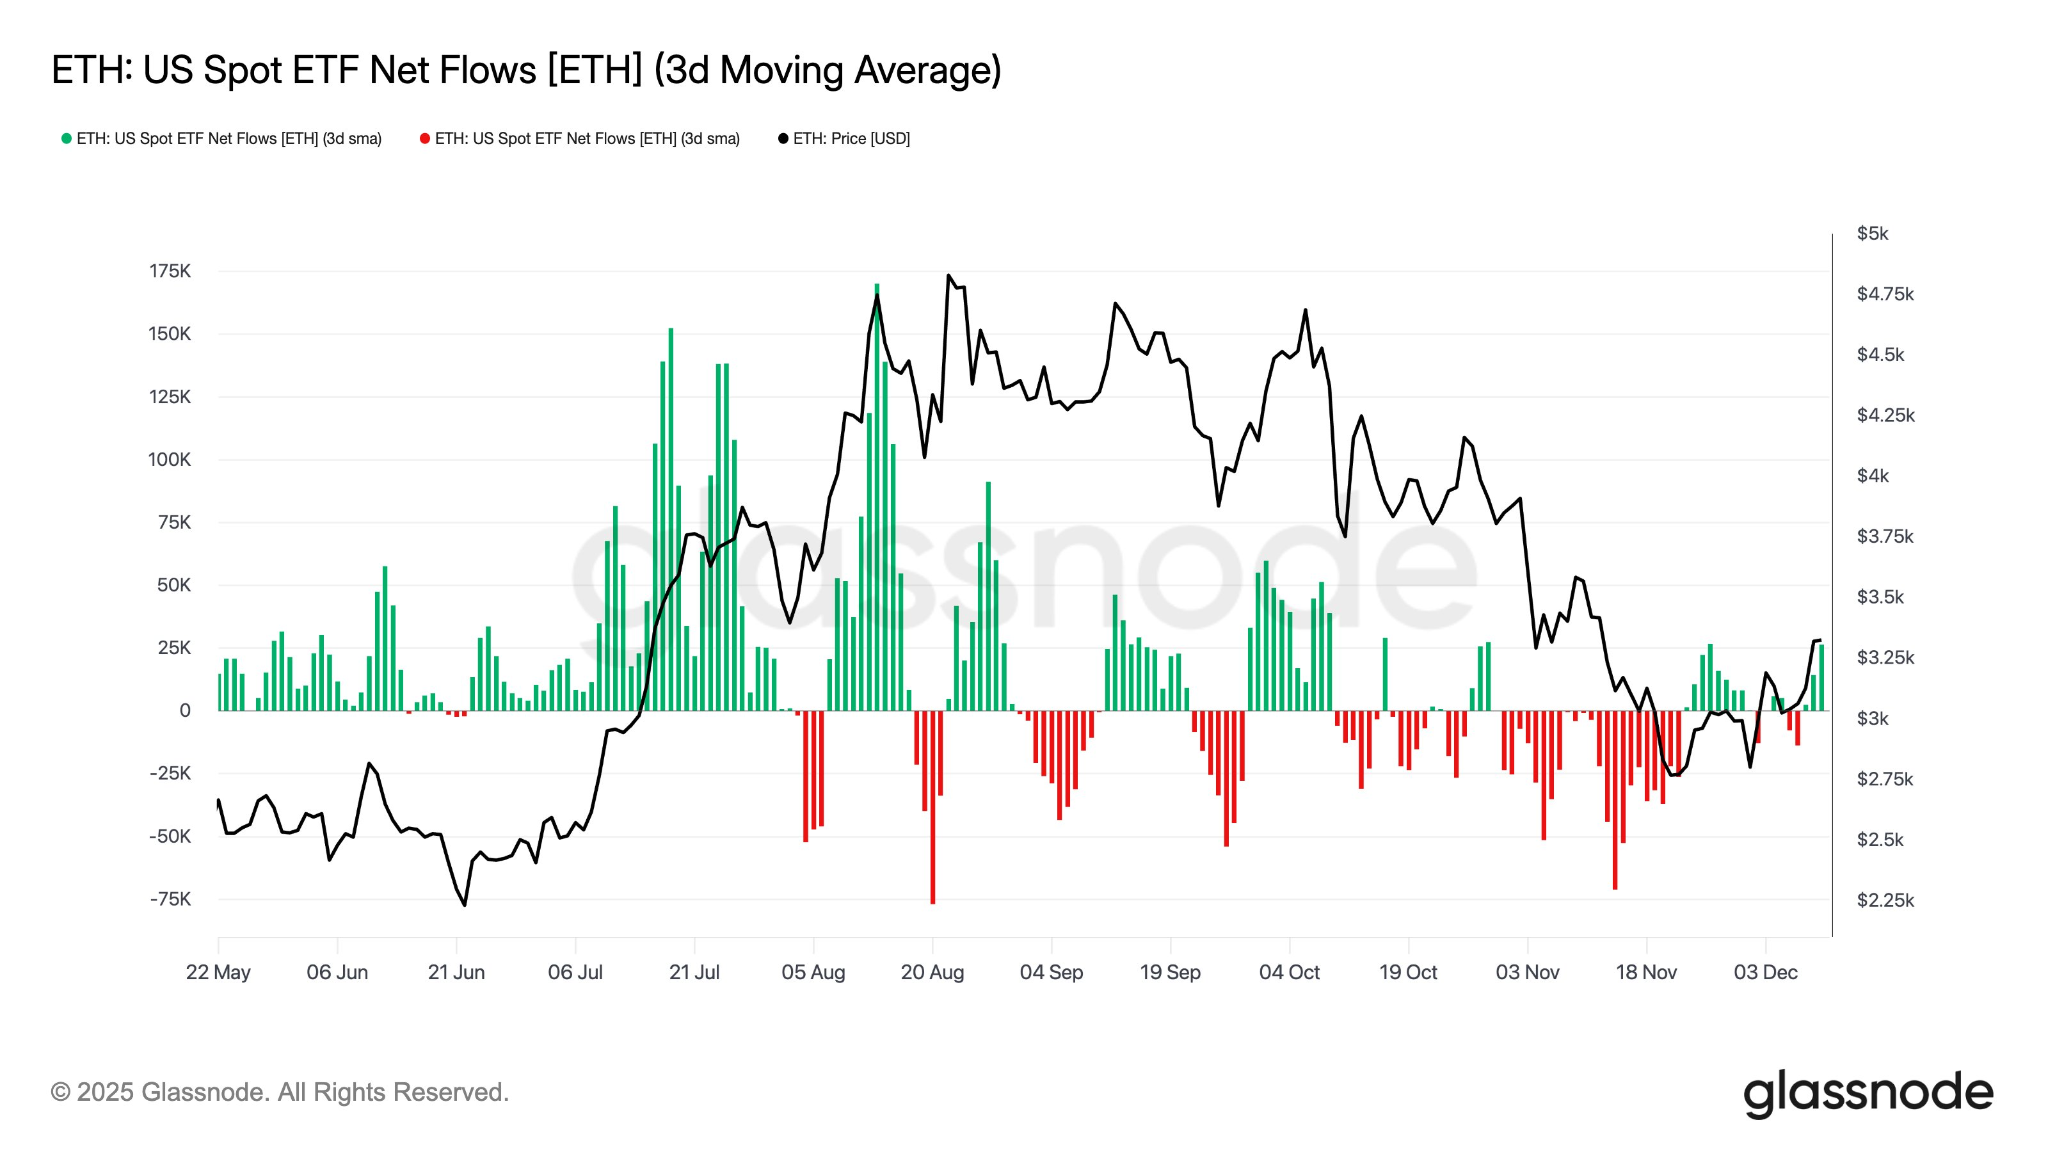
Spot ETH ETF Net Flow. Source: Glassnode

Data from CryptoQuant further supports this assessment. Although the net flow remains negative (-$138 million), it has improved significantly from the -$500 million seen in October, marking a structural shift. During the correction phase from September to October, the market was dominated by active selling, but this trend is gradually subsiding.

The 30-day moving average of net active buying volume is also showing a pattern of rising lows. A similar structure appeared in early 2025, after which the Ethereum price achieved a nearly 3-fold increase and reached a new all-time high.

If the current trend continues, this positive shift in active buying activity could become a key catalyst driving Ethereum to break out upward again in the coming weeks.
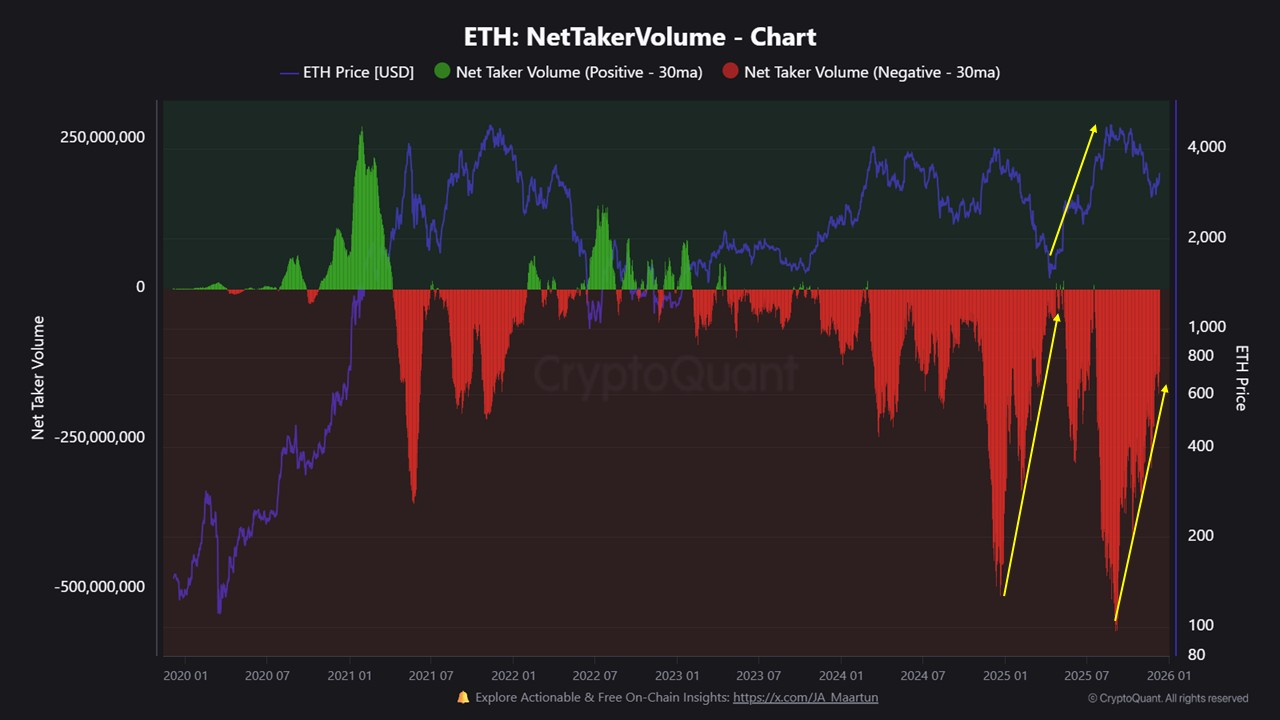

Ethereum On-Chain Flow Data. Source: CryptoQuant


ETH Price Consolidates in Support Zone, Derivatives Market Cools Off

The current Ethereum price is testing the order block density zone between $3,100 and $3,180 on the 4-hour chart, an area that could transform into near-term demand support. Although the ETH price remains within an ascending channel, the upward momentum has noticeably weakened. The market is in a structural decision-making phase regarding its direction.
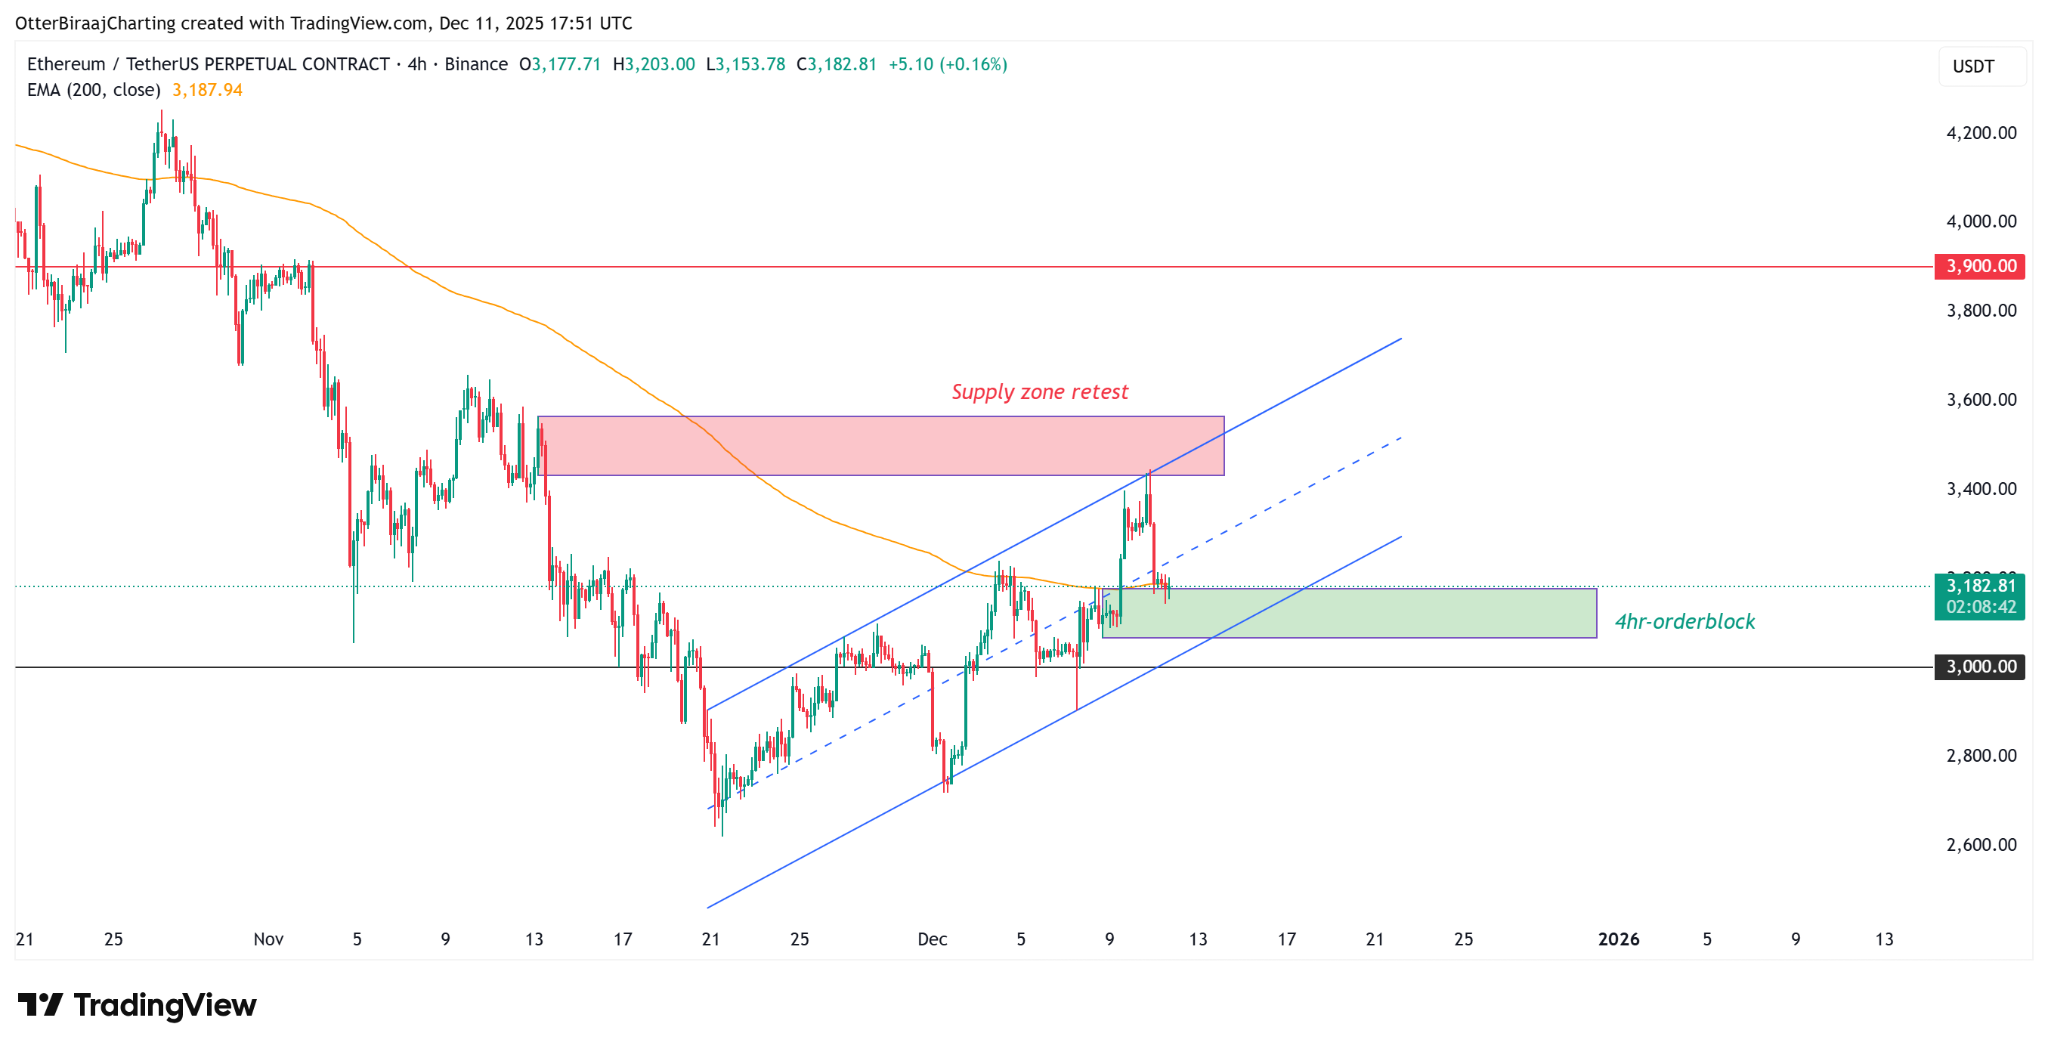

4-Hour Price Chart. Source: TradingView

From a bullish perspective, if the price can hold above this demand zone and the channel support, ETH could potentially attack the daily 200-day EMA again. A clear break above $3,450 would invalidate the previously formed resistance and open the path for the price to test the $3,900 resistance level.

From a bearish viewpoint, a break below the lower trendline of the current ascending channel would constitute a bearish signal, potentially leading the price to test the key $3,000 support level.

Data from Hyblock shows the Ethereum derivatives market presents a neutral yet fragile landscape. After the price met resistance, the Total Open Interest (OI) slightly declined. Funding rates are positive but not significantly high, and the buy-sell ratio is also near neutral, indicating that spot investors have not yet formed a consensus bullish expectation.
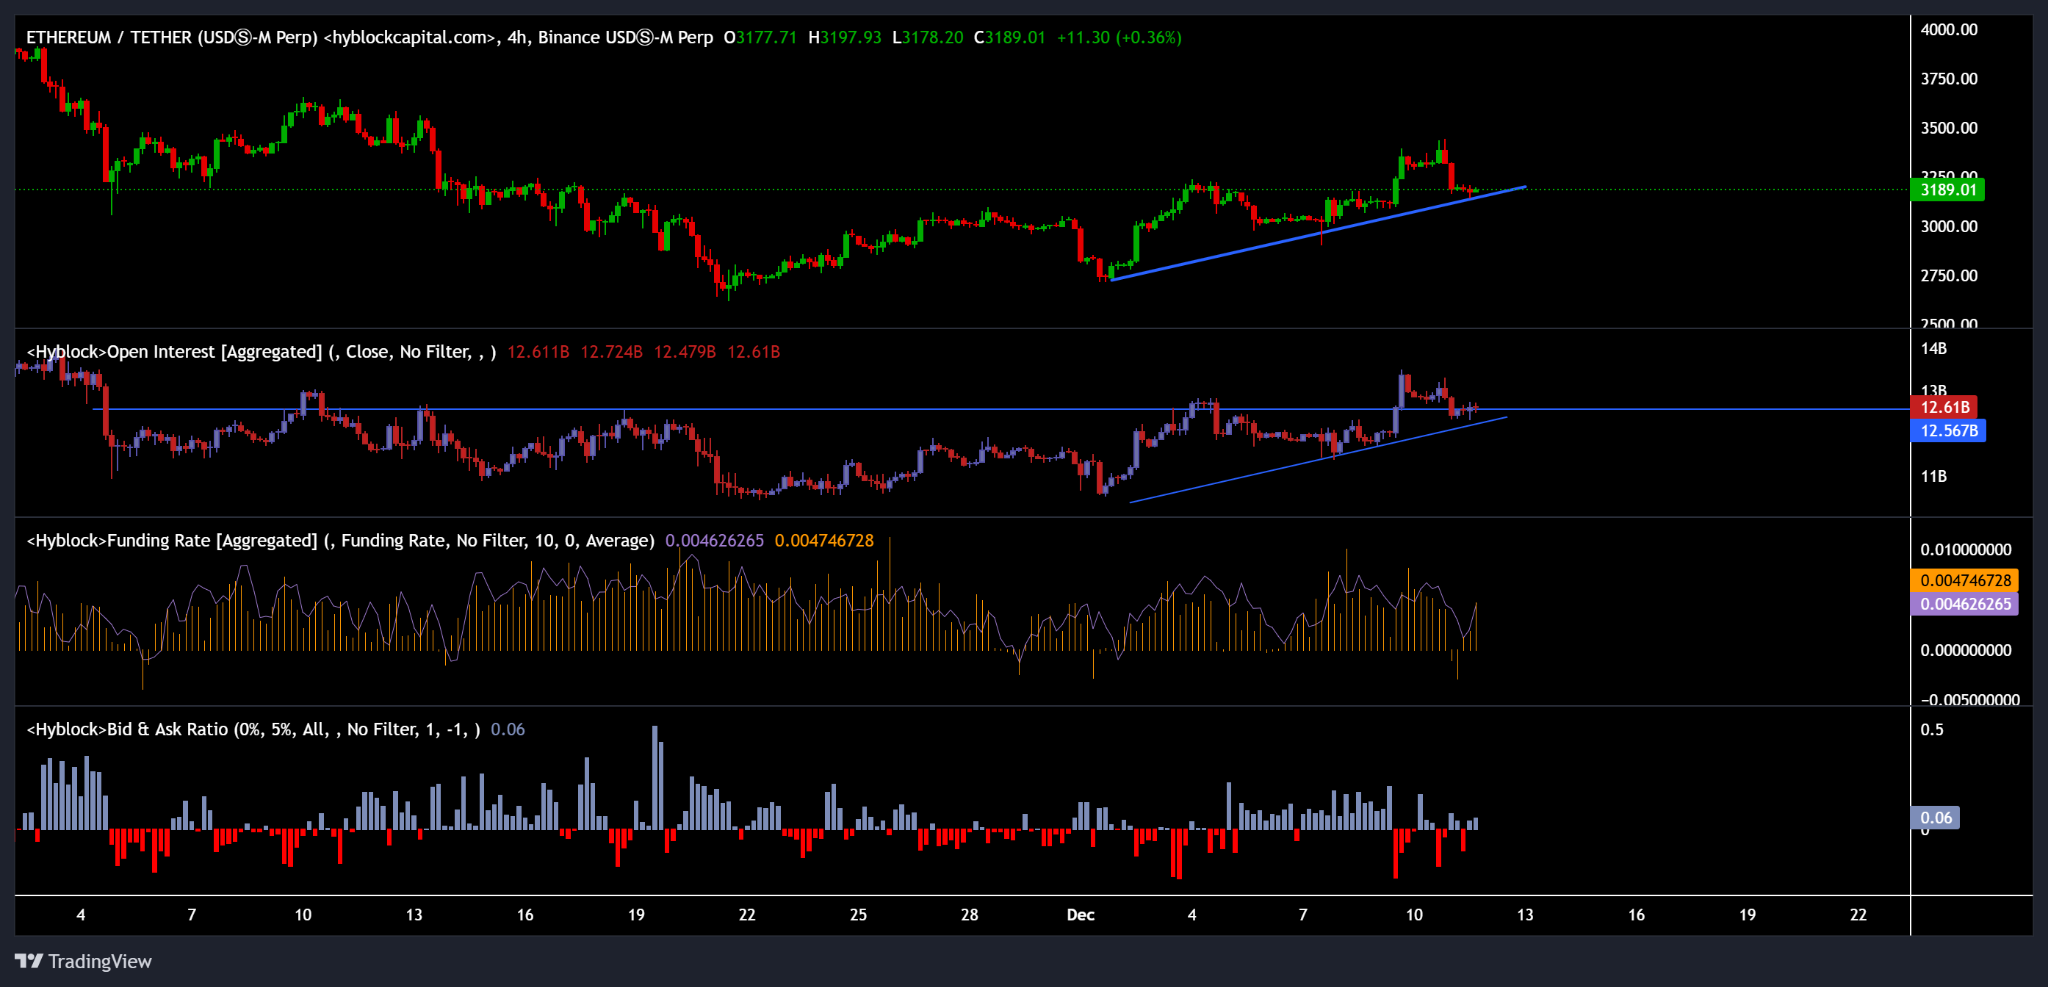
Ethereum Futures Market Data. Source: Hyblock Capital

Summary: The key to Ethereum's subsequent price action lies in whether the bulls can sustain their defense in the demand support area, thereby catalyzing a virtuous cycle between active buying flows and ETF demand, ultimately translating into sustained upward momentum.


Criptos en tendencia

Preguntas relacionadas

QWhat is the current price range where Ethereum is consolidating, and what key resistance level is it facing?

AEthereum is currently consolidating around $3200, facing significant resistance in the $3650 to $3350 supply zone, which aligns with the 200-day Exponential Moving Average (EMA).

QHow much has the assets under management (AUM) for spot Ethereum ETFs increased since November 21, and what does this indicate?

ASince November 21, the AUM for spot Ethereum ETFs has increased by 28%, from $16.8 billion to $21.5 billion, indicating a potential recovery in market demand and a shift from strong selling pressure to returning buyer interest.

QWhat key on-chain metric from CryptoQuant shows a structural shift in market dynamics, and how has it improved?

AThe net flow metric, while still negative at -$138 million, has improved significantly from -$500 million in October, indicating a structural shift where the previously dominant active selling pressure is diminishing.

QWhat is the critical support zone on the 4-hour chart that Ethereum is testing, and what are the potential price targets for a bullish breakout?

AEthereum is testing the order block support zone between $3100 and $3180 on the 4-hour chart. A bullish breakout above the 200-day EMA and a clear break above $3450 could open the path for a move towards the $3900 resistance level.

QWhat does the data from Hyblock Capital indicate about the current sentiment in the Ethereum derivatives market?

AHyblock Capital data shows a neutral but fragile sentiment in the derivatives market. Open Interest (OI) has slightly decreased, funding rates are positive but not excessively high, and the buy-sell ratio is near neutral, indicating that spot investors have not yet formed a strong, unified bullish consensus.

Lecturas Relacionadas

Odaily Editorial Department Tea Party (July 8)

Odaily Editorial Team Casual Chat (July 8) This is an informal column from Odaily's editorial team, sharing immediate thoughts on industry news, data, and hot topics from various angles. It presents investment ideas and opportunity hypotheses still under verification—which may not be direct wealth codes but questions in themselves—alongside observations from industry interactions and materials that genuinely enhance the team's understanding. The content is based on real investment and observation experiences, carries no advertising, and does not constitute investment advice. Its purpose is to broaden perspectives and supplement information sources, not to create consensus. Team Member Shares: * **Wenser (@wenser2010):** Noted a deeper correction (nearly 30%) in US and Korean stocks, including memory stocks, but remains bullish on DRAM due to perceived supply shortages. In prediction markets, personal small bets outperformed blind copying; favors France to win the World Cup. Views crypto-related stocks like STRK as bearish for now, while seeing Circle and Coinbase as potential rebound plays. Observes recent strength in software stocks like Microsoft but is unsure if it's a sustained recovery. * **Bcxiongdi (@bcxiongdi):** Discusses the recent "recovery training" in meme coin markets on Solana and BSC, characterized by small-scale PVP opportunities, admitting to having sold many assets too early. Suggests also watching the Robinhood chain. Found World Cup prediction markets challenging, advising to consider buying during matches rather than only before. * **Azuma (@azuma_eth):** Focuses on the US stock market, particularly the significant semiconductor correction. Believes demand fundamentals remain and considers buying the dip in DRAM stocks. Notes a potential rotation signal as hedge funds have recently concentrated buying in tech stocks. Plans to continue adding to RKLB (Rocket Lab) stock, seeing limited downside and high upside potential at current levels after its founder's share sale window closed.

Odaily星球日报Hace 13 min(s)

Odaily Editorial Department Tea Party (July 8)

Odaily星球日报Hace 13 min(s)

Former Huawei 'Genius Teen' Who Questioned DeepSeek Interview Lands in 'Crossfire' from Web3 Investor

Former Huawei "Genius Youth" Li Bojie recently drew public attention by criticizing his interview experience with DeepSeek. The controversy escalated when Du Jun, co-founder of Web3 investment firm ABCDE Capital, publicly accused Li of being "the founder with the least sense of contractual spirit" he had ever cooperated with, sparking a dispute over Li's startup project, Metagent. Li detailed a frustrating DeepSeek interview where he was accused of potential plagiarism, leading him to end the session. The spotlight then shifted to his venture, Metagent, a Web3+AI project aiming to tokenize AI agents. ABCDE invested $1.5 million, with an initial $500k disbursed. Du Jun claimed the project's progress was severely lacking, with a poor-quality demo and minimal social media activity. He alleged Li stopped communicating, deleted his Telegram, and failed to provide proper financial reporting. In response, Li argued the remaining $1 million was never received, crippling operations and forcing salary cuts. He stated he left Metagent in October 2024 due to family reasons and Web3 compliance concerns, with board approval. He claimed to have fulfilled disclosure duties and that his subsequent projects avoided conflicting fields. Other investors, including ArkStream Capital, shared negative due diligence experiences, citing unprofessional contracts and evasive answers on tokenomics. Metagent's social media went silent in June 2024, effectively stalling. Li has since moved to a new consumer AI agent platform, Pine AI (formerly Logenic AI), which has raised $25 million in Series A funding. He served as its Chief Scientist but recently left, clarifying he was not the founder and departed due to a shift in research interests.

Foresight NewsHace 42 min(s)

Former Huawei 'Genius Teen' Who Questioned DeepSeek Interview Lands in 'Crossfire' from Web3 Investor

Foresight NewsHace 42 min(s)

SemiAnalysis: Anthropic's Q3 Profit to Exceed $1 Billion

Research firm SemiAnalysis reveals that Anthropic is reshaping the AI commercialization landscape with profitability and growth rates far exceeding competitors. Leveraging a high-margin, API-centric business model, Anthropic has become a leader in the B2B AI market. The report projects that Anthropic will achieve a GAAP EBIT of $1 billion in Q3 2026, with a 6% margin. Its Annual Recurring Revenue (ARR) has surged from $9 billion at the end of 2025 to over $60 billion currently. If it maintains a Net New ARR (NNARR) of approximately $15 billion per month, its ARR could reach $300 billion by the end of 2027, implying a $6 trillion enterprise value and making it the world's most valuable company. Anthropic secretly filed for an IPO on June 1st. SemiAnalysis argues the timing is strategically urgent due to narrowing capital market windows as rivals like Alphabet and Meta secure major funding. The superior financials and business model suggest Anthropic should go public before OpenAI to seize the competitive initiative. The performance inflection stems from the explosive adoption of Claude Code, which now accounts for over 7% of all GitHub commits, driving monthly NNARR from $3 billion in January to $11 billion in March. Anthropic's revenue structure differs significantly from OpenAI's. Approximately 75-85% of Anthropic's ARR comes from usage-based API fees, with consumer subscriptions constituting only about 5%. In contrast, over 65% of OpenAI's Q1 2026 revenue was from subscriptions, with ~40% from consumers. The API model's key advantage is no per-user revenue cap, enabling growth within existing accounts. Anthropic's Net Revenue Retention (NRR) is an extraordinary 500%. This drives superior gross margins, now in the mid-60% range versus -94% in 2024, with API margins exceeding 80%. Core drivers are improved inference efficiency and a largely enterprise-focused model without the cost of serving hundreds of millions of free users. The report introduces "EBTIT" (Earnings Before Training & Interest & Taxes) to measure re-investment capacity, projecting Anthropic's cumulative EBTIT through 2028 will be $250 billion higher than OpenAI's. Over 65% of lab ARR currently comes from programming use cases. Cybersecurity is seen as the next major vertical, with upcoming model releases like Fable expected to further increase token pricing and expand NNARR. Indirect sales via hyperscaler platforms (AWS Bedrock, Azure Foundry) now account for 15-20% of ARR. A core constraint is compute supply. By 2030, combined unconstrained compute demand from Anthropic and OpenAI could exceed 100 GW, far outstripping projected new capacity. IPO proceeds are seen as crucial to lock in future compute resources. Key risks include potential price cuts by OpenAI, competitive pressure from Google DeepMind and Meta in coding models, potential government restrictions on frontier model releases, and margin dilution from growing indirect "Token-as-a-Service" sales. Regulatory actions that narrow the capability gap between open-source and proprietary models are highlighted as a fundamental threat to Anthropic's moat.

marsbitHace 55 min(s)

SemiAnalysis: Anthropic's Q3 Profit to Exceed $1 Billion

marsbitHace 55 min(s)

Trading

Spot

Artículos destacados

Cómo comprar FLOW

¡Bienvenido a HTX.com! Hemos hecho que comprar Flow (FLOW) sea simple y conveniente. Sigue nuestra guía paso a paso para iniciar tu viaje de criptos.Paso 1: crea tu cuenta HTXUtiliza tu correo electrónico o número de teléfono para registrarte y obtener una cuenta gratuita en HTX. Experimenta un proceso de registro sin complicaciones y desbloquea todas las funciones.Obtener mi cuentaPaso 2: ve a Comprar cripto y elige tu método de pagoTarjeta de crédito/débito: usa tu Visa o Mastercard para comprar Flow (FLOW) al instante.Saldo: utiliza fondos del saldo de tu cuenta HTX para tradear sin problemas.Terceros: hemos agregado métodos de pago populares como Google Pay y Apple Pay para mejorar la comodidad.P2P: tradear directamente con otros usuarios en HTX.Over-the-Counter (OTC): ofrecemos servicios personalizados y tipos de cambio competitivos para los traders.Paso 3: guarda tu Flow (FLOW)Después de comprar tu Flow (FLOW), guárdalo en tu cuenta HTX. Alternativamente, puedes enviarlo a otro lugar mediante transferencia blockchain o utilizarlo para tradear otras criptomonedas.Paso 4: tradear Flow (FLOW)Tradear fácilmente con Flow (FLOW) en HTX's mercado spot. Simplemente accede a tu cuenta, selecciona tu par de trading, ejecuta tus trades y monitorea en tiempo real. Ofrecemos una experiencia fácil de usar tanto para principiantes como para traders experimentados.

264 Vistas totalesPublicado en 2024.12.10Actualizado en 2026.06.02

Cómo comprar FLOW

Discusiones

Bienvenido a la comunidad de HTX. Aquí puedes mantenerte informado sobre los últimos desarrollos de la plataforma y acceder a análisis profesionales del mercado. A continuación se presentan las opiniones de los usuarios sobre el precio de FLOW (FLOW).

活动图片