Bitcoin is About to Choose a Direction, How to Respond Flexibly | Invited Analysis

Odaily星球日报Publicado a 2025-12-29Actualizado a 2025-12-29

Resumen

Odaily featured market analyst Conaldo provides a weekly trading report on Bitcoin (BTC). Last week, the strategy of shorting within the defined resistance zone of $89,500–$91,000 was successfully performed twice, yielding a total return of 3.62%. The core view that the market would experience wide-range volatility was validated, with price action accurately testing the identified support and resistance levels. From a technical perspective, BTC has been in a confirmed medium-term bearish trend since its historic high on October 6th, with a maximum drawdown of approximately 36% over 82 days. However, multiple technical indicators suggest the market is approaching oversold conditions historically associated with bottoms. Since November 22nd, price has consolidated in a low-range, indicating a balance between bullish and bearish forces and a buildup of energy for a directional breakout. A key possibility is presented: if the market is dominated by major players, a strategic move for bears could be to break down below the critical psychological level of $80,000. This would flush out remaining long positions via panic selling, potentially forming a final bottom before a powerful technical rebound. **This Week's Outlook (Dec 29 - Jan 4):** The market is expected to oscillate with a bearish bias, with the core area to watch being **$86,000–$86,500**. * A break below could lead to a test of the **$83,500–$84,500** support zone. * Holding above could extend the current **$86,50...

Odaily Invited Market Analyst Conaldo, Master of Financial Statistics from Columbia University, USA, focused on quantitative trading of US stocks during university and gradually expanded to digital assets such as Bitcoin, constructing a systematic quantitative trading model and risk control system through practical experience; possesses keen data insight into market fluctuations and is committed to continuous development in the professional trading field, pursuing stable returns; will delve into BTC technical, macro, and capital changes weekly, review and showcase practical strategies, and preview major upcoming events for reference.

Trading Weekly Report Core Summary:

  • Strategy Execution (Short-term) Effectiveness Verification: Last week's trading strictly followed the established strategy, successfully completing two operations, achieving a cumulative return of 3.62%.
  • Core View (Short-term) Verification: Our core view proposed last week that "the market will show wide-range fluctuations" has been perfectly verified by the market movement. The defined core observation range of $89,500~$91,000 and the support zone below of $86,500~$87,500 were repeatedly tested. Particularly key, last week's high of $90,598 was only $402 away from the upper edge of our core zone ($91,000); the mid-week pullback low ($86,400) was only $100 away from the lower edge of the support zone ($86,500), and the accuracy of the point prediction has been fully confirmed by the market.
  • From a macro technical perspective, Bitcoin has been correcting for 82 days since hitting its all-time high of $126,200 on October 6, with a maximum decline of about 36%, confirming a medium-term bearish trend. However, observing multiple technical indicators, it has now reached a low area, and both the time and space of the correction are gradually approaching historical common oversold conditions. Since November 22, the price has continued to consolidate in a low range, showing that the forces of long and short are relatively balanced, and the momentum for a directional breakout is accumulating. Although the market's "calls for a rise" are gradually increasing, we believe that, excluding interference from sudden news, there is still one key possibility for the subsequent trend: if the market is dominated by main funds, a better strategy for the bears might be to break down first, piercing the key psychological barrier of $80,000, using panic to clean up the remaining long positions, thus completing the final bottoming. After that, funds can顺势 achieve a "short covering rally," quickly pulling the price away from the cost area, and then start a relatively strong technical rebound. It must be emphasized that the above trend is only a deduction based on market behavior logic, not an inevitable path. No matter how the market evolves, remember: "The market is always right." Before the direction, maintaining observation and flexible response remains the key at this stage.

I. Review of Last Week's Trading Results: (12.22~12.28)

1. Short-term Trading Review (No Leverage):
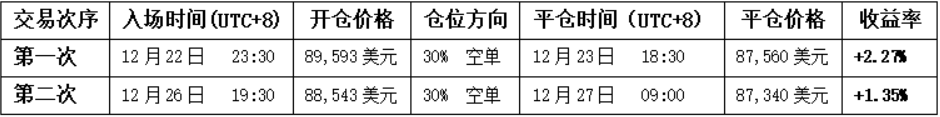
First Trade (Profit 2.27%): Based on the "rebound to core pressure zone encounters resistance and goes short" pattern. When the price冲击 the $89,500~$91,000 zone and encountered resistance,叠加 the spread trading model simultaneously issued a top signal, a 30% short position was established, and finally profit was taken when the price fell near the support zone.

Second Trade (Profit 1.35%): The trading logic is the same as above. When the price冲击 the $89,500~$91,000 zone and encountered resistance,叠加 two models issued共振 signals, successfully completing this trade.

2. Last Week's Trend Prediction and Operation Strategy Review:

The前瞻 analysis last week clearly stated: It is expected that the market will mainly present a wide-range fluctuation pattern. The core observation range is $89,500~$91,000, and the outcome of the struggle in this area will determine the short-term direction. The following is the strategy review and analysis.

1. Market Trend Prediction Review:

• Core Pressure Level: First pressure looks at the $89,500~$91,000 zone; second pressure looks at the $93,000~$94,500 zone.

• Core Support Level: First support looks at the $86,500~$87,500 zone; second support looks at the $83,500~$84,500 zone.

2. Operation Strategy Review:

• Medium-term Strategy: Maintain a medium-term position of about 65% (short positions).

• Short-term Strategy: Last week we initially drafted A/B two sets of short-term operation plans. Combined with the actual market movement, we finally used Plan B as the core strategy and executed it.

(Plan B: Rebound verification, the $89,500~$91,000 core zone has been effectively broken below)

• Open Position: When encountering resistance signals during the rebound verification process, a 30% short position can be established.

• Risk Control: Stop loss set above $92,000.

• Close Position: When the price探 to the $83,500~$84,500 zone shows resistance, consider partially or fully closing the position to take profit.

II. Technical Analysis: Bitcoin Medium-term Trend Judgment

Combining last week's market operation, the author will use a multi-dimensional analysis model to conduct an in-depth analysis of the evolution of Bitcoin's internal structure and trend.

Bitcoin Weekly K-line Chart: (Momentum Quantitative Model + Sentiment Quantitative Model)
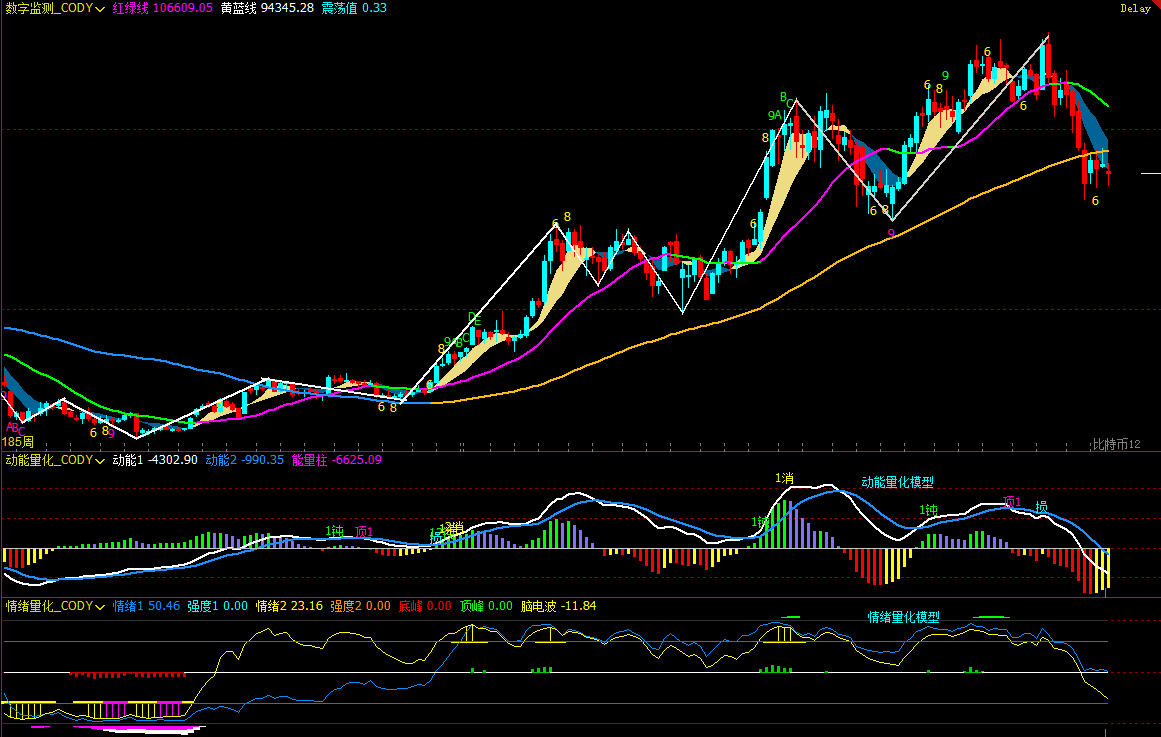
Figure 2

1. As shown in (Figure 2), analysis from the weekly chart:

Momentum Quantitative Model: After last week's adjustment, the two momentum indicator lines are still running below the zero axis, and the negative energy柱 is gradually shortening. This indicates that although the weekly chart has entered a bear market, the bearish momentum has not been fully released.

Momentum Quantitative Model Predicts: Price decline index: High

Sentiment Quantitative Model: Blue sentiment line value 49.74, intensity zero; yellow sentiment line value 19.99 (close to the low threshold), intensity zero, peak value is 0.

Sentiment Quantitative Model Predicts: Price pressure and support index: Neutral

Digital Monitoring Model: The price has broken below the bull-bear (yellow-blue line) dividing line for 6 weeks; short-term bottom digital signal (above 9) has not yet appeared.

The above data预示: Bitcoin's weekly chart has established a bearish trend, be wary of subsequent release of bearish forces.

Bitcoin Daily K-line Chart:
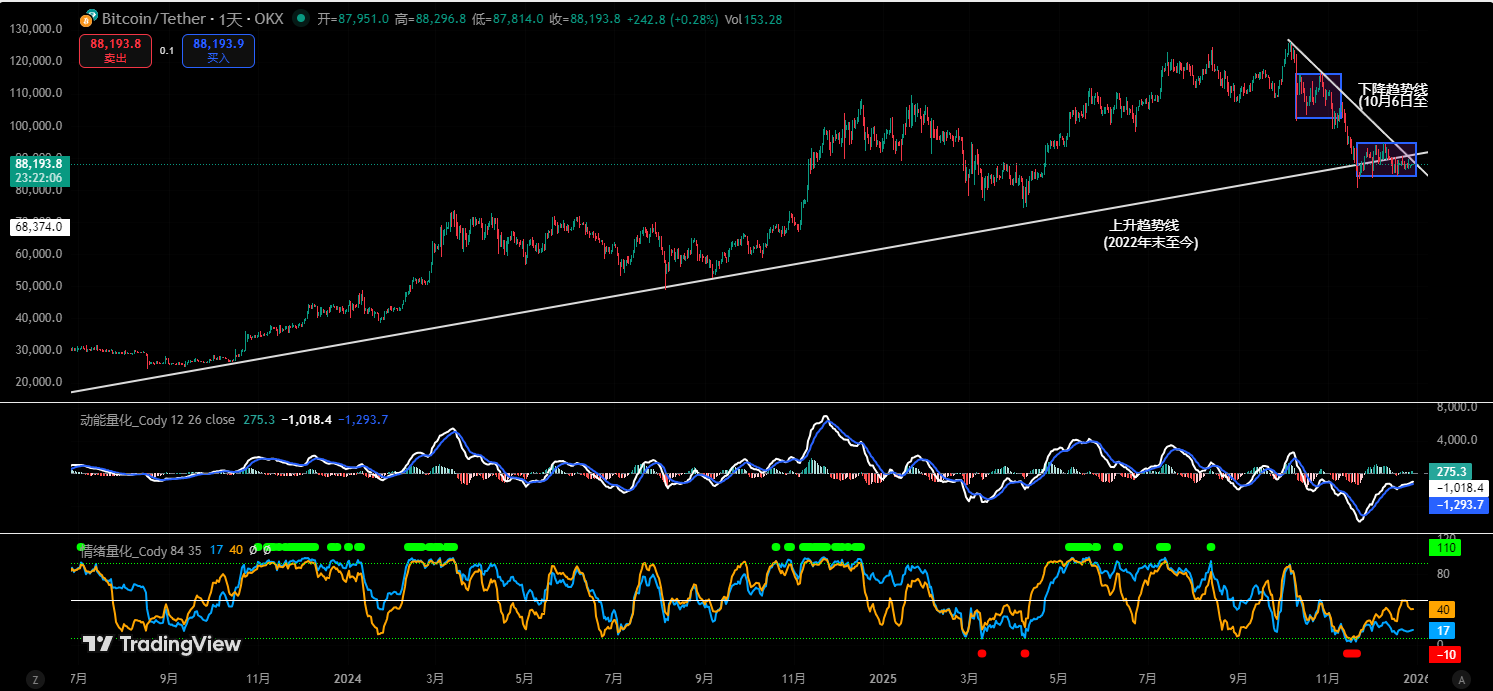
Figure 3

2. As shown in (Figure 3), analysis from the daily chart:

Momentum Quantitative Model: In last week's movement, the two momentum lines were almost粘合 together, slowly rising below the zero axis and gradually approaching the zero axis. Affected by the holiday, daily trading volume continued to萎缩, and the positive energy柱 change was not obvious.

Momentum Quantitative Model Predicts: Buying momentum is weak, the energy柱 has contracted to a "starry" state, indicating a temporary balance between long and short forces.

Sentiment Quantitative Model: After last week's daily close, the blue sentiment line value is 16 (close to the low threshold), intensity zero; yellow sentiment line value is 40, intensity zero.

Sentiment Quantitative Model Predicts: Pressure and support index: Neutral

The above data提示: The daily level is in a bear market, and the short-term market is about to choose a direction.

III. This Week's Bitcoin Market Prediction: (12.29~01.04)

1. It is highly likely that the market will mainly fluctuate and探底 this week, with the core observation range at $86,000~$86,500.

If effectively broken below: The price may continue to探底, testing the support zone below of $83,500~$84,500.

If effectively站稳: The market may延续 the current $86,500~$91,000 range fluctuation pattern.

2. Core Pressure Levels:

• First Pressure Zone: $89,500~$91,000 zone

• Second Pressure Zone: $93,000~$94,500 zone

• Important Pressure Zone: Near $97,000

3. Core Support Levels:

• First Support Level: $86,000~$86,500 zone

• Second Support Level: $83,500~$84,500 zone

• Important Support Level: Near $80,000.

IV. This Week's Bitcoin Operation Strategy (Excluding Sudden News Impact): (12.29~01.04)

1. Medium-term Strategy: Maintain a medium-term position of about 65% (short positions).

2. Short-term Strategy: Use 30% of the position, set stop loss points, and look for "spread" opportunities based on support and pressure levels. (Using 30 minutes as the operation cycle).

3. Focus on observing the struggle between long and short双方 over the $86,000~$86,500 zone. To cope with market evolution, we have drafted A/B two sets of short-term operation plans:

Plan A: If effectively站稳 the $86,000~$86,500 zone:

• Open Position: When the price rebounds to the $89,500~$91,000 zone and shows resistance signals, a 30% short position can be established.

• Risk Control: Short stop loss set above $92,500.

• Close Position: When the price falls to the $86,000~$86,500 zone and shows stabilization signals, close all short positions to take profit.

Plan B: If effectively broken below the $86,000~$86,500 zone:

• Open Position: If the price effectively breaks below, a 30% short position can be established.

• Risk Control: Stop loss set above $88,000.

• Close Position: When the price探 to the $83,500~$84,500 zone shows stabilization signals, gradually close the position to take profit.

V. Special Notes:​​

1. When opening a position: Immediately set the initial stop loss level.

2. When profit reaches 1%: Move the stop loss to the opening cost price (breakeven point), ensuring principal safety.

3. When profit reaches 2%​​: Move the stop loss to the position of 1% profit.

4. Continuous Tracking: Thereafter, for every additional 1% profit the price makes, move the stop loss level同步 by 1%, dynamically protecting and locking in existing profits.

(Note: The above 1% profit trigger threshold can be flexibly adjusted by investors according to their own risk preference and标的 volatility.)

VI. This Week's Key Events前瞻: (12.29~01.04)

1. Fed Meeting Minutes Release "Real Divergence" Signal

Wednesday 03:00, the Fed will release the latest monetary policy meeting minutes. Compared to the interest rate decision itself, the minutes are more critical regarding the degree of divergence among internal members on the "timing, magnitude, and persistence of rate cuts."

If the minutes show increased confidence among officials in the decline of inflation and discuss an earlier or faster easing path, it will strengthen market expectations of "falling real interest rates," constituting a medium-term positive for Bitcoin; conversely, if the minutes emphasize concerns about inflation recurring or financial conditions easing too quickly, it may阶段性 lift the dollar and US bond yields, forming emotional suppression on BTC.

For Bitcoin, this is not a short-term directional signal, but an important node affecting the medium-term fund pricing anchor.

2. Initial Jobless Claims: Thermometer of Liquidity Expectations

Wednesday 21:30, the US will announce the initial jobless claims for the week ending December 27.

The market now pays more attention to "whether the labor market is showing structural cooling" rather than fluctuations in a single data point.

If initial claims持续 above trend levels, it will further verify the economic cooling logic, strengthening market expectations for the continuation of宽松 policies, which is beneficial for the valuation repair of non-yielding assets like Bitcoin; if the data falls again, it may strengthen the judgment that "the economy is still resilient," which is not conducive to the expansion of risk appetite for BTC in the short term.

The impact of this indicator on Bitcoin is mainly reflected in interest rate expectations rather than fundamentals itself.

3. Final Manufacturing PMI Verifies Real Economy Direction

Friday 22:45, the US December S&P Global Manufacturing PMI final value is announced.

As a leading indicator, the PMI will help the market judge whether "soft landing" is still on track.

If the final value confirms that manufacturing is stabilizing or even improving, the overall sentiment of risk assets is expected to be maintained, with limited systematic pressure on BTC; if the PMI is revised down again, it may trigger repricing of economic downturn, short-term bearish for risk assets, but medium to long term may instead strengthen expectations for monetary easing.

Financial markets are changing rapidly, all market analysis and trading strategies need to be dynamically adjusted. All views, analysis models, and operation strategies involved in this article are derived from personal technical analysis, for personal trading log use only, and do not constitute any investment advice or operation basis. The market has risks, investment needs caution, DYOR.

Preguntas relacionadas

QWhat is the analyst's core short-term view on the Bitcoin market as presented in the article?

AThe analyst's core short-term view is that the market is in a state of wide-range consolidation and is about to choose a direction. They emphasize the possibility that major funds might drive a downward break below the $80,000 psychological level to flush out remaining long positions before a potential technical rebound.

QWhat were the key support and resistance levels identified for Bitcoin in the previous week's analysis?

AThe key resistance levels were the first zone at $89,500~$91,000 and the second zone at $93,000~$94,500. The key support levels were the first zone at $86,500~$87,500 and the second zone at $83,500~$84,500.

QAccording to the technical analysis, what is the current state of Bitcoin's medium-term trend based on the weekly chart?

AThe weekly chart analysis confirms that Bitcoin has established a medium-term bearish trend. The momentum量化 model shows indicators below the zero line with negative energy columns shortening, indicating bearish momentum has not been fully released. The sentiment量化 model shows neutral pressure and support indices.

QWhat are the two main short-term trading strategies (Plan A and Plan B) proposed for the upcoming week?

APlan A: If the price holds effectively above the $86,000~$86,500 area, open a 30% short position when the price rebounds to the $89,500~$91,000 resistance zone and shows a rejection signal. Stop loss is set above $92,500. Plan B: If the price effectively breaks below the $86,000~$86,500 area, open a 30% short position. Stop loss is set above $88,000. Take profit when the price falls to the $83,500~$84,500 support zone and shows signs of stabilization.

QWhat key macroeconomic events are highlighted as important for Bitcoin's price movement in the coming week?

AThe key events are: 1. The release of the FOMC Meeting Minutes on Wednesday at 03:00, which could signal internal Fed分歧 on rate cuts. 2. The Weekly Initial Jobless Claims data on Wednesday at 21:30, which acts as a thermometer for liquidity expectations. 3. The S&P Global Manufacturing PMI Final reading on Friday at 22:45, which validates the direction of the real economy.

Lecturas Relacionadas

Anthropic Cries Wolf: Is the AGI Threat Real, or Just an IPO Story?

Anthropic has published an article titled "When AI builds itself," discussing the emerging concept of "recursive self-improvement," where AI begins to actively participate in designing, training, testing, and optimizing its own subsequent versions. The company presents internal data showing that by May 2026, over 80% of code merged into its codebase was written by Claude, its AI model. Claude's capabilities have expanded to handling complex, open-ended engineering tasks, achieving a 76% success rate in such areas, and even contributing to research processes, such as optimizing code performance and conducting AI safety experiments. Anthropic outlines an evolution from human-driven development to AI-assisted workflows, culminating in the current stage where AI agents can autonomously write, run, and delegate code. The company cautions that the path toward a "closed loop," where AI continuously improves itself, is becoming visible. It calls for coordinated global mechanisms to potentially slow or pause frontier AI development to allow safety research and societal structures to catch up. However, the timing of this warning coincides with Anthropic's preparations for an IPO, framing the narrative not just as a safety concern but also as a demonstration of Claude's advanced capabilities and its integral role in accelerating Anthropic's own R&D—creating a potential "flywheel" effect for competitive advantage. This contrasts with OpenAI's recent, more policy-oriented discussion of the same risks, highlighting the competitive dynamics in the AI industry as companies position themselves in both the technological and regulatory landscape.

marsbitHace 41 min(s)

Anthropic Cries Wolf: Is the AGI Threat Real, or Just an IPO Story?

marsbitHace 41 min(s)

BIT Research: ETF Purchases Have Slowed, Strategy (MicroStrategy) Has Slowed, What Else Can Drive Bitcoin's Rise?

Market Refocus on Inflation and Rate Expectations Weighs on Bitcoin Currently, the market is in a phase of macro-repricing dominated by inflation and interest rate expectations. Bitcoin, which previously benefited from easy liquidity and low inflation, is seeing its core bullish drivers weaken. These drivers were market expectations for interest rate cuts and strong inflows from Bitcoin ETFs and institutions like MicroStrategy (referred to as "Strategy" in the text). The logic has shifted. Recent high inflation data (e.g., CPI hitting 3.8% in a May 2026 report) has caused the market to sharply reduce its rate cut expectations for 2025 and even price in potential hikes. This is a key constraint for Bitcoin, as it lacks cash flows and is highly sensitive to rate expectations. Concurrently, institutional capital flows have slowed significantly. Following the hot CPI data, Bitcoin ETFs saw accelerated outflows, with around $4.3 billion leaving over a period. MicroStrategy's ability to keep adding substantial Bitcoin to its balance sheet is also diminishing. Together, ETF and MicroStrategy holdings total roughly $110 billion, but their momentum as growth engines is cooling. In summary, Bitcoin's current pressure stems not from its own fundamentals but from a changing macro environment. As long as inflation stays elevated, Bitcoin is likely to remain in a consolidating phase. However, historically, inflation eventually peaks. Once it recedes and rate cut expectations rebuild, institutional capital could return, potentially fueling a new and more robust recovery phase for Bitcoin.

marsbitHace 49 min(s)

BIT Research: ETF Purchases Have Slowed, Strategy (MicroStrategy) Has Slowed, What Else Can Drive Bitcoin's Rise?

marsbitHace 49 min(s)

Earning 1000 Trillion in Half a Year, 'Pocketing' 20 Million per Capita: This Round of Wealth Creation in the Korean Stock Market is Unprecedented in Scale

The South Korean stock market is experiencing an unprecedented wealth surge in 2026, with household equity and fund asset values soaring by over 1,000 trillion KRW (~$730bn) year-to-date. This translates to an average per capita wealth increase of roughly 20 million KRW, fueled by a historic 109% rally in the KOSPI index. The boom is driven by three converging forces: an AI-driven semiconductor supercycle boosting giants like Samsung and SK Hynix; the government's "Value-Up" market reforms addressing long-standing corporate governance issues; and aggressive real estate regulations that have locked capital within financial markets, preventing profits from flowing back into property. This has triggered a wealth effect, boosting high-end consumption significantly. However, the gains are highly concentrated. The two semiconductor behemoths account for over half the index's value, but retail investors own relatively low stakes in them, systematically missing the biggest rallies. Wealth and consumption benefits are skewed towards luxury goods and imported cars, bypassing mainstream retail. Further risks stem from excessive leverage, with high trading volume in leveraged ETFs, and a market sentiment heavily reliant on the AI sector's fortunes and speculative rumors. While this cycle marks a potential shift from real estate to equities as a primary wealth generator for Koreans, its sustainability, amid structural imbalances and leverage, remains a critical test.

marsbitHace 54 min(s)

Earning 1000 Trillion in Half a Year, 'Pocketing' 20 Million per Capita: This Round of Wealth Creation in the Korean Stock Market is Unprecedented in Scale

marsbitHace 54 min(s)

Behind ZEC's Over 30% Plunge: An 'Unlimited Minting' Vulnerability with No Way to Prove if It Was Ever Exploited

A critical vulnerability was discovered in Zcash's Orchard privacy pool, allowing for the theoretical creation of undetectable counterfeit ZEC. Researcher Taylor Hornby found the flaw on May 29th, 2024, within the Orchard circuit's cryptographic constraints, which could let an attacker bypass asset conservation rules. Although a rapid emergency fix was deployed within days via a coordinated soft and hard fork, a core uncertainty remains: due to Orchard's privacy features, it is impossible to cryptographically prove whether this "unlimited mint" flaw was exploited in the nearly four years since the pool's 2022 launch. This uncertainty, rather than the patched flaw itself, triggered a market panic, causing ZEC's price to drop over 30%. While the Zcash Foundation stated no evidence of exploitation was found, independent entity Shielded Labs emphasized the impossibility of definitively proving no counterfeit ZEC was ever created. The incident highlights the unique trust challenge in privacy systems. To address this, developers are proposing a new network upgrade with enhanced auditing to allow verifiable proof of supply integrity. Notably, the researcher utilized the newly released AI model Claude Opus 4.8 as a tool during the security review, signaling the growing role of advanced AI in uncovering complex cryptographic vulnerabilities.

marsbitHace 57 min(s)

Behind ZEC's Over 30% Plunge: An 'Unlimited Minting' Vulnerability with No Way to Prove if It Was Ever Exploited

marsbitHace 57 min(s)

Trading

Spot
Futuros

Artículos destacados

Cómo comprar BILL

¡Bienvenido a HTX.com! Hemos hecho que comprar Billions Network (BILL) sea simple y conveniente. Sigue nuestra guía paso a paso para iniciar tu viaje de criptos.Paso 1: crea tu cuenta HTXUtiliza tu correo electrónico o número de teléfono para registrarte y obtener una cuenta gratuita en HTX. Experimenta un proceso de registro sin complicaciones y desbloquea todas las funciones.Obtener mi cuentaPaso 2: ve a Comprar cripto y elige tu método de pagoTarjeta de crédito/débito: usa tu Visa o Mastercard para comprar Billions Network (BILL) al instante.Saldo: utiliza fondos del saldo de tu cuenta HTX para tradear sin problemas.Terceros: hemos agregado métodos de pago populares como Google Pay y Apple Pay para mejorar la comodidad.P2P: tradear directamente con otros usuarios en HTX.Over-the-Counter (OTC): ofrecemos servicios personalizados y tipos de cambio competitivos para los traders.Paso 3: guarda tu Billions Network (BILL)Después de comprar tu Billions Network (BILL), guárdalo en tu cuenta HTX. Alternativamente, puedes enviarlo a otro lugar mediante transferencia blockchain o utilizarlo para tradear otras criptomonedas.Paso 4: tradear Billions Network (BILL)Tradear fácilmente con Billions Network (BILL) en HTX's mercado spot. Simplemente accede a tu cuenta, selecciona tu par de trading, ejecuta tus trades y monitorea en tiempo real. Ofrecemos una experiencia fácil de usar tanto para principiantes como para traders experimentados.

233 Vistas totalesPublicado en 2026.05.07Actualizado en 2026.06.02

Cómo comprar BILL

Qué es ATWO

I. Introducción al ProyectoArena Two es una plataforma interactiva descentralizada que permite a los fanáticos jugar un papel activo y tokenizado en los resultados de eventos en tiempo real. A diferencia de los modelos de transmisión tradicionales que reducen a los fanáticos a espectadores pasivos, Arena Two aprovecha la tecnología blockchain para permitir que los fanáticos voten directamente en tiempo real e influyan en los resultados en el campo.II. Información del TokenNombre del token: ATWO (Arena Two)III. Enlaces RelacionadosSitio web: https://arenatwo.com/Exploradores: https://basescan.org/token/0x499D35eBE6cEe9B2Ac35Fd003fcBbeeB9CFc7B32Twitter: https://x.com/arenatwoXNota: La introducción del proyecto proviene de los materiales publicados o proporcionados por el equipo oficial del proyecto, que es solo para referencia y no constituye asesoramiento de inversión. HTX no se hace responsable de ninguna pérdida directa o indirecta resultante.

142 Vistas totalesPublicado en 2026.05.18Actualizado en 2026.06.02

Qué es ATWO

Cómo comprar ATWO

¡Bienvenido a HTX.com! Hemos hecho que comprar Arena Two (ATWO) sea simple y conveniente. Sigue nuestra guía paso a paso para iniciar tu viaje de criptos.Paso 1: crea tu cuenta HTXUtiliza tu correo electrónico o número de teléfono para registrarte y obtener una cuenta gratuita en HTX. Experimenta un proceso de registro sin complicaciones y desbloquea todas las funciones.Obtener mi cuentaPaso 2: ve a Comprar cripto y elige tu método de pagoTarjeta de crédito/débito: usa tu Visa o Mastercard para comprar Arena Two (ATWO) al instante.Saldo: utiliza fondos del saldo de tu cuenta HTX para tradear sin problemas.Terceros: hemos agregado métodos de pago populares como Google Pay y Apple Pay para mejorar la comodidad.P2P: tradear directamente con otros usuarios en HTX.Over-the-Counter (OTC): ofrecemos servicios personalizados y tipos de cambio competitivos para los traders.Paso 3: guarda tu Arena Two (ATWO)Después de comprar tu Arena Two (ATWO), guárdalo en tu cuenta HTX. Alternativamente, puedes enviarlo a otro lugar mediante transferencia blockchain o utilizarlo para tradear otras criptomonedas.Paso 4: tradear Arena Two (ATWO)Tradear fácilmente con Arena Two (ATWO) en HTX's mercado spot. Simplemente accede a tu cuenta, selecciona tu par de trading, ejecuta tus trades y monitorea en tiempo real. Ofrecemos una experiencia fácil de usar tanto para principiantes como para traders experimentados.

186 Vistas totalesPublicado en 2026.05.18Actualizado en 2026.06.02

Cómo comprar ATWO

Discusiones

Bienvenido a la comunidad de HTX. Aquí puedes mantenerte informado sobre los últimos desarrollos de la plataforma y acceder a análisis profesionales del mercado. A continuación se presentan las opiniones de los usuarios sobre el precio de A (A).

活动图片