Attack on MM 2: Market Maker Order Book and Order Flow

深潮Publicado a 2025-12-28Actualizado a 2025-12-28

Resumen

"Attack of the MM 2: Market Maker Order Books and Order Flow" by Dave explores the dynamics of market making in crypto, focusing on the Limit Order Book (LOB) and order flow. The LOB is the market maker's battlefield, defined by depth, tick size, and the concept of price improvement—providing better prices than the current best bid/ask to create market value. Market makers profit from the bid-ask spread, which covers order processing costs, inventory risk (holding assets amid price fluctuations), and adverse selection risk (being exploited by informed "toxic" traders). The spread types include quoted, effective, and realized spread, with the latter factoring in future mid-prices to measure true profitability. Order flow involves managing incoming trades, with a focus on identifying "toxic flow" from informed traders who can cause losses. Market makers use metrics like VPIN (Volume-weighted Probability of Informed Trading) to detect one-sided pressure and respond by pulling quotes, widening spreads, or reducing order sizes to mitigate risk. The article hints at deeper institutional strategies in future installments.

Author: Dave

Why do I always have bad luck shortly after buying altcoins? Why couldn't the seemingly invincible market makers handle the sell orders on 10/11?

Why did every market maker I talked to after 10/11 casually say they didn't lose much / even made money that day? This article will introduce you to the market maker's order book and order flow.

1. Limit Order Book (LOB)

The market maker's battlefield is not the candlestick chart, but the LOB.

Core concepts:

  • Depth: The volume of orders at each price level.

  • Tick Size: The minimum unit of price movement. In a high-frequency environment, tick size is crucial for queuing strategies.

  • Price Improvement: When you provide a price better than the current National Best Bid and Offer (NBBO), you create value for the market.

For example, if the current BTC bid is 100k and the ask is 110k, if you offer a price of 101k, you narrow the spread and create value for the market.

While writing this article, I was thinking about how to explain this section to you all. Later, I felt that nothing would be clearer than showing a real order book. Let me do a little promotion for a friend at BG. Using BGB as an example:

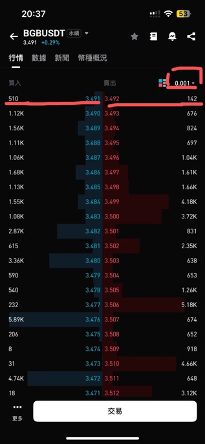
The above is the BGB order book at the minimum tick size. We see the minimum is 0.001. The current depth is only a little over $1000, the spread is controlled to be very small, hitting the minimum tick size. Simultaneously, the depth is distributed in a "Christmas tree" shape—the further from the spread, the larger the order size. However, when we increase the tick size a bit, we find that the depth should be distributed in a horn shape: the closer to the spread, the larger the order size and the more liquidity; the further away, the fewer the orders (one of the reasons for the liquidity vacuum on 10/11).

Speaking of Christmas trees, this article's scheduled release time is 12.24, Christmas Eve. Merry Christmas to everyone!

2. Market Maker Profit Source: Spread

The spread is not just profit; it is primarily composed of three costs:

  1. Order Processing Cost: Exchange fees, hardware latency, manpower.

  2. Inventory Risk: The risk of price moving against you while holding a position, which we covered in the previous episode.

  3. Adverse Selection Cost: This is the core—when you trade, the counterparty might have information you don't. This means you might get tricked by an insider.

  4. There are also three types of spreads: Quoted Spread, Effective Spread, and Realized Spread. The Quoted Spread is the easiest to understand: the ask-bid difference. The Realized Spread measures the actual profit the market maker keeps after price adjustments: 2 x (P_trade – P_futuremid), which includes the future mid-price, somewhat like considering opportunity cost.

3. Order Flow

Order flow is the stream of orders received by the market maker. This is a deep topic. Market makers perform various operations on order flow, such as hedging, matching, adjusting quotes, etc., in order to manage their book (ledger?). This involves many professional concepts and operational techniques, and can even involve legal issues, such as agency trades not being able to be counterparties to principal trades due to conflict of interest. This article will only introduce the concepts of Order Flow Toxicity and VPIN. If any MM boss hires me, I'll update my followers on professional order flow management.

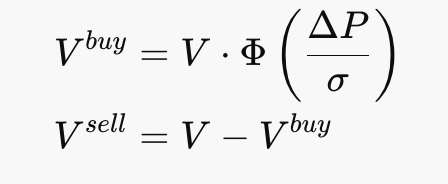
Toxic Flow refers to orders from informed traders who know the price is about to move, thus causing realized spread losses because they know P_futuremid through insider information. So, as market makers, we also need to be careful not to be tricked by toxic insiders.

Noise/Retail Flow comes from retail investors or funds passively adjusting their weights. This is the market maker's favorite "food".

To protect themselves, market makers' anti-toxicity mechanisms adjust quotes. A simple way to prevent "toxicity" is to assume all aggressive orders are toxic. Assuming a buy order, the MM immediately lowers the reservation price, shifting the entire quote down. This also answers the question left in the previous chapter: why do we always buy at the high? Because market makers adjust their quotes for risk control. But the smart you will surely ask another question: what if an insider buys a large amount? What if they rely on their information advantage and stubbornly impact the spread head-on? Yes, this might be what happened on 10/11, and it's also the reason why a large MM with billions in assets couldn't hold the line.

Core metric: VPIN (Volume-weighted Probability of Informed Trading).

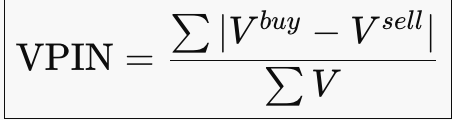
VPIN ≈ The probability that the market maker is currently being "continuously hit by one-sided flow" in the market. When significant one-sided pressure appears, MM inventory accumulates one-sidedly, and the mean reversion assumption fails. At this time, the MM will pull quotes (withdraw orders), temporarily stopping providing liquidity to wait for the order flow to return to symmetry. But what if the order flow doesn't return to symmetry? Or if the order flow deviation is too extreme and directly causes a blow-up? This is the 10/11 disaster. I'm thinking about doing an episode on how exchanges made money on 10/11. We'll see.

Back on topic, after a VPIN anomaly, MMs will pull quotes (withdraw orders) or widen the spread (to earn more service fees to compensate for price losses), and also reduce size to control the speed of inventory accumulation.

This episode is the end of the first part of our market maker story. From a retail perspective, the truth behind the legendary market manipulation by "whales" has been revealed. Next, I will introduce some more "institutional" topics from the MM's perspective. Hold on tight.

Anime episodes often end with a preview for the next episode, so let's do one for this article: If we entered the world of Jujutsu Kaisen, and order flow is "cursed energy," and quote operations are "cursed techniques," then in the next part, we will look at the "Domain Expansion" in market making.

To find out what happens next, stay tuned for the next episode.

Preguntas relacionadas

QWhat is the three main components that constitute the bid-ask spread for a market maker?

AThe bid-ask spread is primarily composed of three costs: Order Processing costs (exchange fees, hardware latency, manpower), Inventory Risk (the risk of holding a position while the price moves against you), and Adverse Selection cost (the risk of trading against an informed, or 'toxic', trader who has superior information).

QWhat is 'Order Flow Toxicity' and how do market makers typically protect themselves from it?

A'Order Flow Toxicity' refers to orders coming from informed traders who know the price is about to move, causing losses for the market maker. To protect themselves, market makers employ anti-toxicity mechanisms such as adjusting their reservation price (e.g., lowering quotes after a buy order), pulling their quotes (withdrawing liquidity), widening the spread, or reducing order size to control inventory accumulation.

QWhat does the VPIN metric measure and what action does a high VPIN value trigger for a market maker?

AVPIN (Volume-weighted Probability of Informed Trading) approximates the probability that a market maker is being hit by persistent one-sided order flow from informed traders. A high or abnormal VPIN value triggers risk management actions such as pulling quotes (withdrawing liquidity temporarily), widening the bid-ask spread, or reducing order size to manage the speed of inventory accumulation.

QAccording to the article, what is the key difference between 'Quoted Spread' and 'Realized Spread'?

AThe Quoted Spread is the simple difference between the best ask and bid prices (ask - bid). The Realized Spread is a more advanced metric that measures the profit a market maker actually keeps after price adjustments, calculated as 2 x (P_trade – P_futuremid), and it incorporates the future mid-price, resembling an opportunity cost.

QIn the context of a Limit Order Book (LOB), what is 'Price Improvement' and how is it created?

A'Price Improvement' occurs when a market participant provides a price that is better than the current best available price (the NBBO - National Best Bid and Offer). For example, if the best bid is 100,000 and the best ask is 110,000, a trader who places a bid at 101,000 provides price improvement by narrowing the spread, thus creating value for the market.

Lecturas Relacionadas

US Stocks Hit Record Highs: Why Isn't the Market Afraid of the Flames of War?

U.S. stocks hit a record high on April 15, with the S&P 500 closing at 7,022.95, just 77 days after its previous peak. This rebound occurred in only 11 trading days—far faster than recoveries following past crises like the COVID-19 pandemic (103 days) or the 2011 debt crisis (106 days). The market's rapid recovery is attributed to "ceasefire expectations" rather than deteriorating economic fundamentals. During the sell-off triggered by the U.S.-Israel military action against Iran in late February, the S&P 500 fell nearly 10%. However, the market rallied twice on ceasefire rumors—first on March 24 and again on April 8—even before any permanent peace deal was signed. Notably, the VIX fear index fell below pre-war levels, indicating that the market had repriced the conflict from an uncertainty to a calculable risk. Major financial institutions like JPMorgan reported record trading revenues of $11.6 billion in Q1 2026, largely driven by volatility in commodities and emerging markets. Hedge funds turned net long for the first time since late 2025, while margin debt hit a record $1.28 trillion. This reflects a financial system that commercializes volatility, treating geopolitical shocks as tradable opportunities rather than systemic threats. However, the current optimism relies on assumptions of a sustained ceasefire and stable oil prices, leaving the market vulnerable if these conditions change.

marsbitHace 27 min(s)

US Stocks Hit Record Highs: Why Isn't the Market Afraid of the Flames of War?

marsbitHace 27 min(s)

Is the Rebound an Illusion? The Bond Market Has Already Given the Answer

Is the stock market's rapid rebound to pre-war levels a sign of recovery or a misleading rally driven by momentum rather than fundamentals? While the S&P 500 has fully recovered its losses from the U.S.-Iran conflict and nears all-time highs, bond and oil markets tell a different story. Key data reveals contradictions: 10-year Treasury yields have risen 30 basis points, signaling persistent inflation concerns and constrained Fed policy space. WTI crude is up 37%, indicating that geopolitical risks are not priced to resolve soon. The 2-year Treasury yield, a sensitive gauge of rate expectations, has increased nearly 40 bps, challenging the narrative of imminent Fed rate cuts. The equity market appears to be pricing in a "perfect scenario": subdued oil impact on consumption, Fed rate cuts despite hot inflation, stable corporate margins, and near-term conflict resolution. However, bonds and oil reflect a reality of sticky inflation, limited Fed flexibility, and ongoing geopolitical tension. This divergence suggests the rally may be momentum-driven rather than fundamentally justified. If upcoming CPI data exceeds expectations (e.g., above 3.5%), the 2026 rate-cut narrative could collapse. Investors chasing the rally are betting on an ideal outcome—swift conflict resolution, controlled inflation, Fed easing, and resilient earnings—while ignoring signals from more cautious asset classes. The gap will likely close either through a fundamental improvement validating stocks or a market correction aligning with bond and oil realities.

marsbitHace 35 min(s)

Is the Rebound an Illusion? The Bond Market Has Already Given the Answer

marsbitHace 35 min(s)

Trading

Spot
Futuros

Artículos destacados

Cómo comprar FLOW

¡Bienvenido a HTX.com! Hemos hecho que comprar Flow (FLOW) sea simple y conveniente. Sigue nuestra guía paso a paso para iniciar tu viaje de criptos.Paso 1: crea tu cuenta HTXUtiliza tu correo electrónico o número de teléfono para registrarte y obtener una cuenta gratuita en HTX. Experimenta un proceso de registro sin complicaciones y desbloquea todas las funciones.Obtener mi cuentaPaso 2: ve a Comprar cripto y elige tu método de pagoTarjeta de crédito/débito: usa tu Visa o Mastercard para comprar Flow (FLOW) al instante.Saldo: utiliza fondos del saldo de tu cuenta HTX para tradear sin problemas.Terceros: hemos agregado métodos de pago populares como Google Pay y Apple Pay para mejorar la comodidad.P2P: tradear directamente con otros usuarios en HTX.Over-the-Counter (OTC): ofrecemos servicios personalizados y tipos de cambio competitivos para los traders.Paso 3: guarda tu Flow (FLOW)Después de comprar tu Flow (FLOW), guárdalo en tu cuenta HTX. Alternativamente, puedes enviarlo a otro lugar mediante transferencia blockchain o utilizarlo para tradear otras criptomonedas.Paso 4: tradear Flow (FLOW)Tradear fácilmente con Flow (FLOW) en HTX's mercado spot. Simplemente accede a tu cuenta, selecciona tu par de trading, ejecuta tus trades y monitorea en tiempo real. Ofrecemos una experiencia fácil de usar tanto para principiantes como para traders experimentados.

175 Vistas totalesPublicado en 2024.12.10Actualizado en 2025.03.21

Cómo comprar FLOW

Discusiones

Bienvenido a la comunidad de HTX. Aquí puedes mantenerte informado sobre los últimos desarrollos de la plataforma y acceder a análisis profesionales del mercado. A continuación se presentan las opiniones de los usuarios sobre el precio de FLOW (FLOW).

活动图片