US Stocks Hit Record Highs: Why Isn't the Market Afraid of the Flames of War?

marsbitPublicado a 2026-04-16Actualizado a 2026-04-16

Resumen

U.S. stocks hit a record high on April 15, with the S&P 500 closing at 7,022.95, just 77 days after its previous peak. This rebound occurred in only 11 trading days—far faster than recoveries following past crises like the COVID-19 pandemic (103 days) or the 2011 debt crisis (106 days). The market's rapid recovery is attributed to "ceasefire expectations" rather than deteriorating economic fundamentals. During the sell-off triggered by the U.S.-Israel military action against Iran in late February, the S&P 500 fell nearly 10%. However, the market rallied twice on ceasefire rumors—first on March 24 and again on April 8—even before any permanent peace deal was signed. Notably, the VIX fear index fell below pre-war levels, indicating that the market had repriced the conflict from an uncertainty to a calculable risk. Major financial institutions like JPMorgan reported record trading revenues of $11.6 billion in Q1 2026, largely driven by volatility in commodities and emerging markets. Hedge funds turned net long for the first time since late 2025, while margin debt hit a record $1.28 trillion. This reflects a financial system that commercializes volatility, treating geopolitical shocks as tradable opportunities rather than systemic threats. However, the current optimism relies on assumptions of a sustained ceasefire and stable oil prices, leaving the market vulnerable if these conditions change.

On April 15, the S&P 500 closed at 7,022.95 points, exactly 77 days after it last hit a record high. In those 77 days, the U.S. fought a war, oil prices broke above $100, and the stock market experienced its fastest 10% correction in five years. Then, it returned to a new high in about 11 trading days.

This number is worth pausing to think about. 11 trading days—this is an impossible speed in U.S. history following every crisis of a similar scale.

What 11 Trading Days Mean in History

Where does the speed of this recovery stand in the historical context?

According to a PBS report, JPMorgan strategists called this rebound "the fastest since the COVID-19 pandemic." Looking at the historical numbers, this statement is not an exaggeration.

During the COVID-19 pandemic in 2020, the market took about 103 trading days to rebound from the low on March 23 to a new high on August 18. During the Gulf War in 1990, it took about 87 trading days from the low at the end of October to return to the previous high in February 1991. During the U.S. debt crisis in 2011, it took about 106 trading days from the low in October of that year to a new high in March 2012.

This recovery from the 2026 Iran War: 11 trading days.
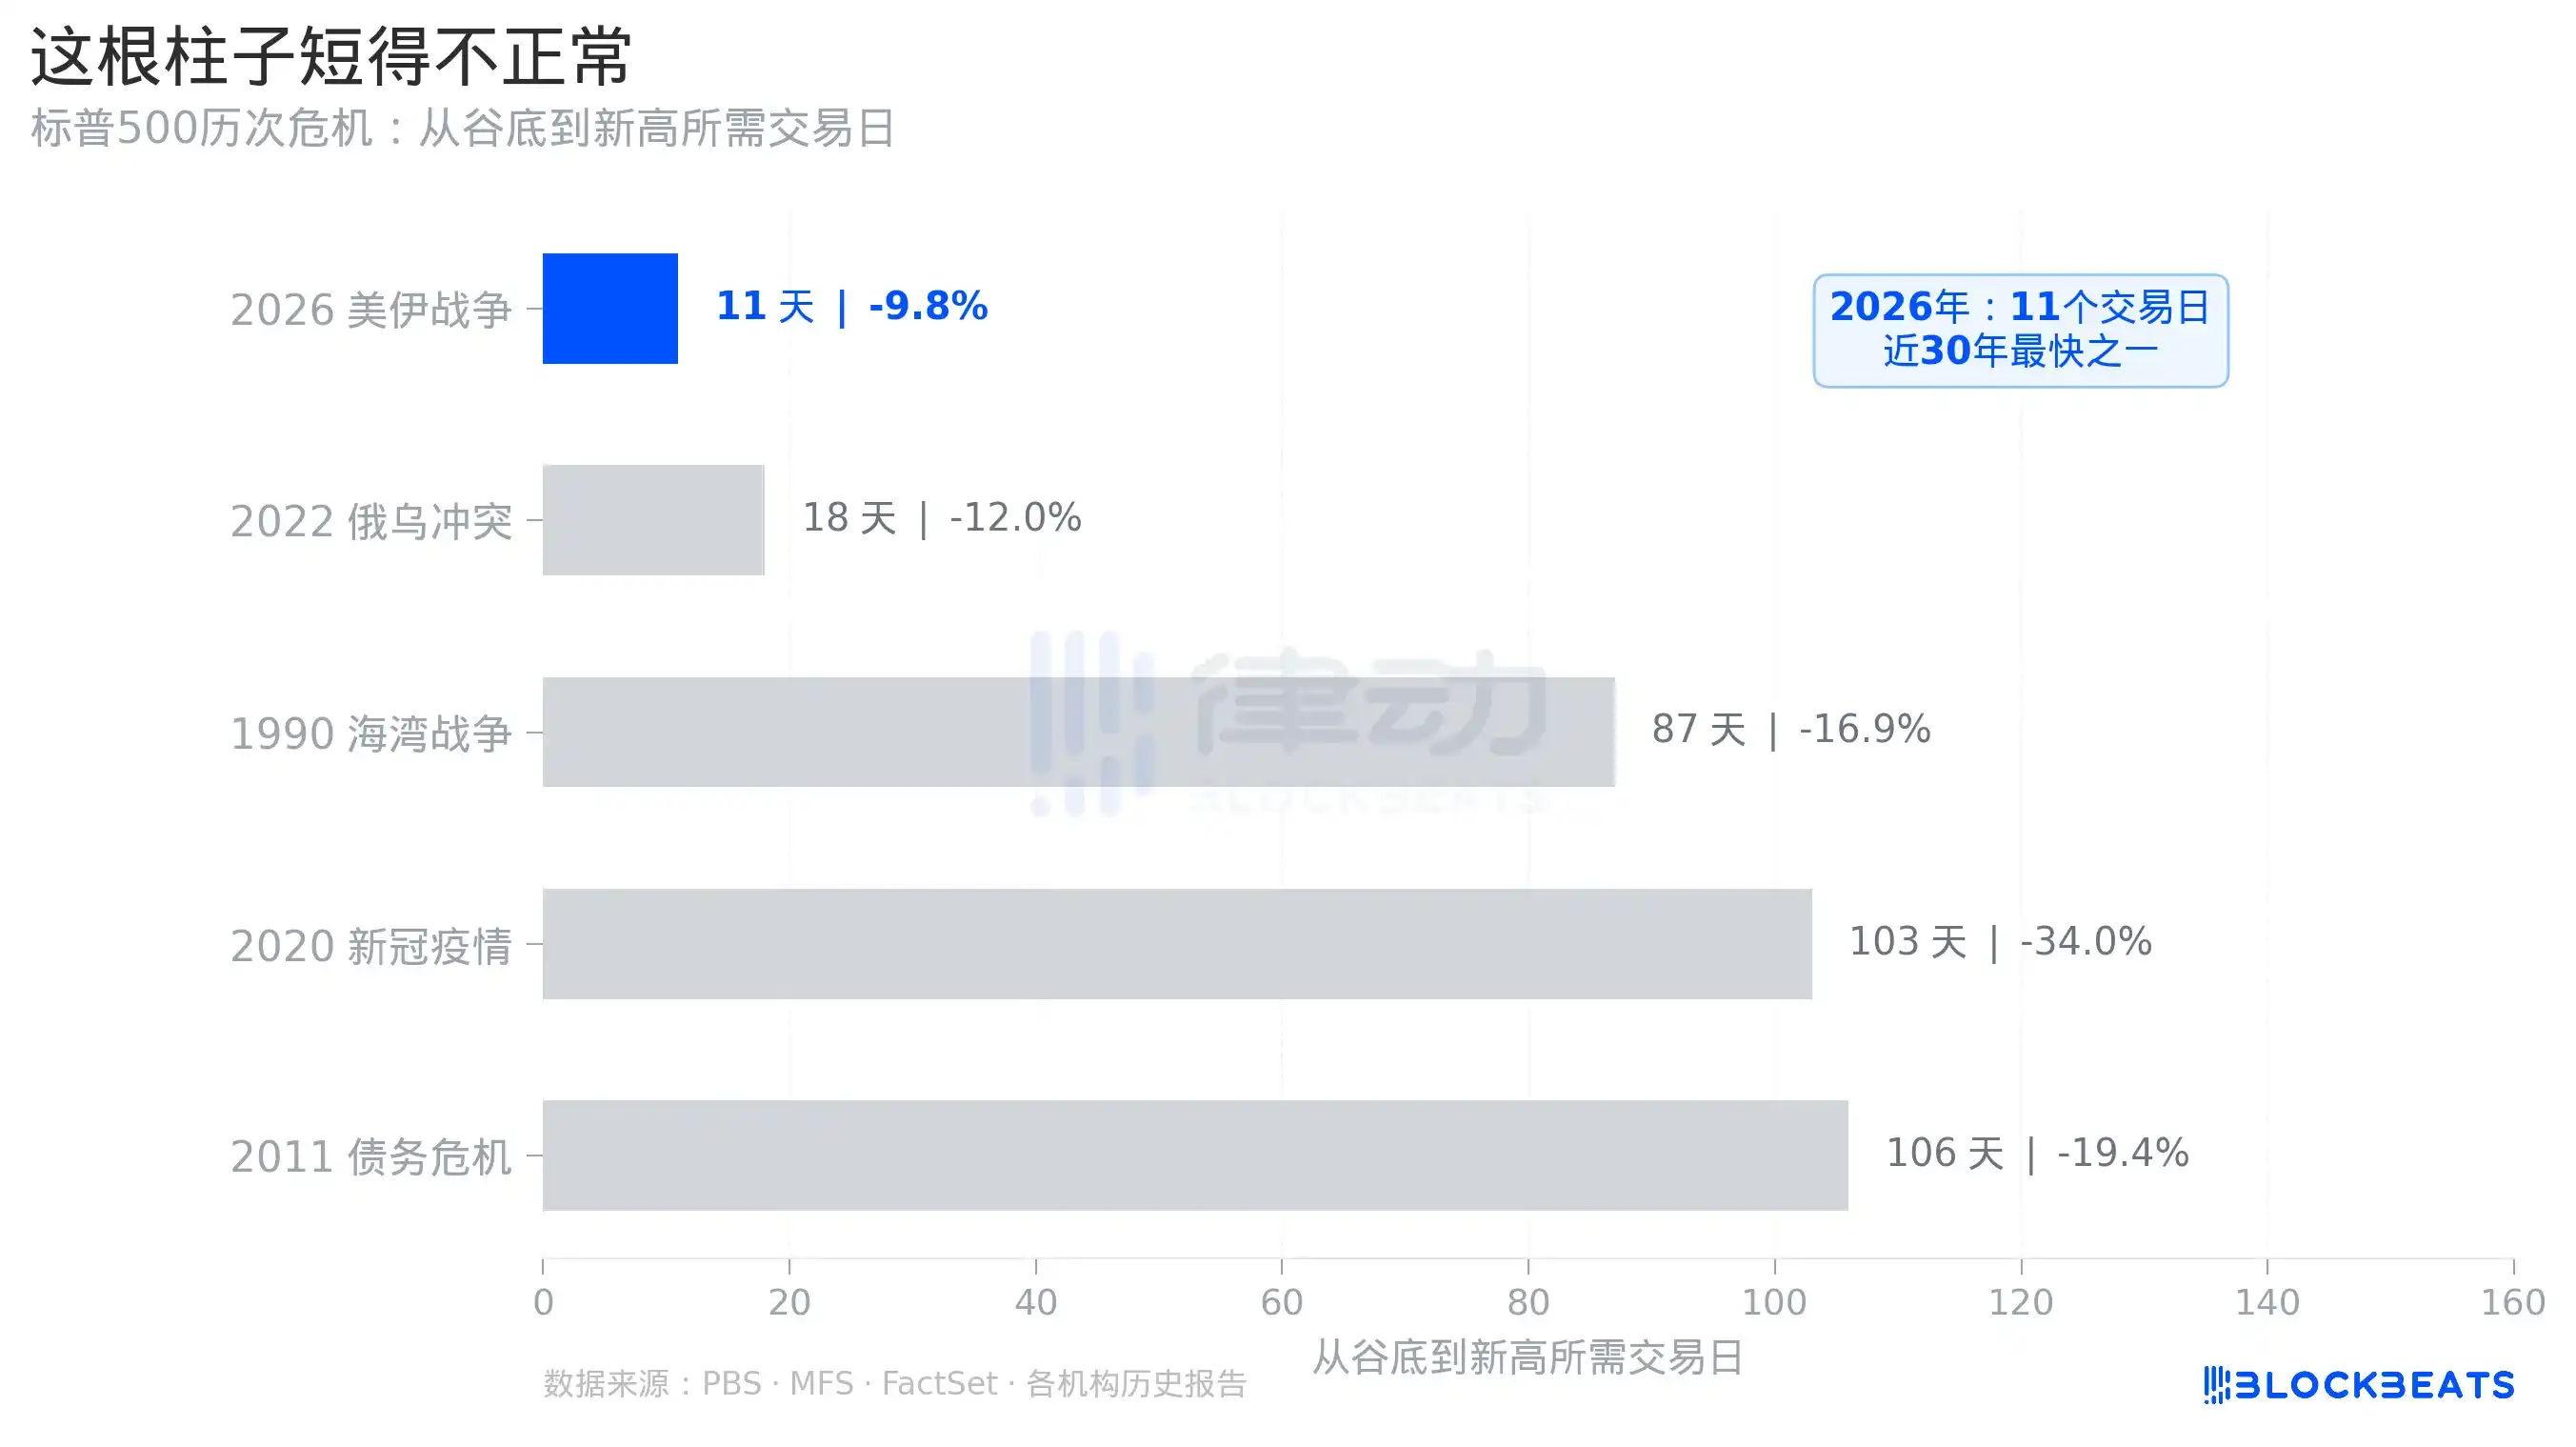
It should be noted that the magnitude of this correction (about 10%) was much smaller than during the COVID-19 period (about 34%) and 2011 (about 19%). But even compared to the 2022 Russia-Ukraine conflict, which had a similar decline, that recovery took about 18 trading days. Eleven days is still an outlier.

The narrative of this correction has always been "ceasefire expectations," not "deteriorating economic fundamentals." The market fell due to uncertainty, not profits. When ceasefire news actually emerged, the uncertainty pricing was quickly erased, without waiting for quarterly reports to rebuild confidence.

The Word "Ceasefire" Drove the Rally—Twice

To understand the speed of this recovery, it’s necessary to first clarify the news timeline.

On February 28, the U.S. and Israel launched military strikes against Iran. The S&P 500 began falling from its previous high of 7,002 points on January 28, dropping to 6,316 points by March 30, a maximum drop of nearly 10%. By Wall Street's definition, this was right on the edge of a "correction."

But during this decline, something strange happened. On March 24, rumors about the "possible unblocking of the Strait of Hormuz" circulated in the market, and the S&P rebounded that day. This was the first "ceasefire pricing." The rumors were later disproven, and the market continued to fall.

On April 8, Trump announced a two-week temporary ceasefire on social media, and Iran also accepted Pakistan's mediation proposal. The S&P 500 surged 2.5% in a single day. This was the second "ceasefire pricing," at a higher price, for almost exactly the same reason.
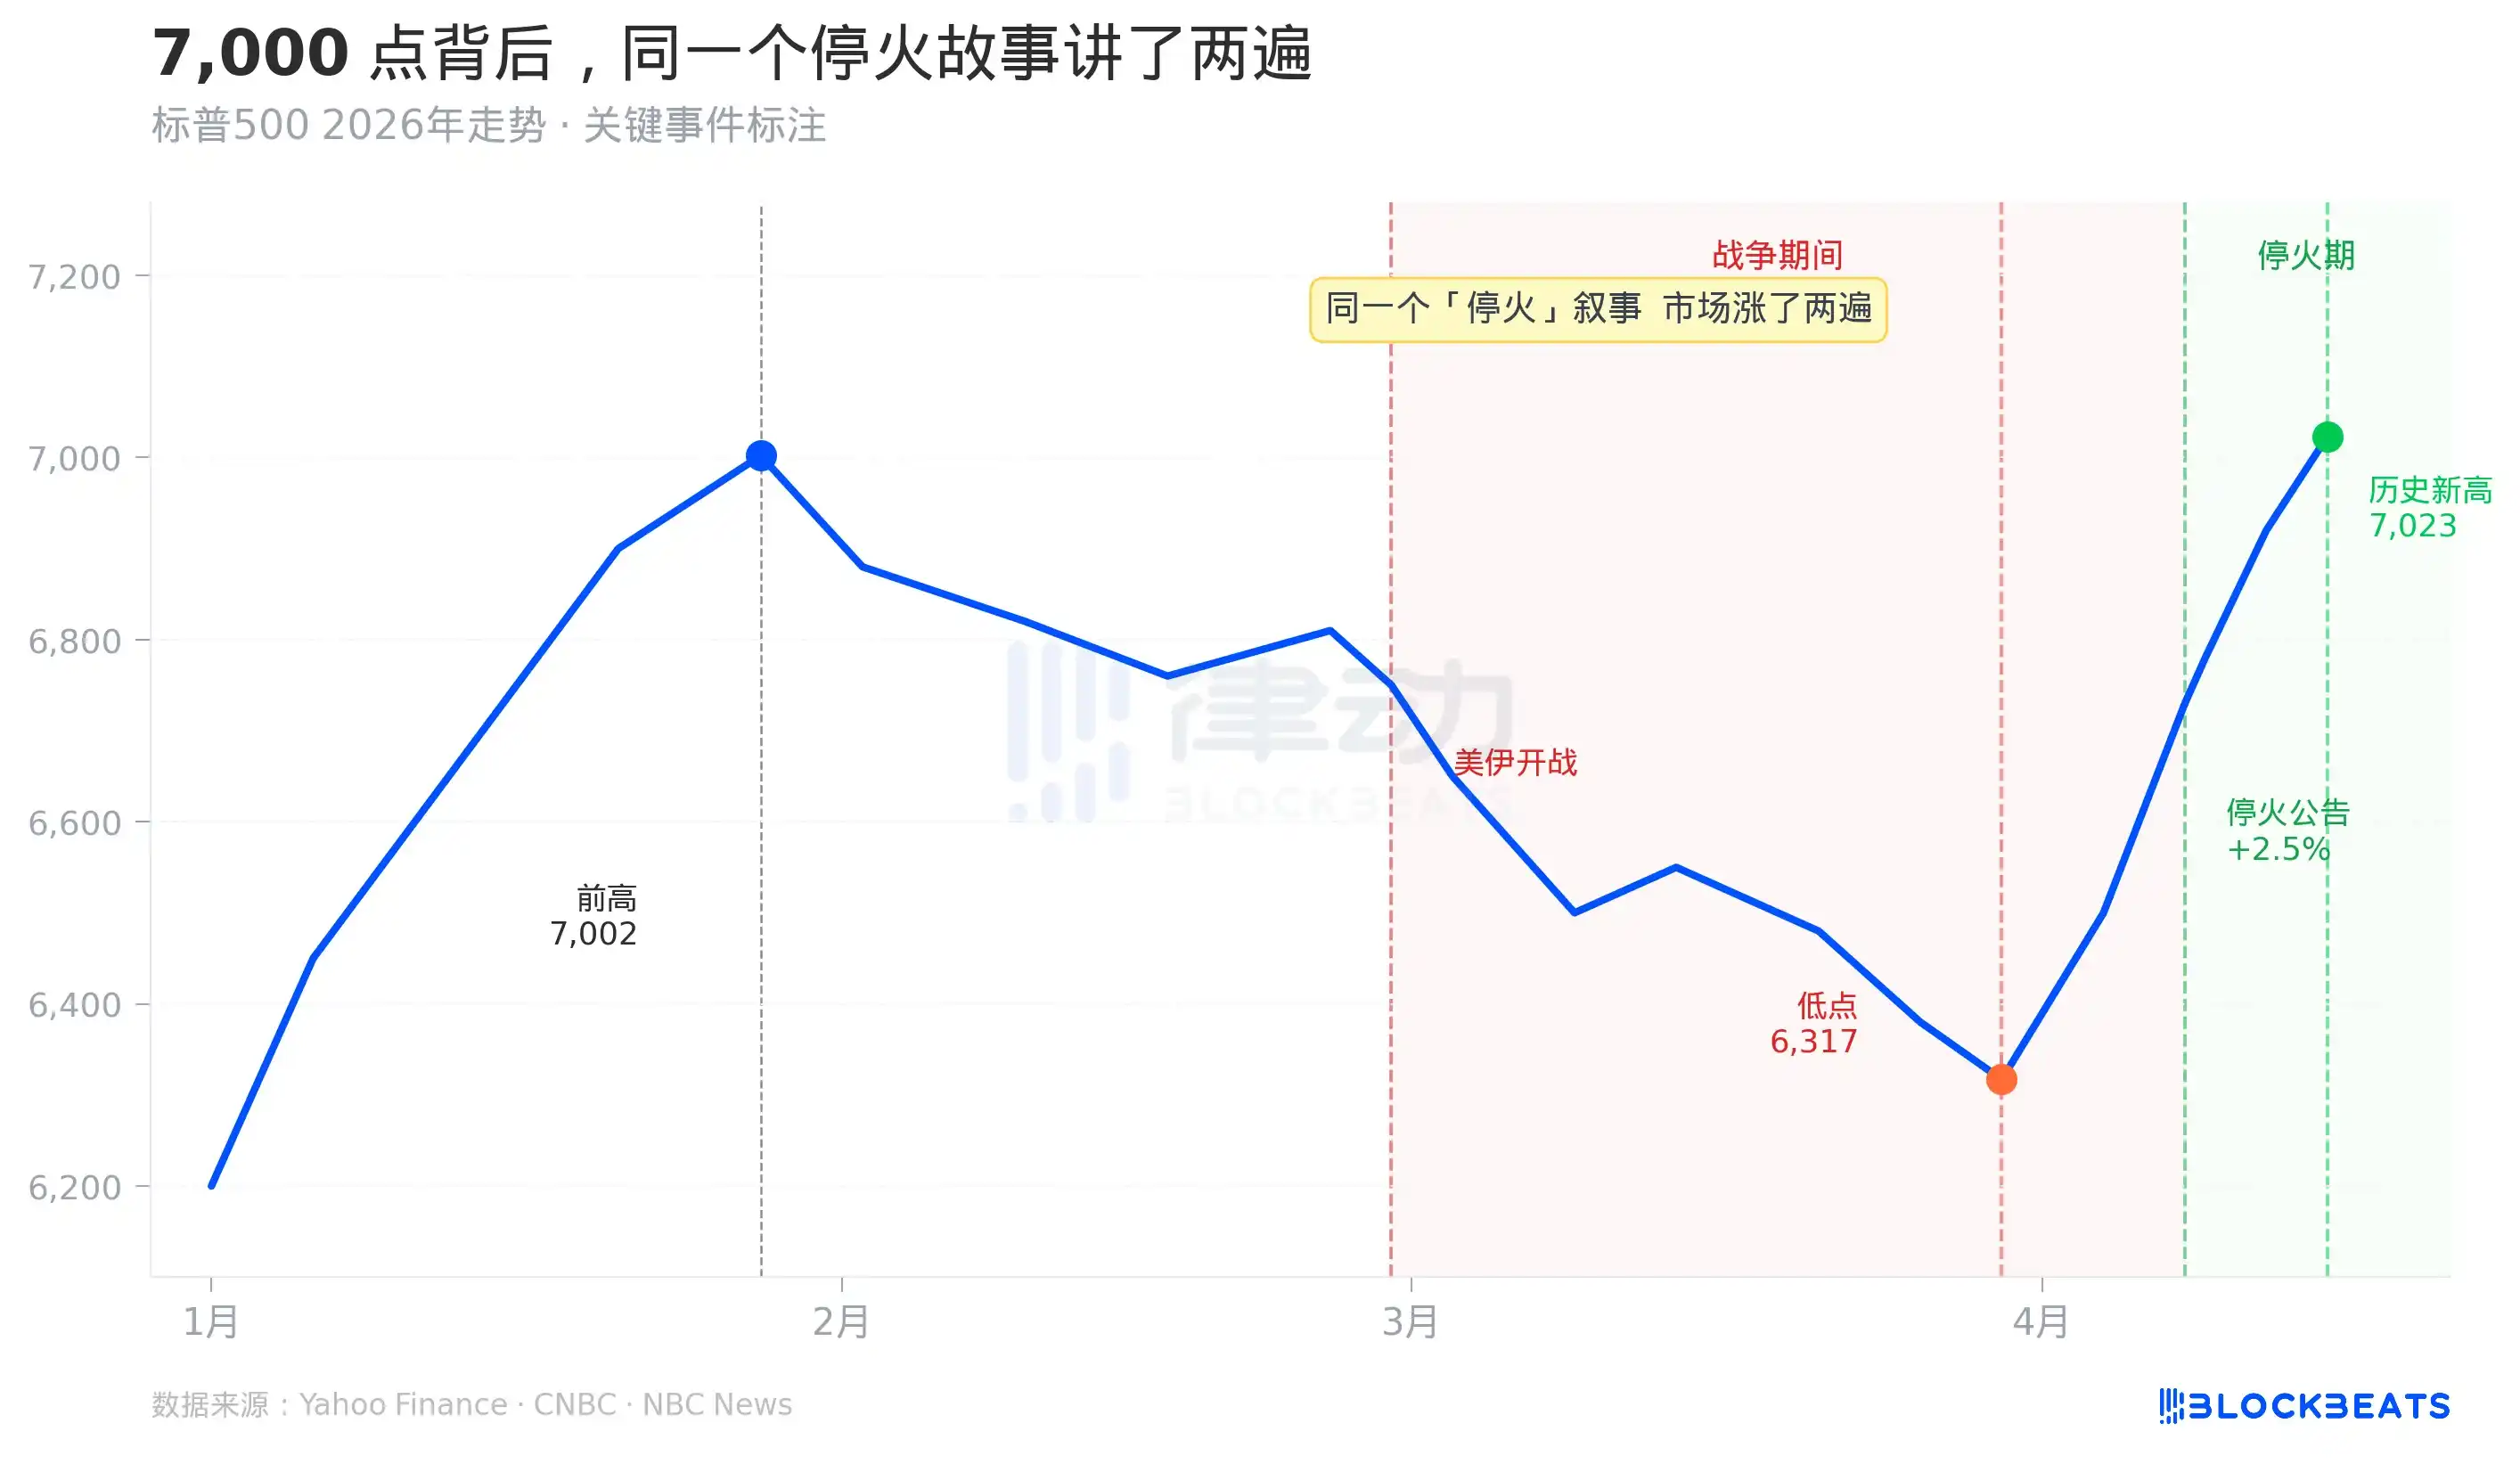
As shown in Chart 1, the two sharp rallies correspond to symmetrical event annotations, both labeled "increased possibility of ceasefire." It rose the first time, and then rose again the second time. As of April 15, when the new record high was set, the two-week temporary ceasefire agreement had not yet expired, and not a word of a permanent peace agreement had been signed.

What scenario is the market pricing in? Not "the end of the war," but "the possibility that the war could end." This expectation was priced—twice.

The Fear Index Is Lower Than Before the War

Even more counterintuitive is the number for the VIX, the index Wall Street uses to measure market panic.

When the war started on February 28, the VIX jumped from around 16 to touch 35.3 intraday on March 9. This aligns with common sense: war is a risk, and the market prices in uncertainty.
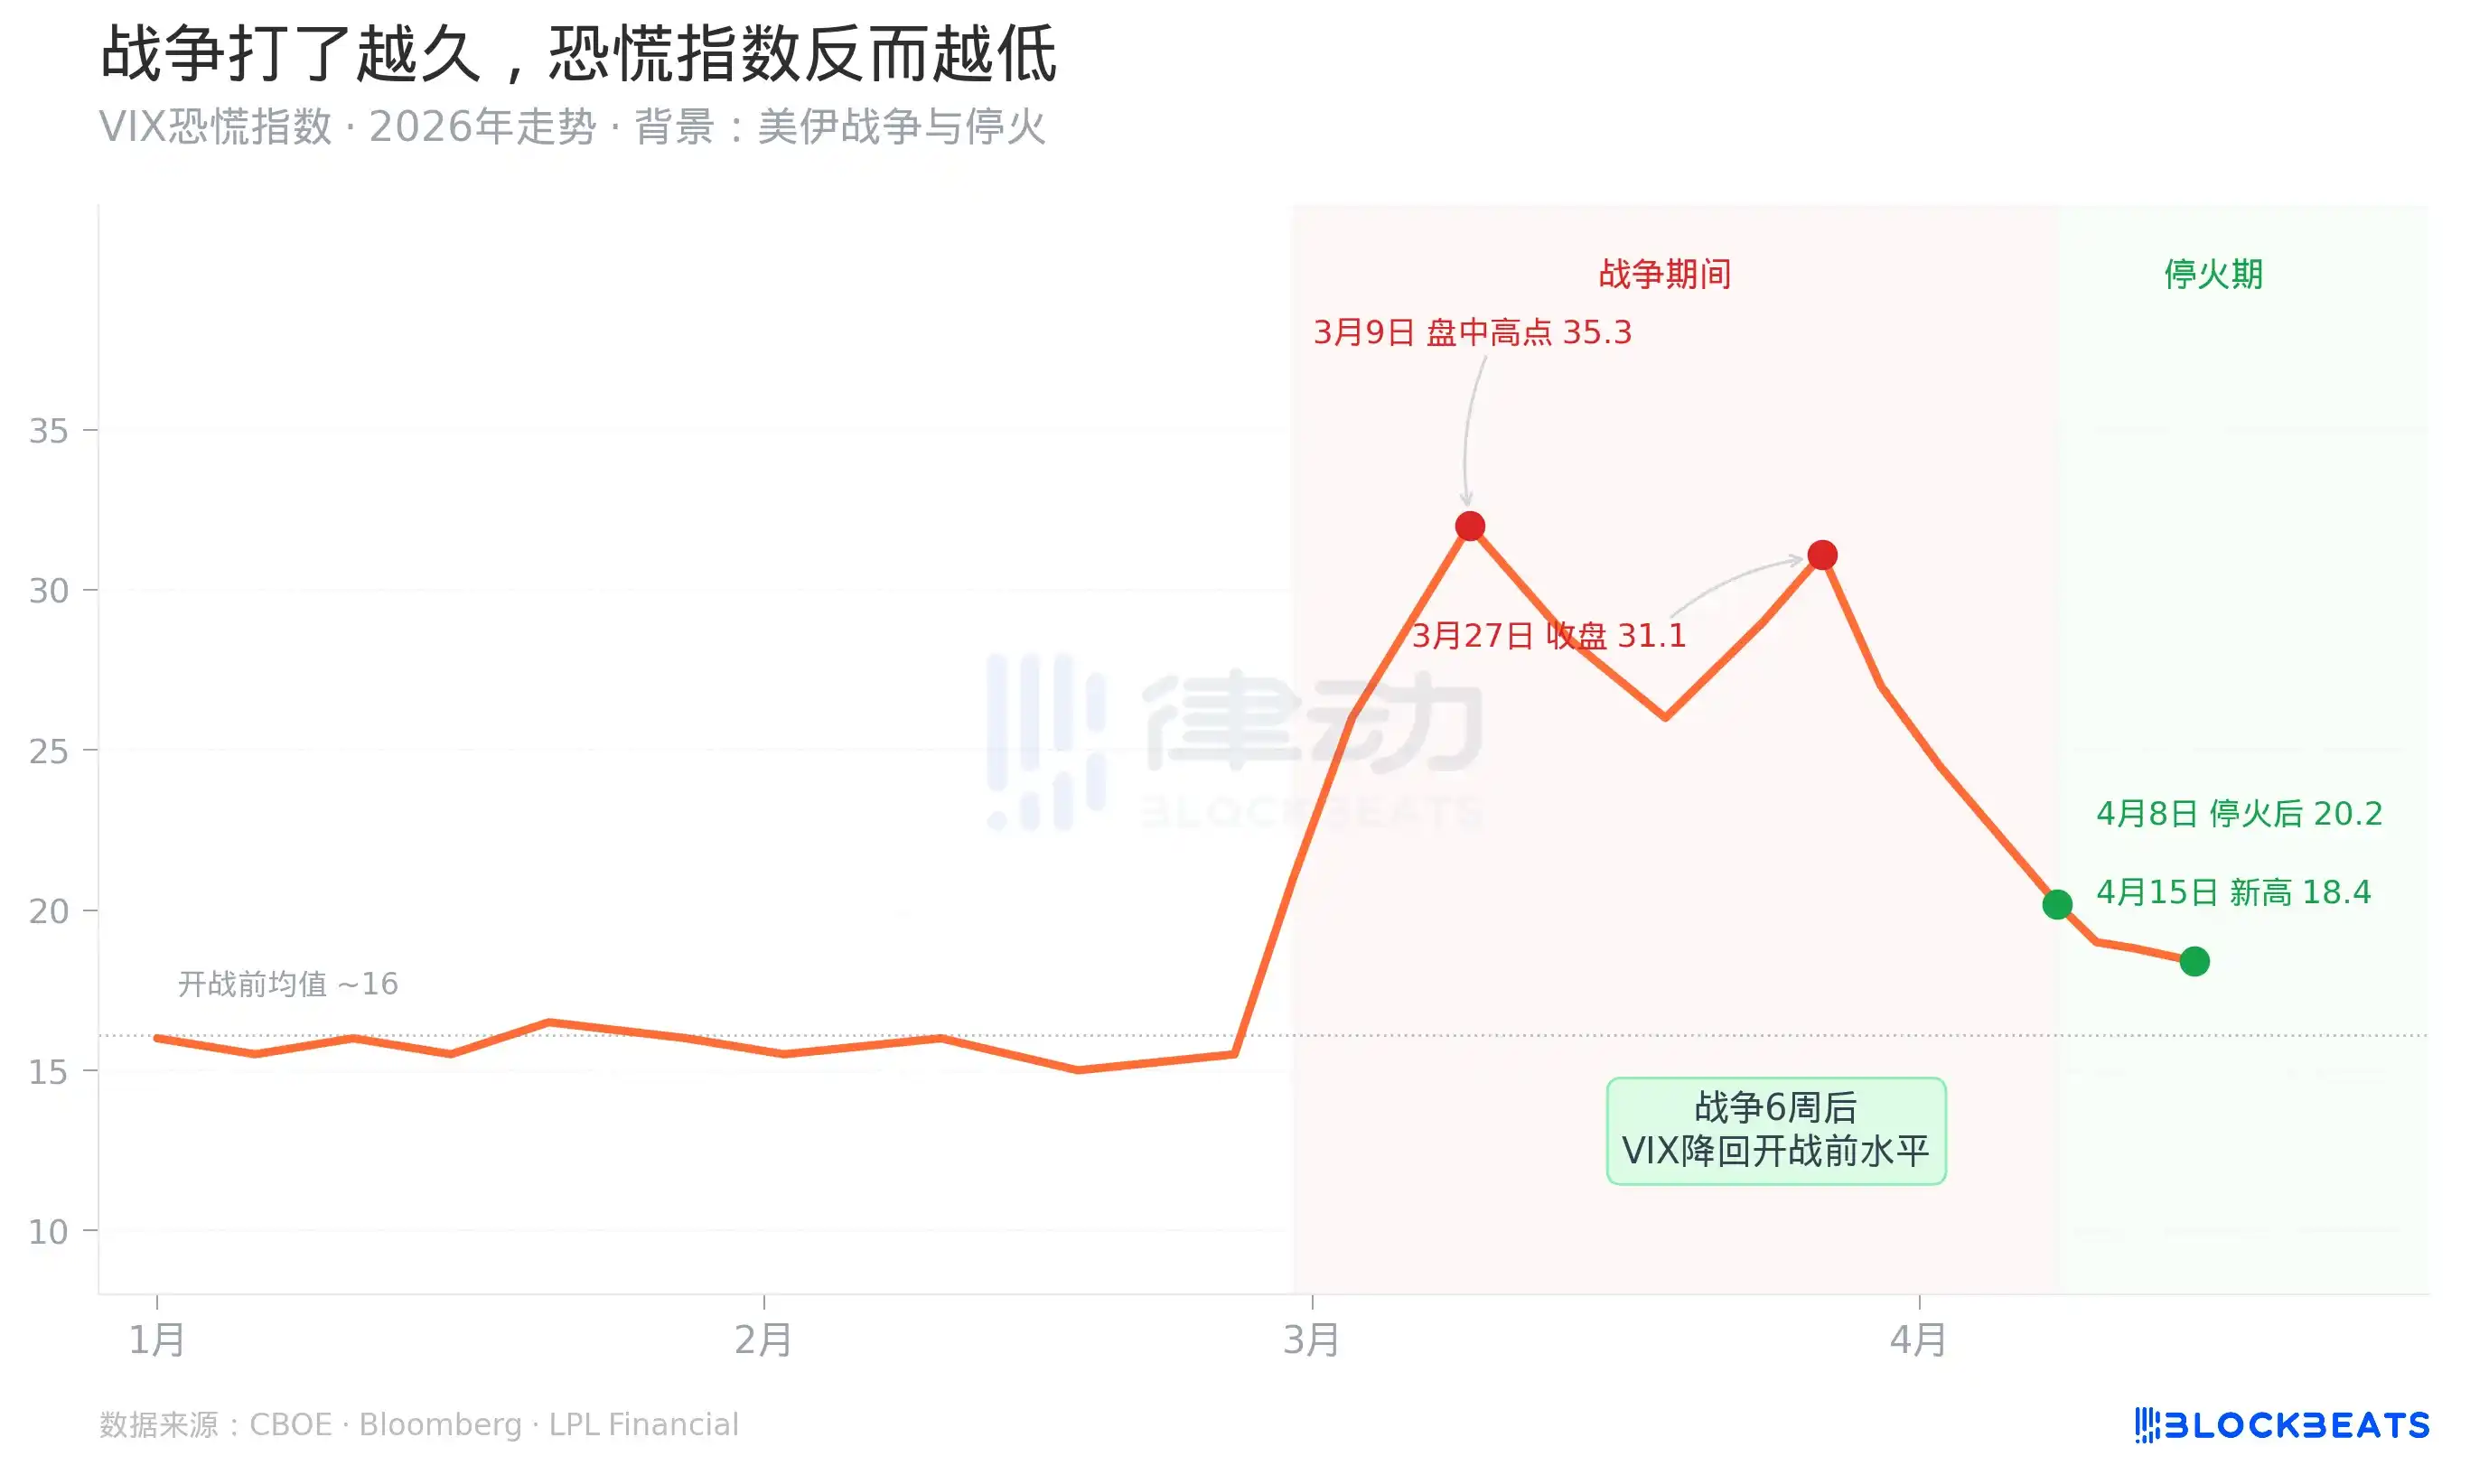
But the subsequent trend defies common sense. Starting from March 9, even as the war continued, oil prices rose, and the Senate voted on whether to authorize war powers, the VIX steadily declined. By April 15, the day the S&P hit its new record high, the VIX closed at around 18.4, lower than its level before the war started on February 28.

What does this mean? It means the market has reclassified this war from a "source of uncertainty" to a "calculable risk." Within six weeks, an ongoing war went from a "panic event" to "quarterly raw material."

This was achieved by a very specific financial mechanism. According to a CNBC report, JPMorgan's Q1 2026 trading division revenue reached $11.6 billion, a historical record, up 20% year-over-year. Fixed income division revenue was $7.1 billion, primarily driven by commodities, currency, and emerging market trading—precisely the areas where the Iran war generated the most "volatility."

In other words, while ordinary investors were feeling fear, professional institutions were harvesting volatility as profit. The more efficiently this mechanism operates, the more inclined the market is to "digest" the war, and the faster the VIX falls.

The Commercialization of Volatility

On April 15, the same day the S&P 500 hit a record high, the Pentagon announced the deployment of an additional 10,000 troops to the Middle East, and the Senate rejected the war powers authorization bill for the fourth time. These two things happened on the same day, and the market had no reaction to them.
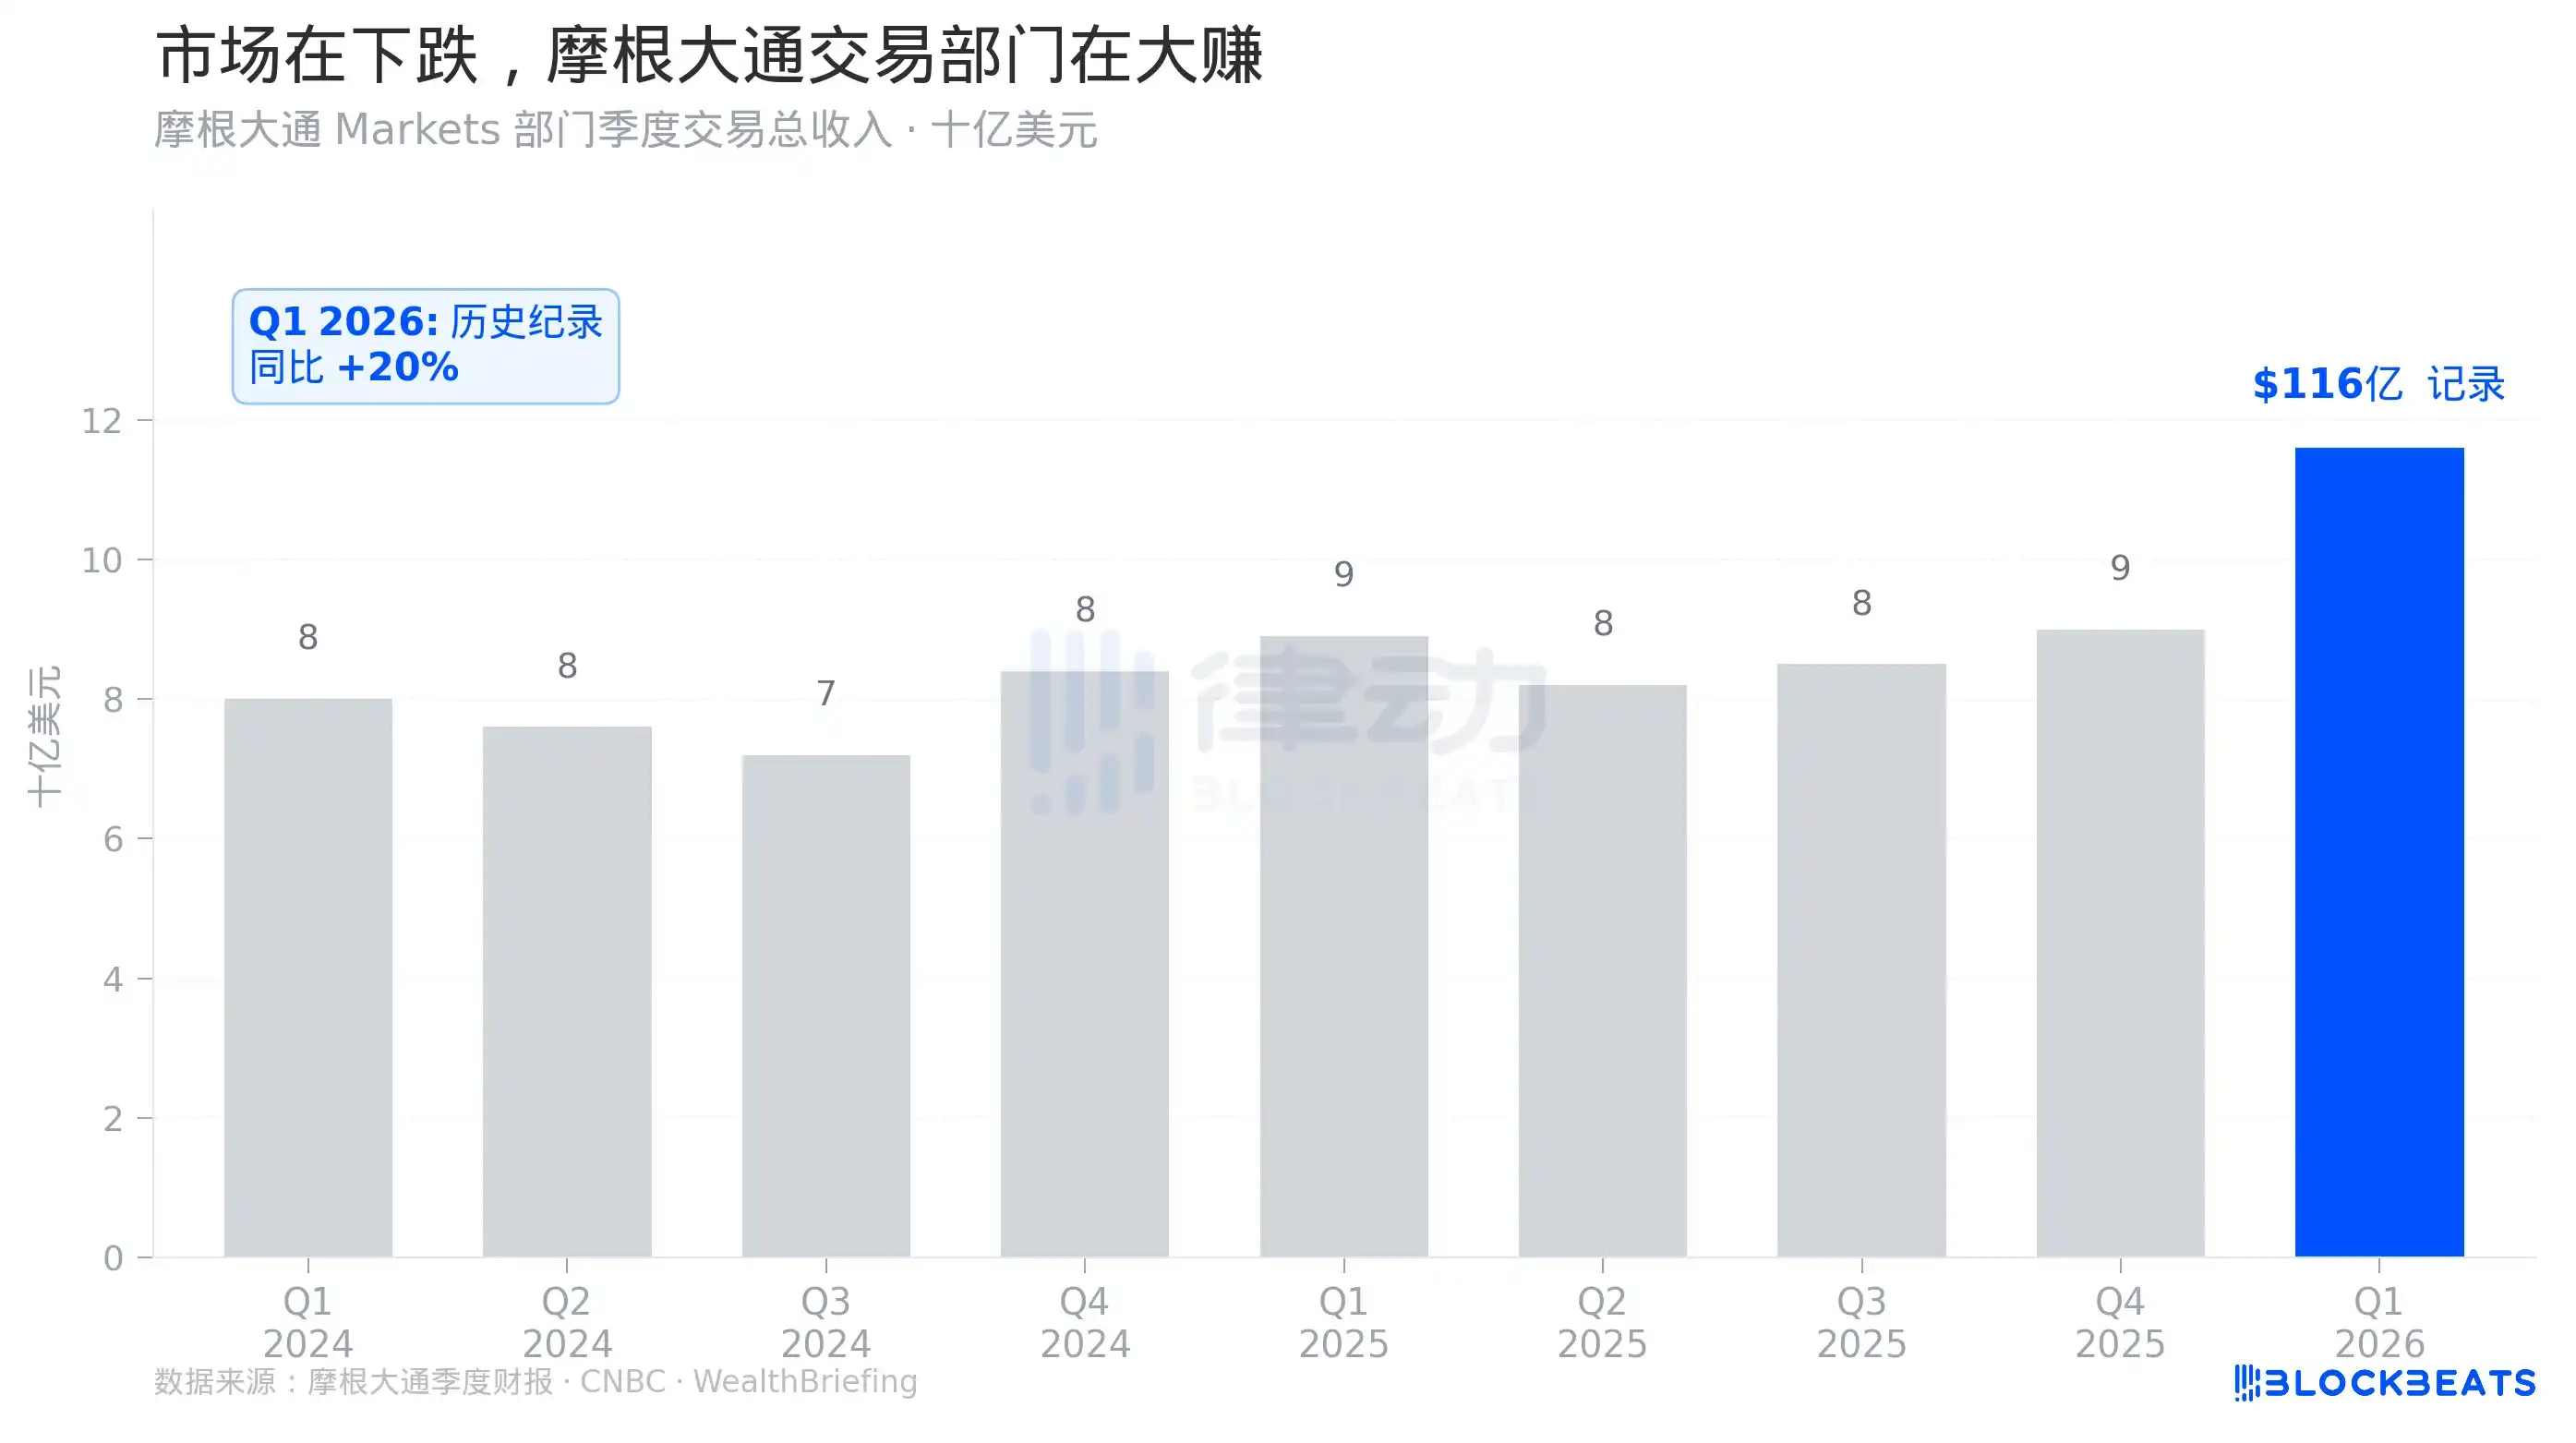
As shown in Chart 4, the bar for JPMorgan's Q1 2026 trading revenue is significantly higher than the previous eight quarters. This isn't a marginal improvement; it's a jump.

Supporting this jump are the profits hedge funds and market makers made from war volatility. According to Goldman Sachs Prime Brokerage data, as of April 14, the net long positions of U.S. hedge funds had turned positive for the first time since the end of 2025. During the same period, according to FINRA data cited by Atwater Malick, U.S. stock margin debt hit a record high of $1.28 trillion, up 36% year-over-year.

Three signals appeared simultaneously: hedge funds shifting from short to long, record leverage, and the market hitting record highs. This is a standard "trading on optimism" pattern.

Understanding this pattern involves looking at the financial infrastructure layer. When Wall Street's market makers, derivatives markets, and hedge funds are sufficiently mature, geopolitical shocks are no longer exogenous, unmeasurable risks but rather raw materials that can be priced, hedged, and commercialized. The Iran war, for JPMorgan's trading desk, is not a threat but an opportunity. The same goes for hedge funds that positioned correctly.

This is the true meaning of the "two screens, two worlds" on April 15. The Pentagon is prolonging the war; the market is pricing the end of the war. These two things are not contradictory because, for market makers, how long the war lasts is not important; whether the volatility is large enough is.

Of course, this mechanism has its fragility. The new high in 11 trading days implies an assumption: the two-week ceasefire will be smoothly extended, Iran nuclear negotiations will proceed as expected, and oil prices will fall. If any of these assumptions prove wrong, there is little buffer in the current pricing. The $1.28 trillion in leveraged funds is also an amplifier on the way down.

7,000 points is a price that only holds in the most optimistic scenario.

Criptos en tendencia

Preguntas relacionadas

QHow many trading days did it take for the S&P 500 to recover to a new all-time high after the Iran War correction, and how does this compare to historical events?

AIt took 11 trading days for the S&P 500 to recover to a new all-time high after the Iran War correction. This is significantly faster than historical events such as the COVID-19 pandemic (103 days), the Gulf War (87 days), the 2011 US debt crisis (106 days), and even the 2022 Russia-Ukraine conflict (18 days).

QWhat was the primary narrative driving the market correction and subsequent rapid recovery during the Iran War event?

AThe primary narrative driving the market correction was 'ceasefire expectations' rather than a deterioration in economic fundamentals. The market fell due to uncertainty, not corporate earnings. When ceasefire news emerged, the uncertainty was quickly priced out, leading to a rapid recovery without the need to wait for quarterly earnings data to rebuild confidence.

QWhat unusual pattern was observed in the VIX (Volatility Index) during the Iran War, and what does it signify?

AThe VIX spiked from around 16 to 35.3 at the start of the war but then steadily declined, closing at approximately 18.4 by April 15—lower than its pre-war level. This indicates that the market rapidly reclassified the war from a source of 'uncertainty' to a 'calculable risk,' effectively commercializing the volatility it generated.

QHow did major financial institutions like JPMorgan perform during Q1 2026, and what was the driver behind this performance?

AJPMorgan's Q1 2026 trading department revenue reached a record $11.6 billion, a 20% year-over-year increase. This was largely driven by its fixed income division, which generated $7.1 billion in revenue from trading commodities, currencies, and emerging markets—areas most affected by the volatility from the Iran War.

QWhat are the potential risks associated with the market's rapid recovery and record-high leverage, as mentioned in the article?

AThe rapid recovery and record-high leverage of $1.28 trillion in margin debt assume optimistic scenarios, such as the temporary ceasefire being extended and Iran nuclear negotiations progressing smoothly. If any of these assumptions fail, the highly leveraged market has little buffer, and the same leverage that amplified gains could exacerbate losses in a downturn.

Lecturas Relacionadas

Must-Watch Events Next Week|CLARITY Act Could Face Senate Vote; SpaceX, Circle to Report Earnings (8.3-8.9)

**Summary: Key Events and Developments to Watch (August 3-9)** The upcoming week is marked by significant financial disclosures, key legislative deadlines, and notable product updates. **Major Financial Events:** Several companies are scheduled to release their Q2 2026 earnings. American Bitcoin (ABTC) will report on August 3, followed by SpaceX and Hut 8 Mining Corp. on August 4, and Circle on August 5. Notably, a significant portion of SpaceX shares (up to 12% of total shares) will be unlocked on August 6 following their earnings release. **Key Legislative Deadline:** The U.S. Senate faces an August 7 deadline to secure 60 votes for the CLARITY Act, a bipartisan bill aiming to establish a federal regulatory framework for cryptocurrencies. The Senate may hold a full vote on the bill during the week. **Economic Data:** The U.S. July Non-Farm Payrolls report will be released on August 7, providing crucial labor market data. **Technology & Product Updates:** * **Shutdowns:** DeFi portfolio tracker Zapper and wallet app Ctrl Wallet will cease operations on August 3. * **Upgrades:** LayerZero will deprecate its v1 relayers on August 3. XRP Ledger's new version 3.3.0, featuring five new functions, is expected next week. * **AI:** Elon Musk announced that the advanced Grok 4.6 AI model is set for release around August 7. * **Bitcoin:** The BIP-110 forced signaling for a potential Bitcoin network change is scheduled to begin around August 8. **Other Notable Events:** Chinese robotics firm Unitree Tech has set its preliminary price inquiry for its IPO for August 5. South Korean exchange Upbit will delist AQT and AERGO tokens on August 3.

marsbitHace 19 min(s)

Must-Watch Events Next Week|CLARITY Act Could Face Senate Vote; SpaceX, Circle to Report Earnings (8.3-8.9)

marsbitHace 19 min(s)

Stocks Are Plummeting More Sharply Than Cryptocurrencies. Where Has the Money Gone?

Stock Markets Plunge Deeper Than Cryptocurrencies: Where Did the Money Go? In late July, Seoul's Kospi index triggered circuit breakers for two consecutive days, plummeting over 40% from its June high. The collapse was led by heavyweight stocks like SK Hynix, whose record profits still disappointed investors, and devastating leveraged ETFs, with one major product losing over 83% of its value. This signaled a global, forced deleveraging targeting the most crowded trades. Interestingly, while stocks exhibited extreme volatility akin to crypto markets, Bitcoin rose nearly 15% in July after a prior steep drop. Analysis shows the money fleeing equities did not flow into Bitcoin. Instead, Bitcoin had already absorbed its sell-off in May-June, when U.S. spot Bitcoin ETFs saw historic outflows. The true safe-haven beneficiary was gold, whose price rose over 20% year-on-year, highlighting a decoupling between Bitcoin and gold as "digital gold." The sell-off was a targeted unwinding of leveraged positions in tech and semiconductors, accelerated by broker-dealer risk management and shifts in the AI narrative, including new competition from Chinese memory chipmakers. The retreat path was clear: from high-valuation tech stocks to cash and U.S. Treasuries, then to gold. For Bitcoin to attract sustained institutional inflows, conditions like eased global liquidity pressure, a "soft-landing" Fed rate cut, and U.S. regulatory clarity via legislation like the stalled CLARITY Act are needed. Currently, Bitcoin is not a safe haven but an already-cleared asset. Its low correlation with tech stocks, however, makes it a potential diversification play for institutional portfolios once the storm passes. The money isn't here yet, but the positioning is underway.

marsbitHace 19 min(s)

Stocks Are Plummeting More Sharply Than Cryptocurrencies. Where Has the Money Gone?

marsbitHace 19 min(s)

In Conversation with Ray Dalio: We Are Currently in an AI Bubble, with 1% of My Portfolio in Bitcoin

Ray Dalio, founder of Bridgewater Associates, warns in an interview that the current AI boom shows classic bubble characteristics, which could lead to significant economic downturns as seen in past cycles like 1929 or 2000. He explains that speculative enthusiasm, fueled by debt and overvaluation, often precedes a crash when rising rates or taxation force asset sales, causing widespread losses and recession. Dalio also outlines his "Big Cycle" theory, describing an approximate 80-year pattern where widening wealth gaps, massive government deficits, and shifting geopolitical power (like China's rise) create internal conflict and global instability. He emphasizes that we are in a late-cycle, transitional phase where traditional powers like the US and UK face decline. For personal wealth protection, Dalio advises diversification beyond cash into assets like stocks, bonds, real estate, and particularly gold, which he prefers over Bitcoin. While he holds about 1% of his portfolio in Bitcoin as a non-printable hard asset, he views gold as more secure from technological or governmental threats. Regarding AI's impact, Dalio believes it will disproportionately benefit capital owners, worsening inequality by replacing both physical and cognitive labor. He suggests that human intuition and emotional intelligence, combined with AI, will be key for future workers. On taxation, Dalio argues that wealth taxes are impractical and risk triggering asset sell-offs, reducing productive investment. He points to the UK as a cautionary example of debt, low productivity, and political strife. Geopolitically, Dalio foresees a more regionalized world, with the US showing weakness in prolonged conflicts like with Iran, akin to past imperial declines. The ideal outcome, he suggests, is coexisting powerful blocs (e.g., Americas, China-Asia Pacific) without major war.

marsbitHace 4 hora(s)

In Conversation with Ray Dalio: We Are Currently in an AI Bubble, with 1% of My Portfolio in Bitcoin

marsbitHace 4 hora(s)

Daily 7.2 Trillion KRW: Foreign Capital's Record Net Buying on Friday! Wall Street Says Headwinds for Korean Stock Fund Flows Have Subsided

South Korean stock market sees a dramatic shift in fund flows. On July 31, foreign investors made a record net purchase of approximately KRW 7.2 trillion in KOSPI stocks, marking a fundamental reversal from the persistent large-scale net outflows seen in previous months. This contributed to a significant narrowing of foreign net selling in July to KRW 9.8 trillion, down sharply from KRW 48.4 trillion in June and KRW 44.5 trillion in May. Simultaneously, domestic institutional pressure eased. South Korean pension funds and asset managers turned to a net buying position in July, purchasing KRW 1.0 trillion worth of KOSPI shares, contrasting with net sales in May and June. Market volatility is expected to be dampened by new financial regulations. Effective July 31, the Financial Services Commission tightened access for retail investors to single-stock leveraged ETFs by raising the minimum cash deposit requirement. Trading volumes for these products subsequently dropped to about 50% of their monthly average. Citigroup Research maintains its year-end KOSPI target of 10,000 points. The firm cites several supportive factors: the substantial easing of headwinds from capital outflows, a robust fundamental outlook for the semiconductor sector, historically low market valuations, strong economic fundamentals, and the potential for policy support from financial authorities if needed.

marsbitHace 4 hora(s)

Daily 7.2 Trillion KRW: Foreign Capital's Record Net Buying on Friday! Wall Street Says Headwinds for Korean Stock Fund Flows Have Subsided

marsbitHace 4 hora(s)

Trading

Spot

Artículos destacados

Cómo comprar WAR

¡Bienvenido a HTX.com! Hemos hecho que comprar WAR (WAR) sea simple y conveniente. Sigue nuestra guía paso a paso para iniciar tu viaje de criptos.Paso 1: crea tu cuenta HTXUtiliza tu correo electrónico o número de teléfono para registrarte y obtener una cuenta gratuita en HTX. Experimenta un proceso de registro sin complicaciones y desbloquea todas las funciones.Obtener mi cuentaPaso 2: ve a Comprar cripto y elige tu método de pagoTarjeta de crédito/débito: usa tu Visa o Mastercard para comprar WAR (WAR) al instante.Saldo: utiliza fondos del saldo de tu cuenta HTX para tradear sin problemas.Terceros: hemos agregado métodos de pago populares como Google Pay y Apple Pay para mejorar la comodidad.P2P: tradear directamente con otros usuarios en HTX.Over-the-Counter (OTC): ofrecemos servicios personalizados y tipos de cambio competitivos para los traders.Paso 3: guarda tu WAR (WAR)Después de comprar tu WAR (WAR), guárdalo en tu cuenta HTX. Alternativamente, puedes enviarlo a otro lugar mediante transferencia blockchain o utilizarlo para tradear otras criptomonedas.Paso 4: tradear WAR (WAR)Tradear fácilmente con WAR (WAR) en HTX's mercado spot. Simplemente accede a tu cuenta, selecciona tu par de trading, ejecuta tus trades y monitorea en tiempo real. Ofrecemos una experiencia fácil de usar tanto para principiantes como para traders experimentados.

232 Vistas totalesPublicado en 2024.12.11Actualizado en 2026.06.02

Cómo comprar WAR

Discusiones

Bienvenido a la comunidad de HTX. Aquí puedes mantenerte informado sobre los últimos desarrollos de la plataforma y acceder a análisis profesionales del mercado. A continuación se presentan las opiniones de los usuarios sobre el precio de WAR (WAR).

活动图片













