By: Liam 'Akiba' Wright
Compiled by: Saoirse, Foresight News
Key Takeaways
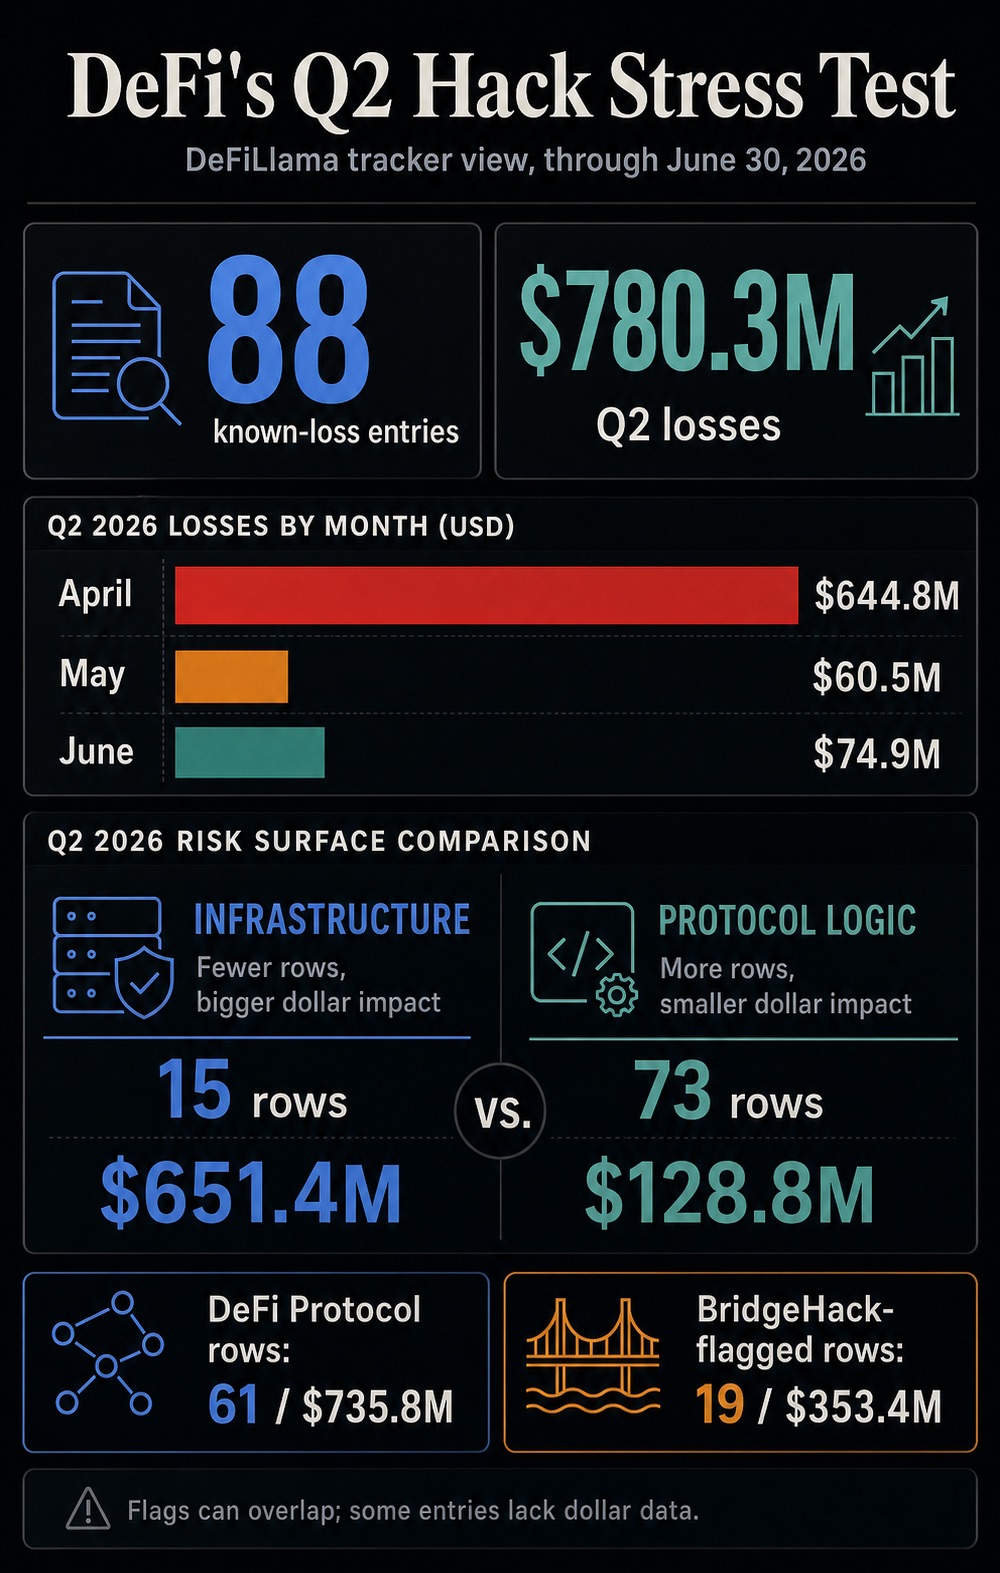
- DeFiLlama statistics show 88 recorded hacking incidents with clear loss amounts in Q2, totaling $780.3 million in losses as of June 30.
- A series of theft incidents prove that security losses have now become part of the cost of capital in DeFi, directly impacting user returns, asset routing choices, and liquidity deployment decisions.
- Cross-chain bridge risks and contract logic vulnerabilities remain long-term industry hazards. Multiple security incidents in June have also led the market to continually question: where should funds flow to ensure safety.
In discussions about various vulnerability thefts in DeFi today, traders are increasingly noticing a cost not factored into the annualized yield of liquidity pools: even if cross-chain bridges, private keys, front-end interfaces, oracles, and contract code always carry potential failure risks, users still have to pay a price to participate in the on-chain ecosystem.
For ordinary users and liquidity providers, the considerations extend far beyond just the level of yield. Even if a certain capital pathway can generate additional returns, users must weigh whether the accompanying technical, operational, and governance risks are worth it.
Data from DeFiLlama's hack tracking database for Q2 shows 88 attack incidents with quantifiable losses, resulting in a cumulative loss of $780.3 million as of June 30.
April was the most severe month, with thefts reaching $644.8 million; dozens of attacks in May and June added another $135.4 million in losses. The security crisis throughout Q2 wasn't a single major black swan event but rather an ongoing industry stress test. Even as the heat from major news faded, attack-related losses continued to accrue.
As of June 30, the total recorded scale of cryptocurrency theft incidents globally reached $16.65 billion. Of this, losses marked as DeFi protocol attacks amounted to $7.85 billion, and cross-chain bridge thefts accounted for $3.26 billion.
Within Q2 alone, DeFi protocol-related attacks caused $735.8 million in losses, and cross-chain bridge attacks resulted in $353.4 million in losses.
Interpreting this data requires attention to detail: DeFiLlama's tags overlap, with some events classified as both cross-chain bridge attacks and protocol vulnerability attacks, and some incidents did not disclose the full theft amount.
Despite these statistical biases, the core conclusion is clear: theft risk permeates the entire DeFi infrastructure, including asset transfer channels, access control, interaction interfaces, and verification systems—all foundational to the normal operation of decentralized finance.
Throughout Q2: Security Losses Officially Incorporated into Asset Pricing Models
Q2 losses and incidents were concentrated in two main risk categories: infrastructure vulnerabilities resulted in massive single-theft amounts, while contract logic vulnerabilities were the most frequent in terms of incident count.
DeFiLlama Q2 2026 Statistics (Includes only incidents with recorded loss amounts)
- Total Attack Incidents in Q2: 88 (with clear loss figures)
- Total Q2 Losses: $780.3 Million
- DeFi Protocol Attack Records: 61 incidents, total loss $735.8 Million
- Cross-chain Bridge Attack Records: 19 incidents, total loss $353.4 Million
- Infrastructure Risk Incidents: 15 (with amount records), total loss $651.4 Million
- Contract Logic Vulnerability Incidents: 73 (with amount records), total loss $128.8 Million
- Monthly Loss Distribution: April $644.8M, May $60.5M, June $74.9M
The two types of risks impact market pricing differently. Contract logic vulnerabilities can be simply viewed as code quality issues within a single application.
However, the impact of infrastructure vulnerabilities is entirely different. These risks cover public facilities like cross-chain bridges, signature verification systems, cross-chain messaging, admin permissions, hot wallets, etc., upon which all cross-platform fund transfers rely.
Once security vulnerabilities appear in infrastructure, DeFi's traditional yield calculation models lose their reference value. A liquidity pool might advertise a high annualized yield, but users are forced to consider: does the necessary path to obtain this yield depend on a cross-chain bridge, an oracle, a front-end interaction page, signature nodes, or admin permissions—risks in these links that ordinary users cannot assess in real-time.
Market makers wanting to maintain multi-chain liquidity supply must rely on trading spreads to compensate for the operational risk costs associated with cross-chain asset transfers.
This represents a crucial shift in market logic: the industry is moving from "post-incident analysis" to "ex-ante risk premium pricing," with all participants recalculating the true cost of accessing the on-chain ecosystem.
The costs users bear are no longer just gas fees, slippage, or borrowing interest; when funds are in transit, the risk of losses due to failures in permissions, transmission channels, or verification layers also becomes a hidden expense.
This repricing process is subtle: platform-displayed annualized yields won't decrease, but users will actively demand platforms provide fast redemption channels, asset insurance, or demand higher return compensation for projects with high cross-chain risks, which directly reduces the project's actual net return.
Even without a standardized security rating system in place, the market will intuitively reflect risk expectations through shrinking liquidity, widening bid-ask spreads, and platforms raising the cost of liquidity incentives.
The Trustworthiness of Asset Routing Becomes Part of the Trade Itself
The risks exposed by cross-chain bridges best illustrate the changes brought by this industry stress test. Q2 cross-chain bridge-related attacks resulted in total losses of $353.4 million, clearly demonstrating that cross-chain asset routing is no longer just a choice about convenience.
If participating in a yield opportunity requires funds to pass through a cross-chain bridge or cross-chain messaging middleware, then this transmission path itself is part of the trade's risk.
Recent cross-chain security incidents have already altered market behavior: following the KelpDAO and LayerZero vulnerability thefts, many projects began restructuring their underlying security architecture.
The emergency service shutdown after the THORChain attack also exposed the same issue: once the trustworthiness of an asset routing path collapses, the system prioritizes suspending operations, with problem investigation following later.
For ordinary users, liquidity will increasingly concentrate on platforms with clearer paths, lower cross-chain risk, sufficient capital depth, and that avoid fragile transmission channels.
For yield aggregators and market makers, routing algorithms, besides considering price, capital depth, and Gas fees, will gradually incorporate security risk assessment dimensions.
Even cross-chain bridges and platforms operating normally will face higher capital usage costs. Funds will still flow through these channels, but the market will demand wider trading spreads, comprehensive asset insurance, more reliable verification mechanisms, or shorter periods of asset exposure to risk.
In the DeFi market, this is the risk premium not yet standardized into accounting.
This logic also affects new project launch strategies. When protocols open new trading markets, launch speed is no longer the top priority; instead, they will re-evaluate the cross-chain bridges, admin permissions, and oracle pathways the project relies on.
Liquidity providers might actively reduce the number of blockchains they participate in because each new cross-chain pathway adds a new layer of security risk. Each individual's choice may seem insignificant, but collectively, they will determine where market liquidity concentrates and which platforms see usage costs surge due to excessive risk.
Asset insurance is also part of this cycle. If insurers and ordinary users view cross-chain risk as a normal operational hazard, then insurance coverage will become a core metric for judging a platform's ability to attract liquidity on a large scale.
Protocols unable to clearly disclose their risk prevention logic, even if operating normally, will pay the price: persistently declining market liquidity or needing to spend higher costs to incentivize users to provide liquidity.
Security Investment Transforms into a Platform's Distribution Cost for Attracting Liquidity
Market-level changes are also reflected within protocols. In the past, security-related expenses were typically defined as defensive investments: including code audits, bug bounty programs, on-chain real-time monitoring, emergency response mechanisms, and emergency control functions.
After the security crisis throughout Q2, security investment has become a platform's distribution cost for acquiring liquidity. If users can clearly distinguish security differences between platforms, security capability becomes a core consideration for capital when choosing a platform.
Data from multiple third-party security firms corroborates the industry's risk landscape: A TRM Labs analysis report points out that cryptocurrency theft funds in 2026 were highly concentrated in a few major attack incidents; CertiK's 2026 Stablecoin Risk Report highlights numerous vulnerabilities in wallets, cross-chain bridges, asset custody, and payment infrastructure; Chainalysis focuses on private key signature infrastructure, social engineering scams, and attack methods for rapidly laundering stolen funds.
While each agency uses different statistical methods (Chainalysis cites large theft data based on 2025 information), the industry consensus is clear: DeFi risks are no longer confined to Solidity smart contract code vulnerabilities.
The risk scope also includes account signing permissions, user access points, cross-chain verification logic, channels for rapid conversion of stolen assets, and a protocol's ability to identify anomalous transactions before attackers complete the theft.
This forces all protocols to increase rigid security expenditures: raising bug bounty amounts, setting up 7x24 real-time monitoring, purchasing user asset insurance, implementing withdrawal rate limits, strengthening admin multi-sig controls, reviewing verification systems, hardening front-end pages, and improving external communication mechanisms for security incidents.
Whenever a large-scale theft occurs, platform liquidity costs rise, making these security expenses easier to justify to token holders by comparison.
The more profound impact lies in changes in user behavior. DeFi users have long accepted smart contract risk as a trade-off for returns, but continuous attacks make everyone feel the tangible losses caused by risk.
A single hack can be simply attributed to a platform's inherent flaws by users; but a whole quarter of frequent incidents makes the entire fund flow chain seem costly.
Various automated yield strategy tools, asset routing aggregators, and simplified front-end interfaces lower the barrier to using DeFi, but they also obscure the actual fund flow path, creating an industry contradiction.
CryptoSlate previously reported that automated yield products concentrate and amplify risks for ordinary retail users. After a quarter-long industry stress test, users are beginning to demand platforms fully disclose: fund flow paths, involved cross-chain risk assumptions, supporting insurance schemes, and handling mechanisms for third-party service failures.
External regulatory pressure also plays a role. Amid ongoing crypto scams and thefts, regulators worldwide are pushing for stronger self-regulation in the industry, with the US Treasury also issuing related risk warnings.
The DeFi theft crisis occurs in this broader market context: ordinary users, platform operators, and policymakers are all searching for solutions to significantly reduce asset theft losses while preserving the efficiency and openness inherent in decentralized finance.
This presents a difficult balancing act for DeFi: excessive risk controls divert funds elsewhere; insufficient measures allow each security incident to push up overall risk premiums.
Protocols that gain an advantage in the next phase will inevitably be those that can clearly disclose potential hidden risks and implement comprehensive risk control plans.
Attacks recorded by DeFiLlama in June still conceal numerous risks. That month's incidents covered front-end vulnerabilities, predictable private key leaks, fake proof cross-chain bridges, unbacked token minting, reverse Maximal Extractable Value (MEV) attacks, oracle manipulation, and various contract accounting/logic vulnerabilities—no single label can summarize all the hazards.
Key indicators for judging the industry's future direction: whether funds continue concentrating towards recognized safe cross-chain channels; whether projects delay launches for multiple code audits; whether asset insurance premiums rise; whether bug bounty budgets increase; whether yield aggregators visually display various security risk assumptions on their routing interfaces.
If these changes accelerate, then the entire second quarter will no longer be just a rough patch for the industry, but a complete asset risk repricing event.
The essence of DeFi hacking and theft remains a security issue, but it has also evolved into a core structural problem for the market: it is a normalized hidden tax, continuously imposing costs on all on-chain asset flows, yield generation, and trust systems.