VIRTUAL traders bet on sustained gains, but can demand break $0.65?

ambcryptoPublicado a 2026-07-21Actualizado a 2026-07-21

Resumen

Virtuals Protocol (VIRTUAL) price rallied nearly 5% in 24 hours, with Open Interest up 17% and trading volume doubling to $71.1 million, signaling improved short-term sentiment. However, the broader trend remains bearish, with price action confined within a downtrend since May. The rally has reached a key local supply zone at $0.63-$0.65, which previously rejected bulls in mid-June. While the RSI indicates upward momentum, declining On-Balance Volume (OBV) suggests weak buying pressure. Traders are advised to maintain a bearish bias unless VIRTUAL can decisively break and hold above $0.65 as support, which could open a path toward $1.04-$1.19. Until then, a rejection at this resistance level is expected.

Virtuals Protocol [VIRTUAL] rallied nearly 5% in the past 24 hours, with an Open Interest increase of nearly 17%. The rally, rising open interest, and stronger trading volume suggest improving short-term sentiment, although the broader trend remains under pressure.

This statement was reinforced by the high daily trading volume. According to CoinMarketCap data, the volume in the past 24 hours at press time was $71.1 million, more than double the previous day’s volume.

Weekends tend to see low volume, and it could be that Monday kicked off VIRTUAL’s rally. Bitcoin [BTC] was also challenging the $65.2k local supply zone.

AMBCrypto reported that Virtuals Protocol had introduced customizable tokenized indexes to the Robinhood Chain. Any user can publish such a composite asset and would earn fees when others mint the associated token.

So far, the news has not been enough to nudge the altcoin prices back above key overhead supply zones. Let’s examine where these were and how strong demand really has been.

VIRTUAL still labors within a downtrend
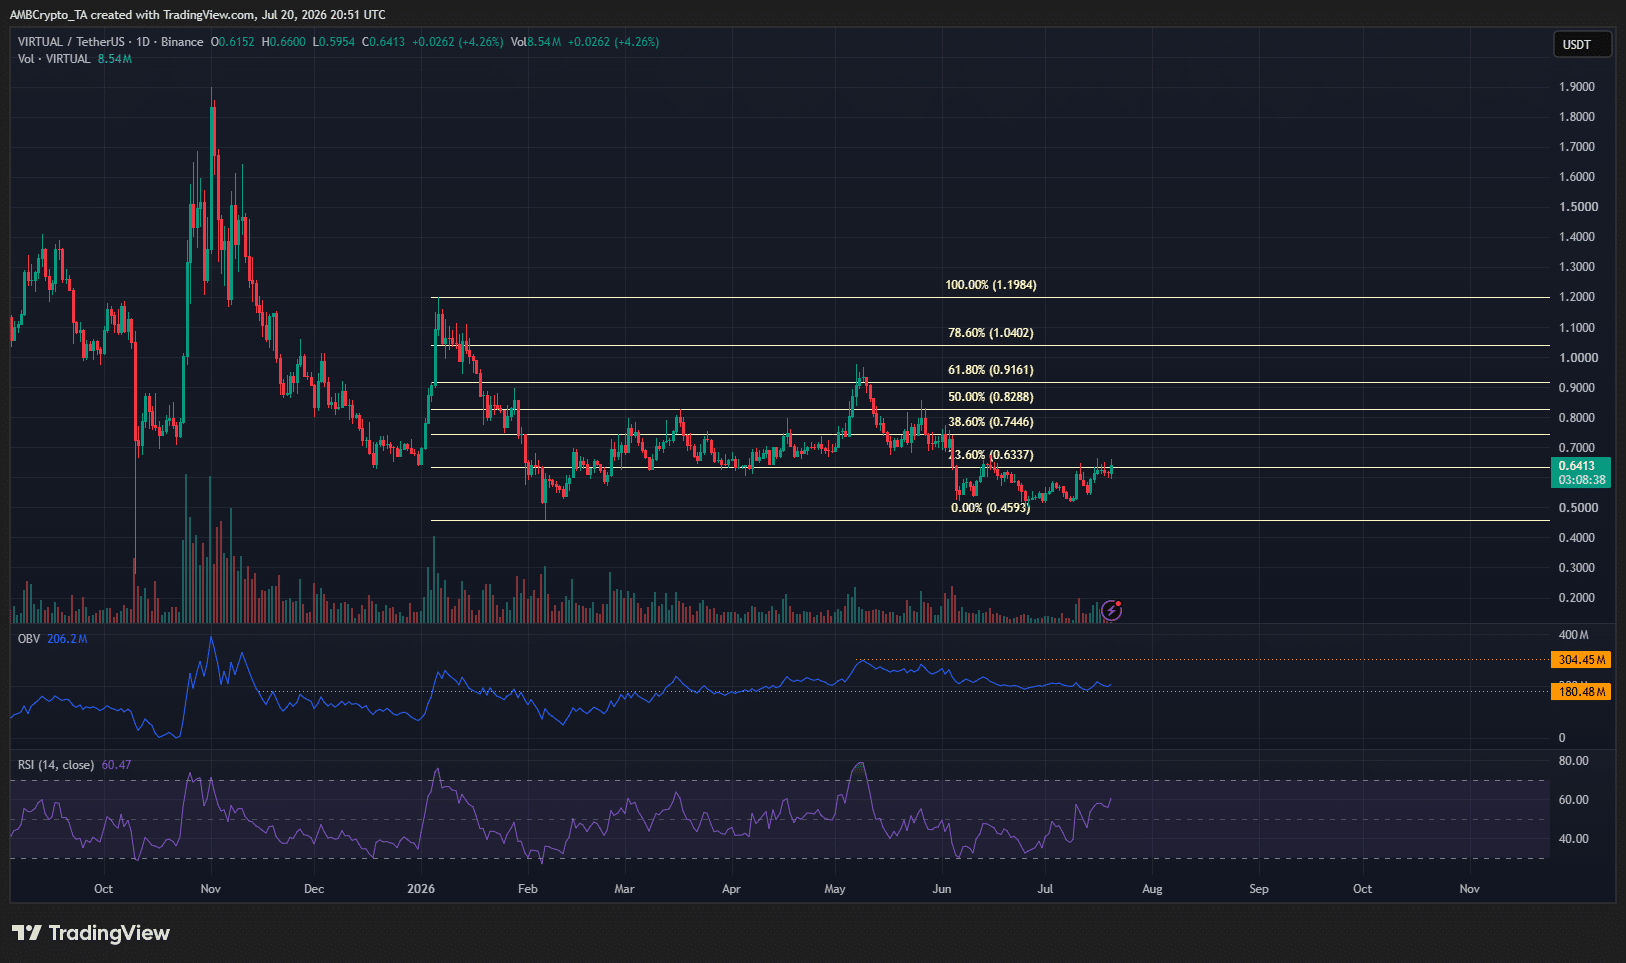
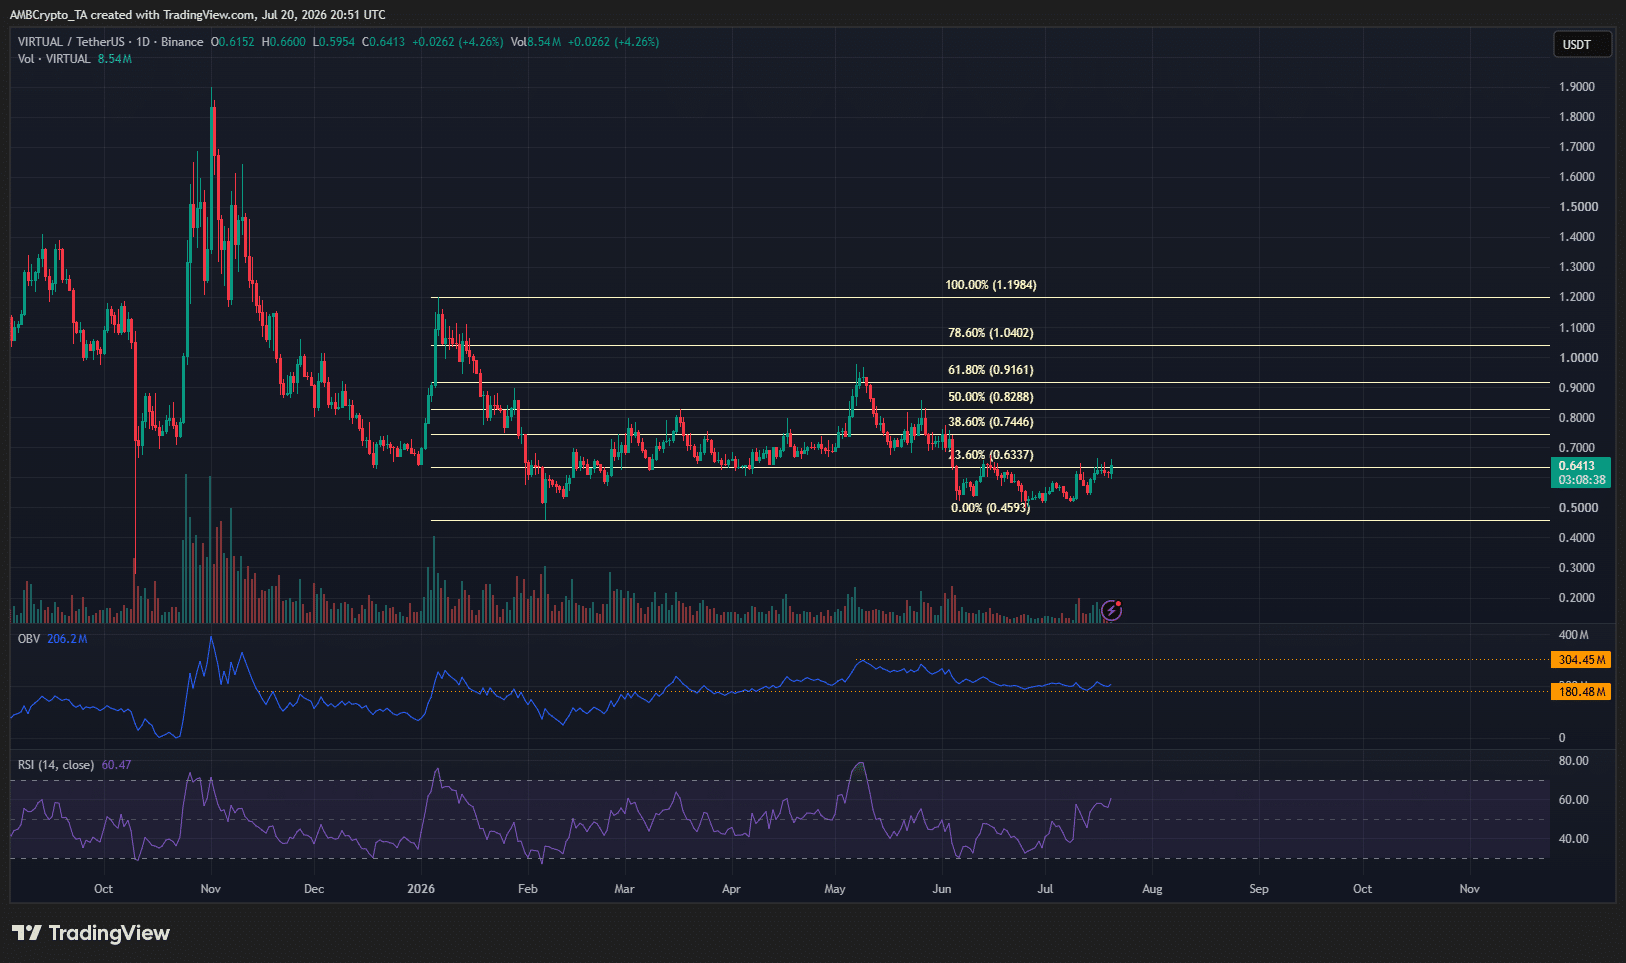
Source: VIRTUAL/USDT on TradingView

The swing structure on the 1-day timeframe was bearish. As things stand, a move below the $0.459 swing low would indicate a bearish trend continuation. Meanwhile, a rally past $1.19 is needed to flip the swing structure bullishly.

The VIRTUAL price gain of 17% in the past week was set against this bearish backdrop. The rally has reached the $0.63-$0.65 local supply zone. The same area had rejected the bulls back in mid-June.

The OBV has been trending lower since May. The 100% spike in daily trading volume could be a misleading sign. Though the RSI was above 50 to signal upward momentum, a lack of sustained buying volume over the past two months was a telltale sign of a weak bounce.

Traders’ call to action- Sell, but be ready to flip biases

In the short-term, a rejection from the $0.65 local supply zone is expected. However, if VIRTUAL prices breach this area, a bullish move as high as $1.04 and even $1.19 becomes possible.

Therefore, traders can maintain a bearish bias until $0.65 is conquered. Once it is flipped to support, swing traders can try to profit from the rally toward $1, although they should remember that the higher timeframe structure remained bearish.


Final Summary

  • The Virtuals Protocol price and volume spike on Monday could be a sign of a bullish short-term price move.
  • The long-term trend was bearish, but if $0.65 is flipped to support, a rally toward $1.0-$1.2 could follow.


Preguntas relacionadas

QAccording to the article, what are the two key price levels that traders should watch to determine the next major trend for VIRTUAL?

AAccording to the article, a move below the $0.459 swing low would indicate a bearish trend continuation, while a rally past $1.19 is needed to flip the swing structure bullishly.

QWhat recent development for Virtuals Protocol was reported by AMBCrypto, and how does the article suggest it has impacted the price so far?

AAMBCrypto reported that Virtuals Protocol introduced customizable tokenized indexes to the Robinhood Chain, allowing users to publish composite assets and earn fees. The article states that so far, this news has not been enough to nudge the altcoin prices back above key overhead supply zones.

QWhat is the immediate local supply zone that VIRTUAL's price has reached, and what is the expected short-term price action if it gets rejected?

AThe immediate local supply zone is $0.63-$0.65. The article states that in the short-term, a rejection from this $0.65 local supply zone is expected.

QWhat do the On-Balance Volume (OBV) indicator and the spike in daily trading volume suggest about the strength of VIRTUAL's recent rally?

AThe OBV has been trending lower since May, indicating a lack of sustained buying volume. The 100% spike in daily trading volume could be a misleading sign, and the article describes the recent bounce as a weak one.

QWhat potential price targets does the article suggest could become possible if VIRTUAL manages to decisively break above the $0.65 resistance?

AThe article suggests that if VIRTUAL prices breach the $0.65 area, a bullish move as high as $1.04 and even $1.19 becomes possible.

Lecturas Relacionadas

Tras tres trimestres consecutivos de caída, ¿puede el mercado cripto encontrar una ventana de estabilización en el tercer trimestre?

El mercado cripto sufrió su peor trimestre desde 2022, con una caída del 12.6% en la capitalización total (ahora en $2.1 billones). El volumen de operaciones y el valor de las stablecoins también disminuyeron, señalando una salida generalizada de capitales. Bitcoin y Ethereum cayeron un 14.2% y 25.4% respectivamente, rompiendo su correlación con los mercados de riesgo tradicionales. Los ETFs de Bitcoin en EE.UU. registraron importantes salidas netas ($4.67 mil millones en Q2), aunque datos sugieren que el ciclo de ventas podría estar cerca de su fin. La atención del mercado se centra ahora en la reunión de la FED a finales de julio, cuya postura (halcón o paloma) podría definir el rango de trading de Bitcoin para el trimestre. El avance de la ley CLARITY en el Senado estadounidense se ha estancado, reduciendo la probabilidad de aprobación en 2026 y manteniendo una prima de riesgo regulatorio alta. Solo dos sectores mostraron crecimiento: los mercados de predicción (volumen +48.7%) y los coleccionables tokenizados (volumen +143% vs. Q1). El sentimiento general es de cautela. La lógica del mercado ha cambiado, priorizando fundamentos como la política monetaria y la regulación frente a los simples impulsos narrativos. Aunque las bases para una caída extrema parecen limitadas, la recuperación sostenida en Q3 depende críticamente de la FED y de un posible progreso regulatorio.

marsbitAyer 08:41

Tras tres trimestres consecutivos de caída, ¿puede el mercado cripto encontrar una ventana de estabilización en el tercer trimestre?

marsbitAyer 08:41

BIT Trading Moments: BTC aún presionado por la EMA 200 semanal, tras el rechazo podría reiniciar la caída, los valores de almacenamiento y semiconductores que subieron fuertemente anoche comenzaron a caer en la sesión nocturna

**BIT Trading Moments: BTC aún presionado por la EMA 200 semanal; almacenamiento y semiconductores caen en el after-hours** El mercado de cripto continúa su recuperación, con **Bitcoin** manteniéndose cerca de los $66,000. Enfrenta una fuerte resistencia en la zona de los $68,000, nivel que coincide con el costo promedio de los inversores en los últimos cinco meses y un punto de fallo anterior. Los analistas señalan que se encuentra atrapado entre la media móvil simple (MA) de 200 semanas (~$63,333) y la media exponencial (EMA) de 200 semanas (~$68,328). Se necesitaría un cierre semanal por debajo de $55,000 o por encima de $70,000 para confirmar una dirección de mayor alcance. Los ETF de Bitcoin registran entradas netas por sexto día consecutivo. En Wall Street, los **futuros de los principales índices** caen. Después de fuertes ganancias el martes, las acciones de **semiconductores y almacenamiento** retroceden en el after-hours: el ETF de semiconductores cae un 2.22%, Micron un 2.29% y SK Hynix casi un 5%. Sin embargo, **Super Micro Computer (SMCI)** se dispara más de un 20% tras el cierre, impulsada por sólidos pedidos. Otras noticias positivas incluyen un contrato de $266M de la Fuerza Aérea para **Rocket Lab**. A pesar del repunte bursátil, factores como el **crudo Brent por encima de $91** y el **rendimiento del bono estadounidense a 10 años subiendo a ~4.64%** generan preocupaciones inflacionarias y enfrían el optimismo. Las acciones relacionadas con cripto, como Coinbase y Robinhood, tuvieron un buen desempeño apoyadas por avances regulatorios. En Asia, los mercados siguieron la recuperación tecnológica. El **índice KOSPI de Corea del Sur** subió un 0.74%, con acciones de semiconductores mostrando volatilidad. El principal riesgo es el **yen japonés**, que tocó su nivel más bajo desde 1986, lo que genera temores a una intervención del gobierno. **Próximos eventos clave:** Este miércoles 22 de julio, el enfoque está en los eventos de **AMD AI** y los resultados financieros de **Alphabet (Google), Tesla e IBM** después del cierre. El jueves 23, la **decisión de tasas del BCE** y los resultados de **Intel** serán cruciales para el sentimiento del mercado.

marsbitAyer 08:33

BIT Trading Moments: BTC aún presionado por la EMA 200 semanal, tras el rechazo podría reiniciar la caída, los valores de almacenamiento y semiconductores que subieron fuertemente anoche comenzaron a caer en la sesión nocturna

marsbitAyer 08:33

Trading

Spot
活动图片