Stellar’s $0.142 test – Why it may be the buying chance traders await

ambcryptoPublicado a 2026-06-26Actualizado a 2026-06-26

Resumen

Stellar's XLM extended its decline, dropping 7.85% to $0.1514 despite a 10.55% increase in trading volume. This suggests active selling rather than support for a recovery. Key technical indicators point to persistent bearish control. XLM broke a key horizontal support and remains below a descending trendline, with the MACD in a bearish crossover and Parabolic SAR dots above the price. The RSI is at 34.42, nearing oversold territory, and the DMI shows bearish momentum is intact. The analysis indicates XLM is likely to drift toward the next major demand zone at $0.142 before any potential recovery attempt can gain traction.

Stellar [XLM] extended its decline after sellers retained firm control despite a pickup in market activity.

The token traded at around $0.1514 at press time, reflecting a 7.85% daily loss, while trading volume climbed 10.55% to $236.47 million. The combination suggests market participants actively traded into the decline instead of supporting a recovery.

XLM drifted toward its next demand zone

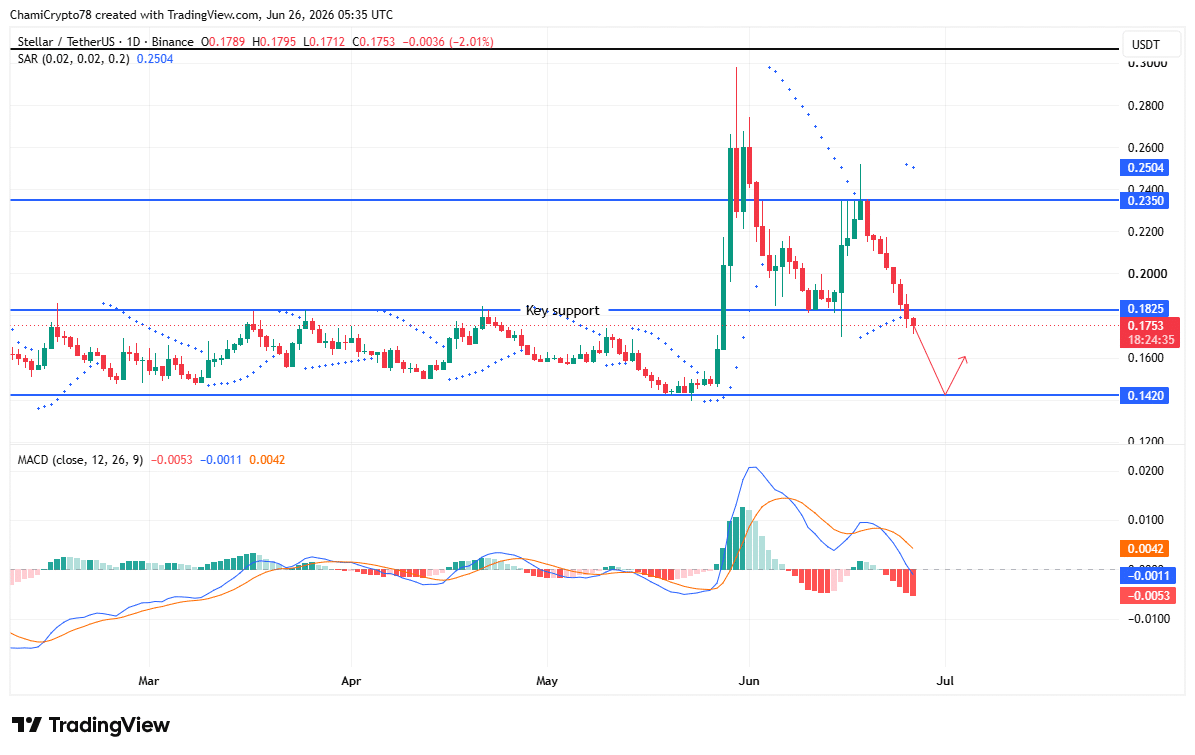
XLM broke below a key horizontal support after failing to preserve its previous trading structure, leaving the $0.142 demand zone as the next major downside objective.

Price remained below the descending trendline, reflecting continued bearish control across the chart.

The MACD maintained a bearish crossover as the histogram stayed below the zero line, showing downside pressure had not eased despite recent consolidation attempts.

In addition, the Parabolic SAR dots continued forming above the candles, reinforcing the existing downtrend instead of signaling a reversal.

Buyers repeatedly attempted to reclaim lost ground, yet every recovery stalled beneath former support, strengthening the bearish structure.

If sellers maintained control, XLM could continue drifting toward $0.142 before any meaningful recovery attempt emerged.
Source: TradingView

Buyers weakened as bears retained control

Momentum indicators continued favoring sellers as XLM approached another important technical test.

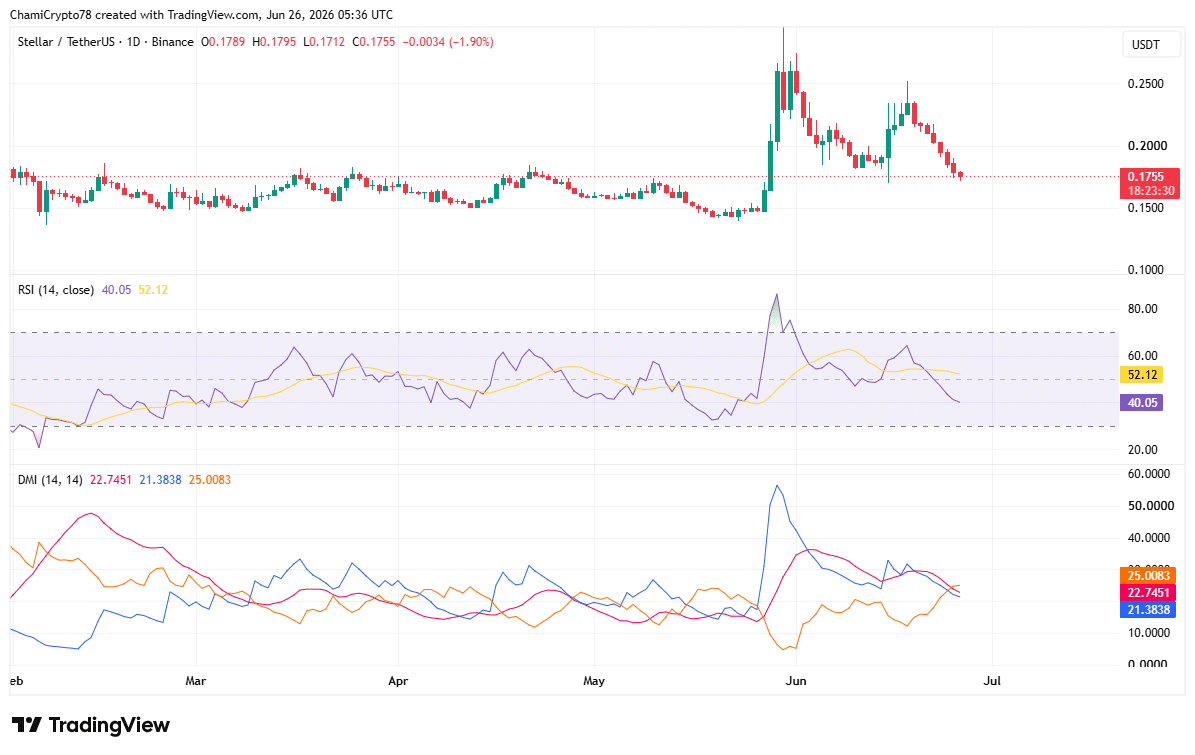
The Relative Strength Index (RSI) fell to 34.42, placing it close to oversold territory after extended selling pressure reduced buying participation.

Although the reading suggested the decline had become increasingly stretched, it had not yet confirmed a reversal signal.

Meanwhile, the Directional Movement Index (DMI) showed -DI at 25 remained well above +DI at 21.38, while the ADX climbed to 22.75.

This combination indicates the prevailing bearish trend retained enough strength to remain intact.

Buyers would likely need to reclaim control of directional movement before sentiment improves. Otherwise, weakening participation could continue supporting another leg lower toward the next demand area.
Source: TradingView

Is XLM headed for the $0.142 demand zone?

Current market conditions favored another decline toward the $0.142 demand zone before buyers could attempt a sustained recovery.

Selling pressure dominated both Spot order flow and price structure, while trend indicators continued supporting the bearish outlook.

However, if buyers successfully defend the demand zone and momentum indicators stabilize, XLM could begin building a recovery from that area. Until those signals emerge, the downside scenario remains the more probable outcome.


Final Summary

  • Rising trading activity failed to slow XLM’s decline as sellers continued controlling the market.
  • XLM could test the $0.142 demand zone before buyers attempt a meaningful recovery.

Criptos en tendencia

Preguntas relacionadas

QWhat is the current trading price of Stellar (XLM) and its daily percentage change as mentioned in the article?

AThe token traded at around $0.1514 at press time, reflecting a 7.85% daily loss.

QWhat is the next major downside price target for XLM according to the technical analysis?

AThe $0.142 demand zone is identified as the next major downside objective for XLM.

QWhat do key momentum indicators like the MACD and Parabolic SAR suggest about the market trend for XLM?

AThe MACD maintained a bearish crossover and the histogram stayed below the zero line. The Parabolic SAR dots continued forming above the candles, both reinforcing the existing downtrend and indicating continued bearish control.

QWhat does the Relative Strength Index (RSI) reading imply about XLM's current market condition?

AThe RSI fell to 34.42, placing it close to oversold territory, which suggests the decline has become increasingly stretched but has not yet confirmed a reversal signal.

QAccording to the article's conclusion, what is the more probable short-term outcome for XLM's price?

AThe downside scenario, with XLM declining towards the $0.142 demand zone, remains the more probable outcome until buyers show successful defense of that zone and momentum indicators stabilize.

Lecturas Relacionadas

Probabilidad por debajo del 50%: ¿El proyecto de ley Clarity no tiene esperanza este año?

Probabilidad cae bajo 50%: ¿Se esfuma el proyecto de Ley Clarity para este año? El objetivo inicial de firmar la Ley Clarity el 4 de julio ha fracasado, y la ventana para su aprobación antes de las elecciones de mitad de período se estrecha rápidamente. Aunque se espera el texto final del Senado pronto, el proceso en la Cámara de Representantes está estancado. Quedan solo unas tres semanas efectivas de trabajo antes del receso de agosto, con al menos tres disputas pendientes. La ley, que busca establecer el primer marco regulatorio federal integral para los activos digitales en EE.UU., define los límites de la SEC y la CFTC. Aprobada en la Cámara en julio de 2025 y por el comité bancario del Senado en mayo, enfrenta obstáculos clave: cláusulas de ingresos de stablecoins, exenciones de responsabilidad para desarrolladores DeFi y detalles sobre aplicación de la ley y ética. Una ruptura en las negociaciones a puerta cerrada a principios de junio sobre una cláusula de ética complicó más el avance. Un factor positivo es que la Asociación de Alguaciles de EE.UU. ha cambiado su postura a neutral tras abordarse algunas de sus preocupaciones sobre la aplicación de la ley. Sin embargo, según datos de Polymarket, la probabilidad de que la ley sea promulgada este año es solo del 49%. Los analistas señalan que una aprobación impulsaría la adopción institucional, mientras que un retraso prolongaría la incertidumbre regulatoria. Las próximas semanas son cruciales para el destino de esta legislación.

Foresight NewsHace 1 hora(s)

Probabilidad por debajo del 50%: ¿El proyecto de ley Clarity no tiene esperanza este año?

Foresight NewsHace 1 hora(s)

Trading

Spot

Artículos destacados

Cómo comprar XLM

¡Bienvenido a HTX.com! Hemos hecho que comprar Stellar (XLM) sea simple y conveniente. Sigue nuestra guía paso a paso para iniciar tu viaje de criptos.Paso 1: crea tu cuenta HTXUtiliza tu correo electrónico o número de teléfono para registrarte y obtener una cuenta gratuita en HTX. Experimenta un proceso de registro sin complicaciones y desbloquea todas las funciones.Obtener mi cuentaPaso 2: ve a Comprar cripto y elige tu método de pagoTarjeta de crédito/débito: usa tu Visa o Mastercard para comprar Stellar (XLM) al instante.Saldo: utiliza fondos del saldo de tu cuenta HTX para tradear sin problemas.Terceros: hemos agregado métodos de pago populares como Google Pay y Apple Pay para mejorar la comodidad.P2P: tradear directamente con otros usuarios en HTX.Over-the-Counter (OTC): ofrecemos servicios personalizados y tipos de cambio competitivos para los traders.Paso 3: guarda tu Stellar (XLM)Después de comprar tu Stellar (XLM), guárdalo en tu cuenta HTX. Alternativamente, puedes enviarlo a otro lugar mediante transferencia blockchain o utilizarlo para tradear otras criptomonedas.Paso 4: tradear Stellar (XLM)Tradear fácilmente con Stellar (XLM) en HTX's mercado spot. Simplemente accede a tu cuenta, selecciona tu par de trading, ejecuta tus trades y monitorea en tiempo real. Ofrecemos una experiencia fácil de usar tanto para principiantes como para traders experimentados.

295 Vistas totalesPublicado en 2024.12.13Actualizado en 2026.06.02

Cómo comprar XLM

Discusiones

Bienvenido a la comunidad de HTX. Aquí puedes mantenerte informado sobre los últimos desarrollos de la plataforma y acceder a análisis profesionales del mercado. A continuación se presentan las opiniones de los usuarios sobre el precio de XLM (XLM).

活动图片