Your Backtest Is Lying: Why You Must Use Point-in-Time Data

insights.glassnodePublished on 2026-03-13Last updated on 2026-03-13

Abstract

The article warns that backtests using revised historical data are misleading due to look-ahead bias. It illustrates this with a hypothetical trading strategy based on Bitcoin exchange outflows from Binance: entering the market when the 5-day moving average of BTC balance falls below the 14-day average, and exiting on the reverse. Initial backtest results using current data appeared reasonably successful, even comparable to buy-and-hold at times. However, the author argues this is deceptive because metrics like exchange balances are often revised retroactively as new data arrives, meaning a backtest uses information that wasn't available in real-time. Re-running the identical strategy using Point-in-Time (PiT) data—which is immutable and reflects only what was known when the data was first published—yielded significantly worse performance. The PiT-based strategy failed to capture key market upswings as effectively, resulting in meaningfully lower cumulative returns. The key takeaway is that only immutable, Point-in-Time data ensures a backtest accurately replays history without look-ahead bias, and that using revised data will produce lying backtests.

Let's build a simple, hypothetical trading strategy. The premise is straightforward and rooted in a widely discussed narrative: when coins leave exchanges, it tends to be bullish. The reasoning is intuitive: coins moving off exchanges typically signal that holders are withdrawing to self-custody, reducing the available supply for selling. Conversely, coins flowing onto exchanges may indicate that holders are preparing to sell.

A single day of outflows, however, is just noise. To identify a genuine trend, we would apply a moving average crossover on the exchange balance. When the short-term average falls below the long-term average, it confirms that coins have been leaving exchanges consistently, as a sustained pattern, rather than isolated events.

Using Glassnode's exchange balance for Binance, we define the following:

  • Enter the market when the 5-day moving average of Binance's BTC balance falls below its 14-day moving average, signaling a sustained outflow trend.
  • Exit the market when the 5-day average rises back above the 14-day average, signaling that the outflow trend has reversed and coins are returning to the exchange.

We then benchmark this strategy against simply holding BTC over the same period, starting January 1, 2024 through March 9, 2026, with an initial capital of $1,000 and 0.1% trading fees applied to each trade.
This is a simplified trading strategy, designed primarily for illustrative purposes. It is not investment advice, nor is it meant to suggest that exchange balances are a robust foundation for a trading system.
Access live chart

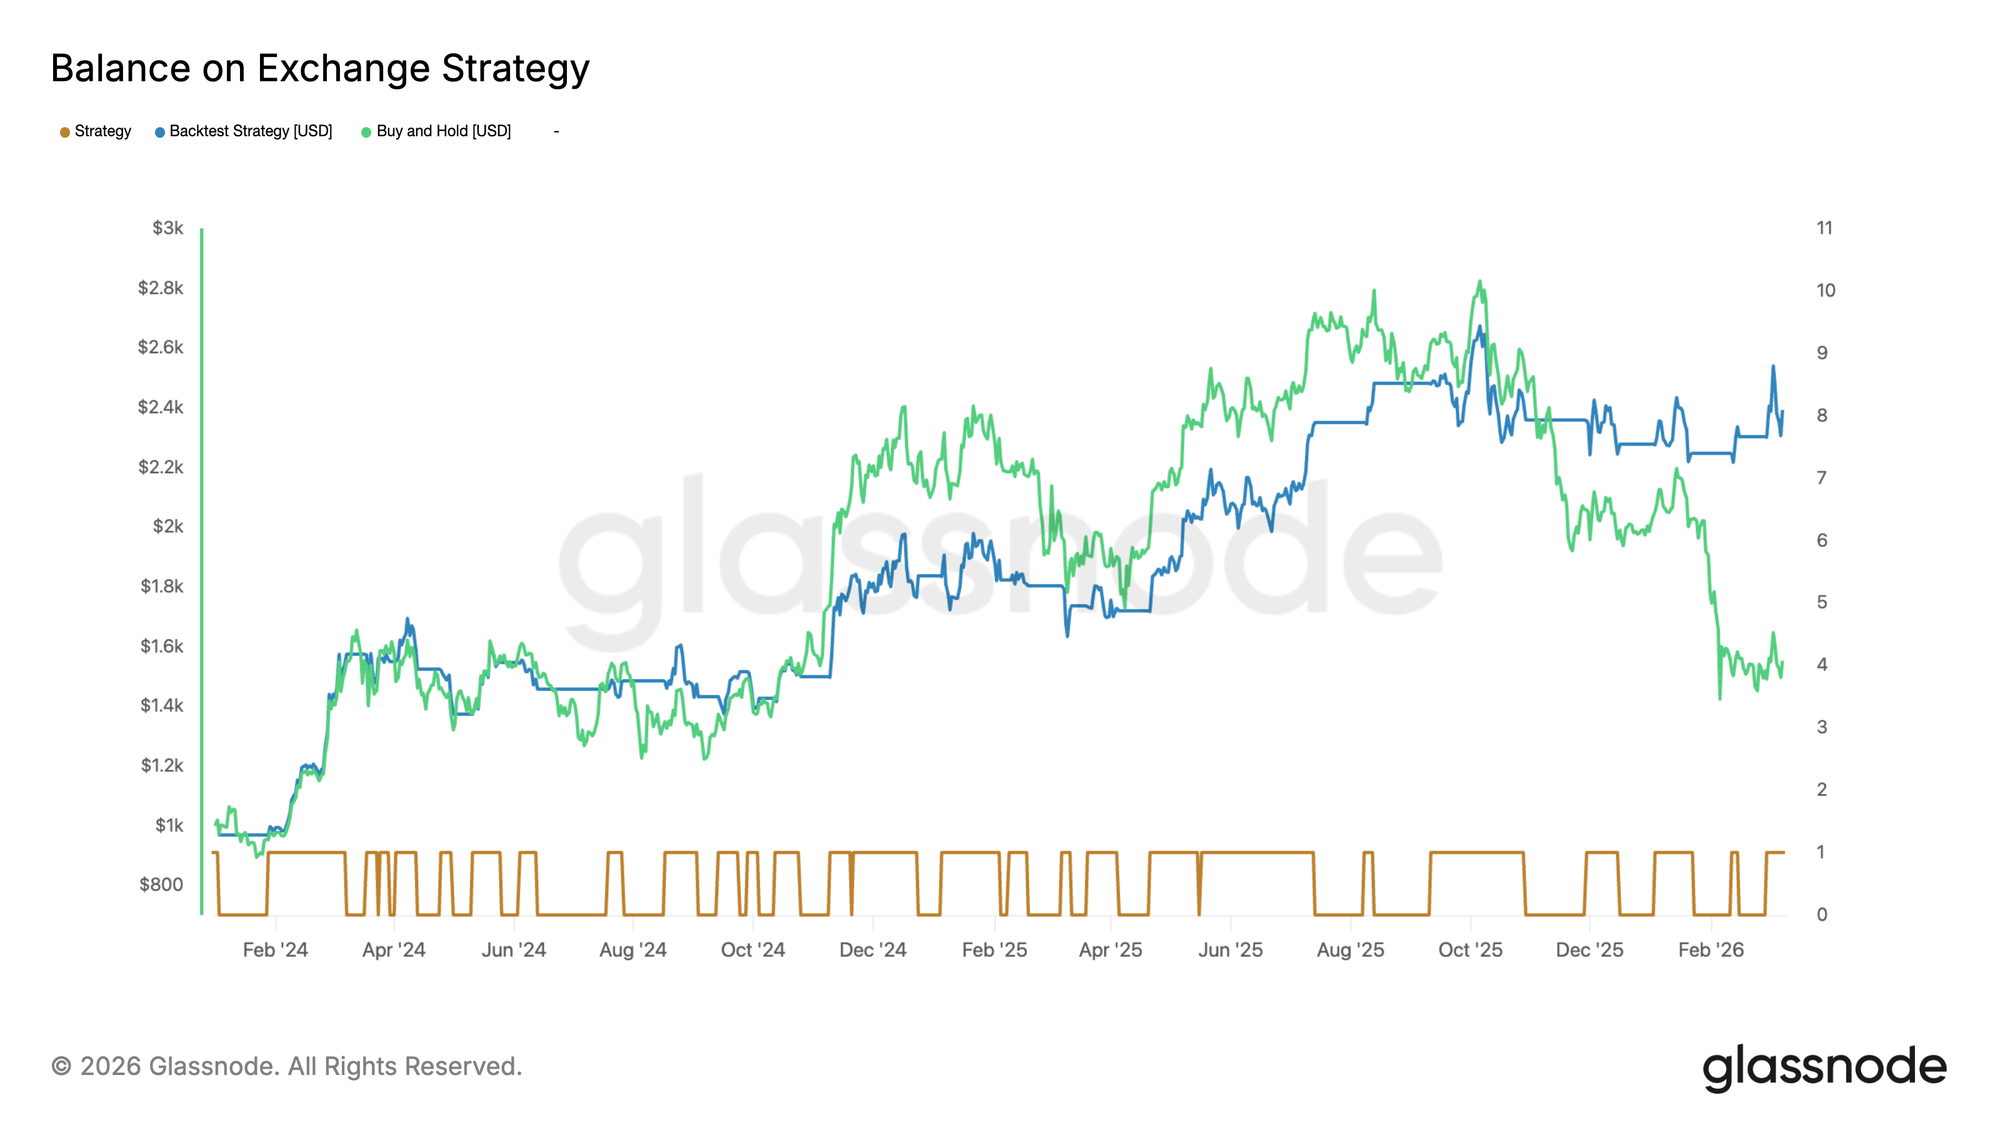
Here's how to read this chart:

🟫 The brown line at the bottom is the binary trading signal, toggling between in the market (1) and out of the market (0).

🟦 The blue line tracks the strategy's portfolio value over time.

🟩 The green line is the buy-and-hold portfolio benchmark.

We can observe that the exchange balance strategy performed reasonably well, although at times the buy-and-hold strategy outperformed it. In the final days of the research period, however, the exchange balance strategy caught up. While some investors may find the combination of reduced volatility and an ultimately comparable performance to buy-and-hold appealing, the final numbers are misleading – and here’s why.

The Problem: Data Mutation and Look-Ahead Bias

Metrics are not static. Many are retroactively revised as new information becomes available. This is particularly true for metrics that depend on address clustering or entity labeling, such as on-chain exchange balances. However, it is also the case for metrics such as trading volume or price, as individual exchanges can occasionally submit their data with slight delays.

This means that a value you see today for, say, January 15, 2024, may not be the same value that was published on January 15, 2024. The data has been revised with hindsight. When you backtest a strategy on this revised data, you are implicitly using information that was not available at the time the trading decisions would have been made. This introduces a look-ahead bias.

The Honest Backtest: Using Point-in-Time Data

Let's therefore repeat the exact same backtest – same signal logic, same parameters, same dates, same fees – but this time using the Point-in-Time (PiT) variant of the Exchange Balance metric, available in Glassnode Studio.

PiT metrics are strictly append-only and immutable. Each historical data point reflects only the information that was known at the time it was first computed. No retroactive revisions, no look-ahead bias.

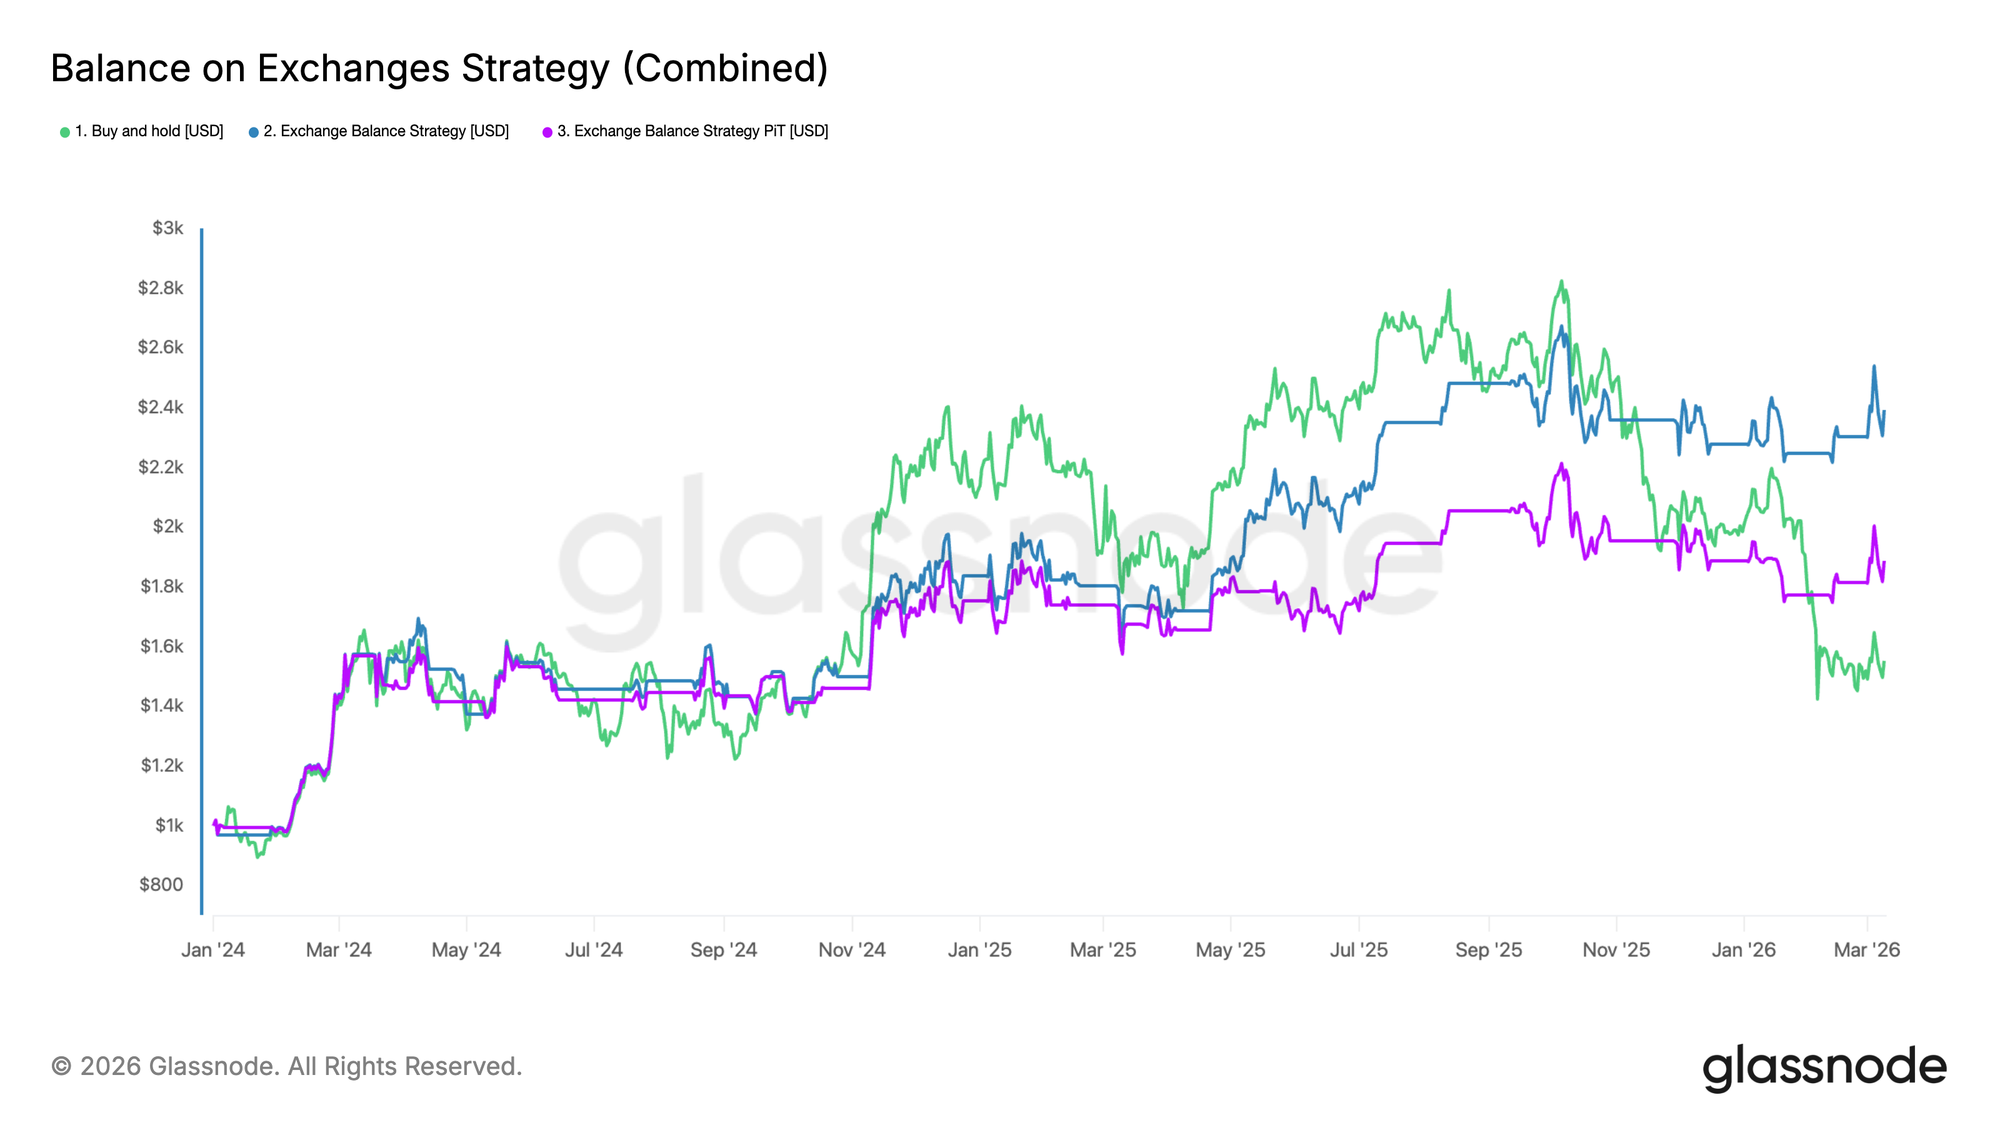
While we are using the same metric, the strategy now produces significantly different results, as illustrated by the purple line in the new chart below. The overall performance is notably worse.

Although both strategies behave similarly for much of 2024, we observe that the PiT-based version fails to capture the strong upticks in November 2024 and March 2025 as effectively. As a result, the cumulative performance diverges meaningfully and ends up considerably lower.
Access live chart

Key Takeaway

In this example, the purple strategy, which only has access to information as it was available at the time, performs noticeably worse. ► Backtests will lie if fed with wrong or revised data. Only immutable, Point-in-Time metrics ensure you’re replaying history as it actually happened.


Related Questions

QWhat is the main premise of the hypothetical trading strategy described in the article?

AThe strategy is based on the narrative that when coins leave exchanges, it is a bullish signal, as it indicates holders are moving to self-custody and reducing available supply. It enters the market when the 5-day moving average of Binance's BTC balance falls below its 14-day average and exits when it rises back above.

QWhat is the primary problem identified with using standard historical data for backtesting?

AThe primary problem is data mutation and look-ahead bias. Many metrics are retroactively revised as new information becomes available, meaning a backtest uses data that was not known at the time of the original trading decision, leading to inaccurate and overly optimistic results.

QWhat is Point-in-Time (PiT) data and how does it differ from standard data?

APoint-in-Time data is strictly append-only and immutable. Each historical data point reflects only the information that was known and published at that specific time, with no retroactive revisions. This prevents look-ahead bias in backtesting.

QHow did the performance of the strategy change when backtested with Point-in-Time data?

AThe performance was significantly worse. The PiT-based strategy failed to capture strong market upticks as effectively, leading to a meaningfully lower cumulative performance compared to the backtest using revised data.

QWhat is the key takeaway from the article regarding backtesting and data?

AThe key takeaway is that backtests will produce misleading results if they use revised data. Only immutable, Point-in-Time metrics ensure an accurate historical replay of what was actually knowable at the time, preventing look-ahead bias.

Related Reads

Global Market Share Survey: Japanese Firms Lead in Semiconductor Materials

Global Market Share Survey: Japanese Firms Lead in Semiconductor Materials According to the 2025 "Major Goods and Services Market Share Survey" by Nikkei, Japanese companies maintain strong positions in semiconductor-related materials. In silicon wafers, Shin-Etsu Chemical ranks first with a 26.3% share, followed by SUMCO at 17.8%. Together, they hold 44.1% of the market, widening their lead over competitors from Taiwan, Germany, and South Korea. In photoresists, Tokyo Ohka Kogyo, JSR, and Shin-Etsu Chemical occupy the top three spots, with a combined share of 60.5%. Despite their strength in materials, Japanese firms have a weaker presence in core semiconductor segments like DRAM and NAND flash memory, where South Korean and U.S. companies dominate. For instance, SK Hynix and Samsung lead in DRAM, while China’s CXMT doubled its share to 6% in 2025. The semiconductor market is projected to grow rapidly, with WSTS forecasting a 90% increase to $1.5112 trillion by 2026. Major players like Samsung, SK Hynix, and Micron are making massive investments to expand capacity. To maintain their edge in materials, Japanese companies must similarly commit to large-scale, risk-taking investments. In contrast, Japan’s automotive sector shows stagnation. Toyota remains the global leader but with only a slight share increase to 12.3%, while Japanese brands are absent from the top five in the EV market. In shipbuilding, Imabari Shipbuilding rose to third place globally with a 7.2% share, benefiting from large container ship deliveries. However, Chinese and South Korean firms dominate the sector, holding the top two positions. Japan aims to revitalize its shipbuilding industry through government and corporate efforts, targeting a near doubling of output by 2035. Addressing labor shortages and adopting advanced technologies like physical AI will be critical for competitiveness.

marsbit15m ago

Global Market Share Survey: Japanese Firms Lead in Semiconductor Materials

marsbit15m ago

STRC Major De-pegging's First Financial Report, How Will Strategy Repair Its Capital Flywheel?

Bitcoin treasury company Strategy released its Q2 2026 earnings report on July 31. Despite a 6.9% year-over-year revenue increase to $122 million, the company recorded a net loss of $8.22 billion, largely due to $8.32 billion in unrealized losses from Bitcoin price fluctuations. As of quarter-end, Strategy holds 843,775 BTC with an average cost of $75,000 per coin, and Bitcoin per share increased. The report highlights a critical shift in Strategy's capital model following the de-pegging of its key financing tool, STRC (Strategic Coin), which fell below its $100 target. Management's top priority is restoring STRC to its target value, aiming for a recovery by September 8. They rule out discounted STRC issuances and plan to maintain its dividend yield at 12%, instead focusing on bolstering its $3.75 billion cash reserve. Strategy has moved from a one-way "buy-and-hold" Bitcoin strategy to active capital management. This new approach, part of its "Digital Credit Capital Framework," involves flexibly managing its balance sheet across four elements: BTC, USD cash, common stock (MSTR), and digital credit securities like STRC. This allows for BTC monetization (having sold $218.4 million in BTC so far), strategic repurchases of discounted securities, and debt optimization, as seen with a $1.5 billion convertible bond buyback. The company's future hinges on two key tests: successfully re-pegging STRC to restore market confidence in its digital credit system, and a long-term recovery in Bitcoin's price to ultimately support its growth thesis.

marsbit1h ago

STRC Major De-pegging's First Financial Report, How Will Strategy Repair Its Capital Flywheel?

marsbit1h ago

STRC's First Financial Report Post-Depegging, How is Strategy Restoring the Capital Flywheel?

On July 31, 2026, Bitcoin treasury company Strategy released its Q2 financial report. Despite a 6.9% year-over-year increase in revenue to $122 million, the company recorded a substantial net loss of $8.22 billion, primarily due to $8.32 billion in unrealized losses from Bitcoin holdings. While Strategy's core Bitcoin strategy remains intact—its holdings grew 11% to 843,775 BTC—the company is undergoing a fundamental shift in its capital model. Following the de-pegging of its key financing tool, the STRCoin (STRC), from its $100 target in May, Strategy has pivoted from a one-directional "raise funds, buy Bitcoin" cycle to a more dynamic, multi-asset capital management approach. A key part of this new framework is the "Monetization Program," through which Strategy has sold approximately $218.4 million worth of BTC to bolster liquidity. The company's top priority is repairing STRC's peg, committing not to issue discounted shares until it returns to its target range. It has initiated a $1 billion buyback program for discounted digital credit securities, having repurchased $28.9 million face value of STRC so far. Management aims to restore the peg around September 8, 2026. Strategy now actively manages a matrix of assets: Bitcoin (for accumulation or strategic sales), USD cash reserves (now at $3.75 billion), common stock (MSTR), and digital credit securities like STRC. This allows for tactical moves like repurchasing discounted debt or equity to capture value. The future success of Strategy's "capital flywheel" hinges on two factors: the short-term ability to successfully re-peg STRC to restore market confidence in its digital credit system, and the long-term price trajectory of Bitcoin, upon which its entire investment thesis ultimately depends.

Odaily星球日报1h ago

STRC's First Financial Report Post-Depegging, How is Strategy Restoring the Capital Flywheel?

Odaily星球日报1h ago

Trading

Spot
活动图片