When Big Money Gets Serious, RWA Liquidity Issues Come to the Fore

Odaily星球日报Published on 2026-01-16Last updated on 2026-01-16

Abstract

Liquidity is the foundation of asset confidence, but the reality for tokenized real-world assets (RWA) like gold and stocks reveals a critical structural flaw. While tokenization promises enhanced capital fluidity and DeFi integration, most tokenized assets suffer from dangerously thin liquidity, making them impractical for meaningful capital deployment. Analysis shows extreme slippage in major tokenized gold assets (PAXG, XAUT). A $4 million trade incurs nearly 150 basis points (bps) of slippage on perpetual exchanges, compared to just 3 bps for a $20 million trade in traditional CME gold futures. Spot markets for these assets offer less than $3 million in effective depth. In AMM DEXs like Uniswap, average slippage consistently ranges between 25–50 bps, with individual trades experiencing premiums as high as 68%. The problem extends to tokenized equities. A $1 million trade in tokenized Tesla (TSLAx) sees ~5% slippage, while NVIDIA (NVDAx) reaches an unworkable 80%. Traditional markets handle the same trades with ~15 bps impact. This liquidity scarcity isn't just about high transaction costs; it destabilizes the entire market structure. Thin order books are prone to manipulation and price anomalies. A 10% price swing on a centralized exchange (CEX) can trigger cascading liquidations across interconnected DeFi protocols, demonstrating how localized illiquidity amplifies systemic risk. The core issue is structural. Market makers face high friction: slow, costly minting/red...

Author | @ballsyalchemist

Compiled | Odaily Planet Daily (@OdailyChina)

Translator | DingDang (@XiaMiPP)

Liquidity is the prerequisite for an asset to gain confidence. When the market has sufficient depth, large amounts of capital can be smoothly absorbed, whales can build positions freely, and assets can be used as reliable collateral. This is because lenders know they can exit at any time if needed. However, if the asset itself lacks liquidity, the situation is completely reversed. Shallow liquidity struggles to attract users, and a lack of users further compresses trading depth, ultimately forming a self-reinforcing "liquidity death spiral".

Tokenization was initially met with high hopes: it was seen as a key tool to enhance capital liquidity, unlock DeFi's financial utility, and bridge on-chain and off-chain assets. Ideally, trillions of dollars from traditional financial markets would be brought on-chain, allowing anyone to trade freely, use assets as collateral for loans, and perform combinations and innovations impossible in the traditional financial system within DeFi.

However, the reality is that beneath the surface prosperity, most tokenized assets operate in extremely fragile, illiquid markets that simply cannot support meaningful capital scales. The "liquidity", a prerequisite for financial composability and practical utility, has not truly materialized. These issues are not noticeable in small transactions, but once capital attempts to move at scale, the hidden costs and risks quickly become apparent.

The Current Liquidity Reality

The first hidden cost of tokenized assets is reflected in slippage.

Taking tokenized gold as an example, the chart below compares the expected slippage for different trade sizes between major centralized exchanges and the traditional gold market. The difference is striking.
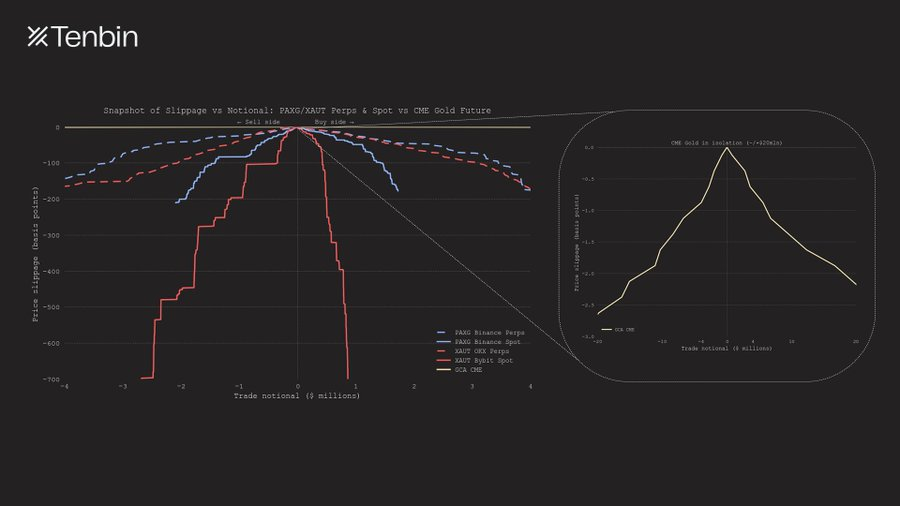
PAXG / XAUT Perps & Spot vs CME Deliverable Gold Futures: Trade Size vs Slippage

As trade size increases, the slippage for PAXG and XAUT perpetual contracts rises rapidly and exponentially. At a nominal trade size of approximately $4 million, slippage approaches 150 basis points. In contrast, the CME's slippage curve is almost flush with the horizontal axis, barely noticeable.

At the spot market level, the liquidity constraints for PAXG and XAUT are even more apparent. Even when selecting their most liquid spot trading venues, the effective depth provided by their order books on either the buy or sell side is less than $3 million. This liquidity ceiling is directly reflected in the curve "cutting off" prematurely at smaller trade sizes.

The right side separately shows the CME's slippage curve. Its nearly flat shape直观地反映了传统市场的深度优势。即便交易规模远超 400 万美元,预期滑点依然保持高度稳定。一笔 2000 万美元规模的黄金期货交易,价格冲击甚至不足 3 个基点。从量级上看,CME 的流动性深度,远非加密市场中任何同类产品可比。

This difference has direct consequences. In deep traditional markets, even large trades have a negligible price impact;而在代币化资产的浅薄市场中,同样的操作会立刻产生可观成本,且平仓难度会随着规模迅速上升。The comparison of average daily trading volume below clearly shows this gap, and this problem is not unique to the gold market; it applies to other assets as well.
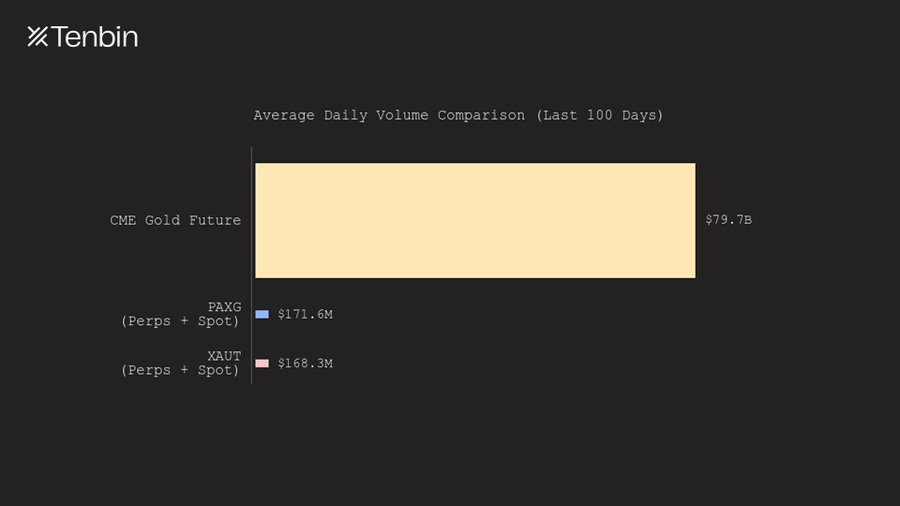
CME Gold Futures vs PAXG / XAUT Perps & Spot: Average Daily Volume Comparison

The above discussion mainly focuses on CEXs. So, what about AMM DEXs? The answer is恰恰相反, it only gets worse.

For example, in a February 2025 XAUT transaction, a user spent 2,912 USDT but only received XAUT worth approximately $1,731 at the real gold price at the time, effectively paying a premium of up to 68% for this trade.
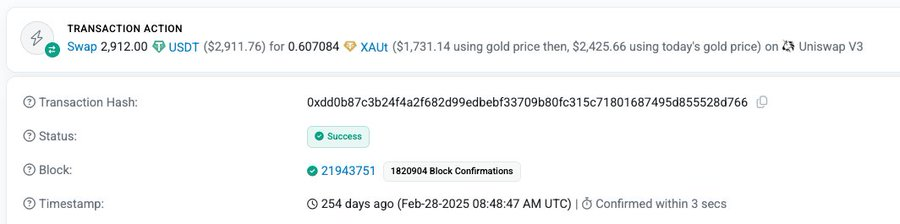
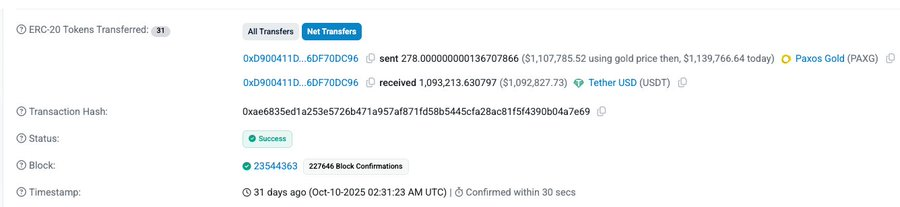
In another transaction, a user exchanged PAXG worth approximately $1.107 million (at the then gold price) for 1.093 million USDT, with a slippage of about 1.3%. Although the slippage is not as extreme as the previous case, when price impact in traditional markets is typically measured in single-digit basis points, this level of slippage is still unacceptably high.
Furthermore, over the past six months or so, the average slippage for XAUT and PAXG trades on Uniswap has consistently remained in the range of 25–35 basis points, and even exceeded 50 basis points during certain periods.
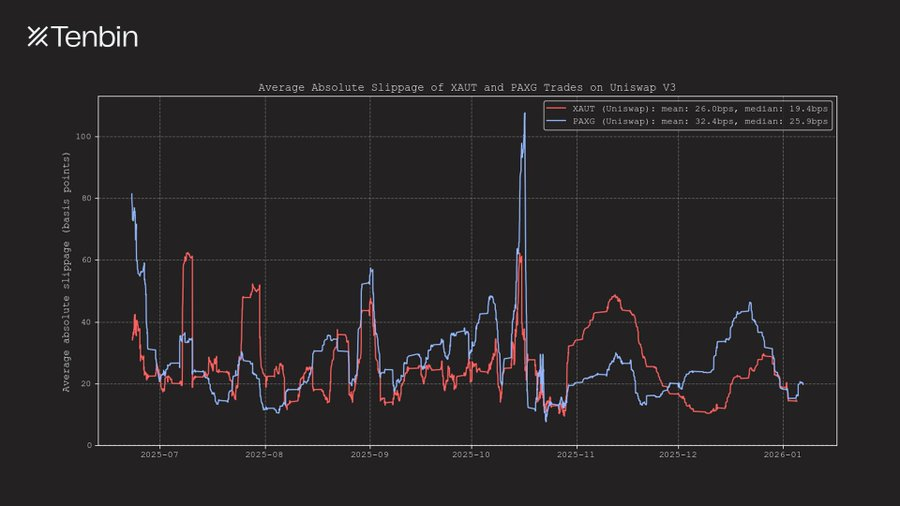
Average Absolute Slippage for XAUT & PAXG on Uniswap V3

This article uses gold as the primary analysis object because it is currently the largest non-dollar, non-credit tokenized asset on-chain. But the same problems appear in the tokenized stock market as well.
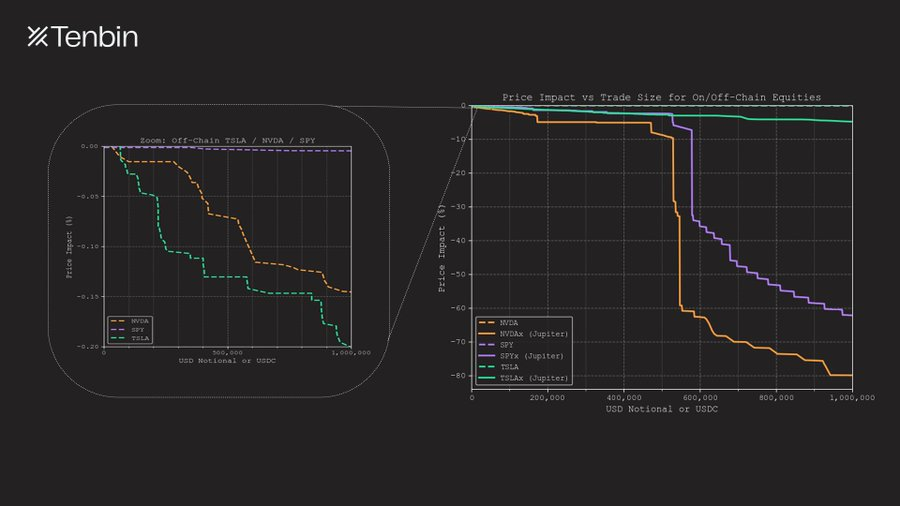
NVDAx / TSLAx / SPYx vs Nasdaq NVDA / TSLA / SPY: Trade Size vs Slippage

TSLAx and NVDAx are among the top tokenized stocks by market cap. On Jupiter, a $1 million TSLAx trade has a slippage of about 5%; while NVDAx's slippage is as high as 80%,几乎失去可交易性. In contrast, in traditional markets, a trade of the same size in Tesla or Nvidia stock has a price impact of only 18 basis points and 14 basis points respectively (this doesn't even include off-exchange liquidity like dark pools).

These costs are easy to ignore in small trades, but once the trade size increases, they become unavoidable. Illiquidity translates directly into real losses.

Why is the Tokenized Market More Dangerous?

The problems caused by illiquidity extend beyond just transaction costs; they directly破坏market structure itself.

When market liquidity is thin, the price discovery mechanism becomes fragile, order book noise increases significantly, and oracle data sources are affected by this noise. In highly interconnected systems, even极小规模的交易 can trigger huge chain reactions.
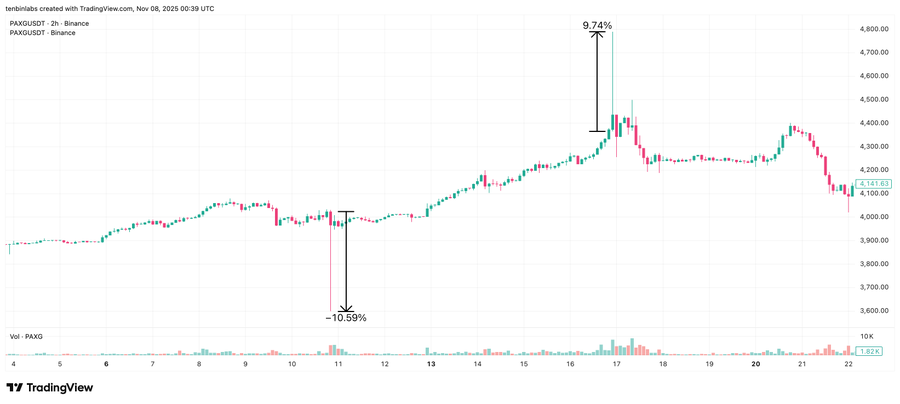
In mid-October 2025, PAXG on the Binance spot market experienced two noticeable "anomalous" events within a week. On October 10th, the price dropped 10.6%; on October 16th, it surged 9.7%. Both fluctuations quickly returned to their original positions, almost certainly not caused by fundamental changes but rather a direct manifestation of order book fragility.

Because the tokenized asset ecosystem is highly interconnected, this instability is not confined to a single exchange. Binance spot holds the highest weight in Hyperliquid's oracle construction, so during these two anomalous fluctuations, $6.84 million in long positions and $2.37 million in short positions were liquidated on Hyperliquid—a liquidation规模甚至超过了 Binance 自身.

This result is concerning. It shows that a single illiquid market is enough to amplify and propagate volatility across multiple trading venues. In extreme cases, this structure could even increase the risk of oracle manipulation. Even traders who never participated in the original spot market could passively suffer losses due to liquidations, price distortions, and widening spreads.

Ultimately, all these problems stem from the same fact: the primary market lacks real, scalable liquidity.
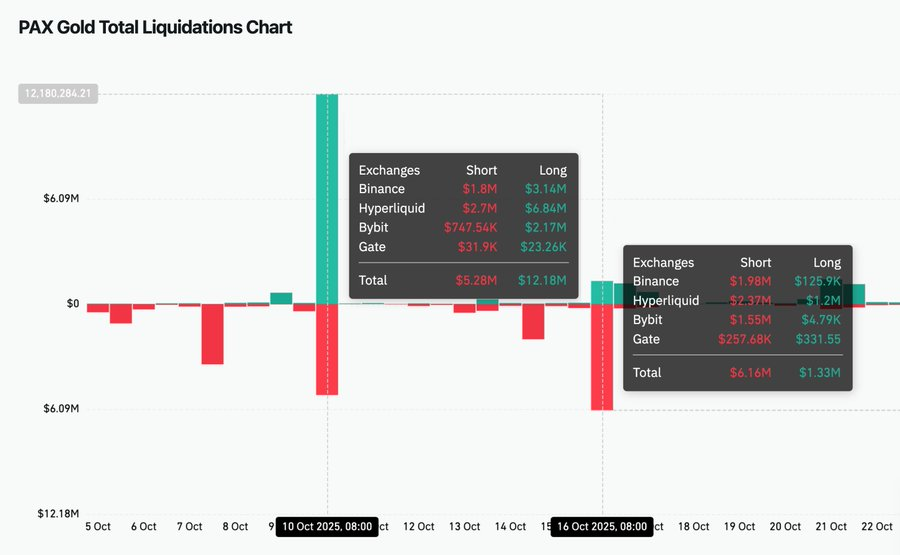
PAXG Liquidation Chart on Coinglass

Illiquidity is a Structural Problem

The liquidity shortage for tokenized assets is a structural problem.

Liquidity does not automatically appear just because an asset is tokenized. It relies on the continuous supply from market makers, who themselves are subject to strict capital constraints. They allocate capital to markets where inventory can be turned over efficiently, risks can be continuously hedged, and positions can be exited with minimal time and cost friction.

Most tokenized assets恰恰在这些关键维度上难以满足要求.

First, for market makers to provide liquidity, they must first complete the asset minting process. But in reality, minting itself comes with explicit costs. Issuers typically charge minting and redemption fees ranging from 10–50 basis points;同时, the minting process often involves operational coordination, KYC checks, and settlement through custodians or brokers, rather than direct on-chain execution. Market makers need to advance funds and wait for hours or even days to actually receive the tokenized asset.

Second, even after inventory is generated, it cannot be redeemed instantly. The redemption cycle for most tokenized assets is measured in "hours or days", not seconds. Common redemption rules are T+1 to T+5, accompanied by daily or weekly quota limits. For larger positions, a complete exit often takes several days or even longer.

From a market maker's perspective, this type of inventory is largely equivalent to "illiquid assets" that cannot be quickly recovered and redeployed.

To maintain market depth, market makers must hold inventory over a longer周期, continuously bearing price volatility risk and hedging, while waiting for redemptions to complete. During this time, the same capital could have been deployed to other crypto markets—where little inventory is needed, hedging is continuous, and positions can be closed at any time. Precisely because of this, the opportunity cost is particularly high in the crypto market.

Faced with this trade-off, rational liquidity providers naturally choose to allocate capital to other markets.

The existing market structure is also insufficient to solve this problem. AMMs transfer inventory risk to liquidity providers but do not eliminate redemption constraints; while order book-based trading venues fragment market maker liquidity across multiple exchanges, further weakening overall depth.

The end result is persistently insufficient liquidity, creating a vicious cycle. Illiquidity discourages participation, and lack of participation in turn further削弱流动性. The entire tokenized asset ecosystem is thus trapped in this cycle.

A New Market Structure

Illiquidity is a structural obstacle restricting the scaled development of tokenized assets.

Shallow market depth cannot support practically meaningful position sizes, and a fragile market structure amplifies and transmits local volatility to different protocols and trading venues. Assets that cannot be exited smoothly under predictable conditions自然也难以作为可信的抵押品. Under the mainstream tokenization model today, liquidity is chronically constrained, and capital efficiency remains low.

For tokenized assets to truly become usable at scale, the market structure itself must change.

What if the price discovery and liquidity supply for an asset could be directly mapped from off-chain markets, rather than being rediscovered and cold-started on-chain? What if users could access tokenized assets at any trade size without forcing market makers to hold illiquid inventory long-term? What if the redemption mechanism was fast enough, with clear paths and no restrictions?

Asset tokenization has not failed due to the technical path of "putting assets on-chain".

Where it has truly failed is that—the market structure supporting these assets was never truly established.


Related Questions

QWhat is the main issue highlighted in the article regarding tokenized assets?

AThe main issue is the severe lack of tokenized assets, which leads to high slippage, fragile market structure, and an inability to support meaningful capital scale, ultimately hindering their practical utility in DeFi.

QHow does the slippage for large trades in tokenized gold (like PAXG/XAUT) compare to traditional markets (CME)?

AFor a trade size of around $4 million, slippage for PAX gold perpetual contracts can reach nearly 150 basis points, whereas CME gold futures show almost negligible slippage, with a $20 million trade impacting prices by less than 3 basis points.

QWhy are tokenized markets considered more dangerous than traditional markets in terms of market structure?

ATokenized markets are more dangerous because their thin liquidity makes price discovery fragile, order book noise amplifies volatility, and oracle data can be corrupted. This can cause cascading effects like cross-exchange liquidations, even for traders not involved in the original market.

QWhat are the structural reasons behind the liquidity shortage in tokenized assets?

AThe liquidity shortage is structural due to high minting/redemption fees (10-50 bps), slow redemption cycles (T+1 to T+5), and capital constraints on market makers. This makes inventory illiquid and costly to hold, discouraging liquidity provision compared to other crypto markets.

QWhat fundamental change does the article suggest is needed for tokenized assets to achieve scalability?

AThe article suggests a new market structure is needed where price discovery and liquidity are sourced directly from off-chain markets, rather than being rebuilt on-chain. This would allow users to access tokenized assets at any scale without forcing market makers to hold illiquid inventory, supported by fast and unrestricted redemption mechanisms.

Related Reads

From Gold to Bitcoin: Fixed Supply + Institutional Frenzy, Might It Repeat the 'Explosive' Price Trend?

"From Gold to Bitcoin: Fixed Supply and Institutional Frenzy May Lead to 'Explosive' Price Rally Analysts suggest Bitcoin's price action could mirror gold's over the past two decades, following the launch of spot Bitcoin ETFs. Gold ETFs, introduced in 2004, drove gold's price surge to a current market cap near $28 trillion. Both gold and Bitcoin are non-yielding stores of value, with prices driven purely by investor sentiment rather than cash flows or credit. Gold ETFs experienced dramatic cycles: explosive growth, painful drawdowns, and slow recoveries, with each cycle reaching higher peaks. Bitcoin ETFs, approved in early 2024, saw rapid institutional adoption but are now facing similar volatility. Recent warnings highlight the risk of significant ETF outflows disrupting the current rebound. BlackRock's IBIT, a leading Bitcoin ETF, has sold nearly 100,000 BTC to meet redemptions while still holding over 733,000. The core parallel is fixed supply: when demand surges, prices explode, but demand is often volatile and wave-like, not steady. Institutional interest, through ETFs and corporate adoption, remains a key support pillar, helping to cushion sell-offs. If Bitcoin captures even a fraction of gold's role as a store of value, its upside potential is immense, though the path will be marked by high volatility. For investors, focusing on long-term trends and managing risk is crucial as this 'price explosion' narrative unfolds."

Foresight News14m ago

From Gold to Bitcoin: Fixed Supply + Institutional Frenzy, Might It Repeat the 'Explosive' Price Trend?

Foresight News14m ago

Why Is AI Agent Shopping Hard to Popularize?

The article argues that the popular narrative of "AI agent shopping" – equipping AI with a wallet to autonomously handle purchases – is fundamentally flawed and oversimplifies the complexity of shopping. It deconstructs shopping into two core actions: **information retrieval** (standardized, easily automated) and **value judgment** (deeply subjective and human-centric). The narrative mistakenly assumes AI can fully handle both. Value judgment itself has two layers: **evaluation** (assessing options against criteria) and **demand definition** (setting the criteria, weights, and values). The latter is inherently human and dynamic, as preferences are not fixed but constructed during the decision-making process ("constructive preferences"). The real dividing line for automation is not product standardization, but whether the **act of choosing** itself holds experiential value. For mundane purchases (e.g., printer paper), full AI delegation works. For experiential goods (e.g., wine, furniture), the joy of selection is core to consumption, so AI should act as an assistant that narrows options, leaving the final choice to humans. The "AI wallet" concept confuses three separate elements: decision-making, execution, and fund custody. Current payment industry solutions (e.g., from Stripe, Mastercard, Google, Visa) show that limited, scoped payment authorization tokens are sufficient for most consumer scenarios, not full fund custody. The true use case for autonomous AI wallets is in **B2B procurement** and **machine-to-machine (M2M) settlements** for standardized, high-frequency, low-value transactions. The real bottlenecks for AI shopping are not payment technology, but **1) the lack of trusted data sources** (e.g., fake reviews, counterfeit goods) and **2) the impossibility of automating human demand definition**. The conclusion is that the focus should be on safely automating the assessment and filtering process while reserving for humans the rights to define their criteria and enjoy the final act of choice. For experiential goods, the platform's competitive advantage shifts to providing a superior selection experience.

Foresight News1h ago

Why Is AI Agent Shopping Hard to Popularize?

Foresight News1h ago

After Nine Months of Shorting, a Full Turn to Long: Renowned Trader Opens Bitcoin Positions Around 64K, Crypto Market Long-Short Divergence Intensifies

After nine months of being short, prominent crypto trader Doctor Profit has closed all his bearish positions and started buying Bitcoin near $64,000, signaling a complete bullish reversal. He argues that structural market changes—such as impending U.S. regulation (CLARITY Act) and institutional adoption via securities tokenization—are rewriting the traditional four-year cycle script, potentially bringing the market bottom forward from the widely expected September/October timeframe. This view finds some technical support from on-chain analyst gumsays, who notes a bullish divergence on Bitcoin's weekly chart has persisted for 147 days, nearing the 161-day duration seen before the 2022 cycle low. However, cycle researcher Jake Pahor presents a counter-argument based on historical data. Analyzing patterns since 2014, he identifies three common features of past bear market bottoms: a ~12-month duration from peak to trough, a sustained period of extreme fear (with a proprietary risk score below 20), and the price falling below Bitcoin's realized price (~$53,000 currently). The current cycle, only nine months from its October 2025 peak, meets none of these conditions. The debate highlights a market torn between "front-running" a potential early bottom driven by new fundamentals and waiting for confirmation through traditional on-chain and sentiment metrics. While Doctor Profit opts for aggressive buying, Pahor maintains a disciplined, tiered accumulation strategy, continuing weekly buys at current risk levels but reserving larger orders for if more extreme fear emerges.

marsbit1h ago

After Nine Months of Shorting, a Full Turn to Long: Renowned Trader Opens Bitcoin Positions Around 64K, Crypto Market Long-Short Divergence Intensifies

marsbit1h ago

Senior Trader's Confession: How to Trade Market's False Expectations?

Veteran trader's case study: trading the market's "wrong expectations". This trade centered on a textbook "expectation error" after a weak CPI report. While the market initially priced in broad monetary easing (sending Nasdaq to 30,060), the crucial 30-year real yield hit a 20-year high. This signaled a fractured transmission mechanism: short-term rates eased, but long-term funding costs (vital for tech valuations) refused to fall. The trader executed five short positions on the Nasdaq (NQ) as it fell from 30,060 to 28,768. The core methodology: don't just trade the data, but analyze the market's implied causal chain and identify where it breaks. In this case, the chain was: Weak CPI → Policy Easing → Lower Long-Term Funding Costs → NQ Valuation Expansion. The break occurred between policy easing and long-term rates. The "veto variable" – long-term real yields – refused to confirm the bullish narrative. Trades were structured around "fast variables" (price) temporarily repairing while "slow variables" (funding conditions) remained broken. The article outlines a repeatable framework: 1) Map the market's implied causal chain. 2) Identify the veto variable. 3) Observe if it rejects the narrative. 4) Enter when price still follows the old script. 5) Choose the cleanest asset expression (e.g., short NQ, not broad S&P). 6) Define both invalidation and fulfillment exit conditions. The key insight: Alpha often comes not from an information edge, but from a "reaction function edge" – recognizing when the market is applying an outdated causal logic to new data. The critical question: What causal chain is the market's first reaction relying on, and is that chain still valid today?

marsbit2h ago

Senior Trader's Confession: How to Trade Market's False Expectations?

marsbit2h ago

Trading

Spot
活动图片