The market never lies; it simply remains silent.
When prices linger in critical zones, both bulls and bears are waiting for an answer.
Over the past week, Bitcoin completed the wide-range oscillation we previously predicted within the core zone of $79,500 to $80,600. The market's price action has validated the effectiveness of our technical logic. However, validation is merely the starting point; the real game begins this week.
BTC's daily chart correction structure stands at a crossroads with three diverging paths: Is it the starting point of a new rising wave, or a midpoint in a larger-scale correction? Wave analysis can provide a framework, but the market ultimately votes with its price. Regarding HYPE, its seven-wave structure is clearly discernible. Whether it can break through the key level around $45.76 will become the variable most worth watching closely this week.
In this week's article, we will continue to approach from a multi-timeframe perspective, analyzing the structure, judging the direction, and formulating plans. Strategy is ready; discipline is self-held.
Summary of Core Trading Views for This Week:
• Analysis of BTC's Multi-Timeframe Price Structure (Detailed in Part One)
• BTC Market Forecast and Mid-/Short-Term Trading Strategies for This Week. (Detailed in Part Two)
• Analysis of HYPE's Daily Chart Price Structure. (Detailed in Part Three)
• HYPE Market Forecast and Short-Term Trading Strategies for This Week. (Detailed in Part Four)
Market Validation of Last Week's Trading Strategy and Core Views:
• Validation of BTC Market Forecast: In last week's article, we pointed out that we should focus on observing the battle between bulls and bears over the core zone of $79,500 to $80,600 and judged that the market was likely to experience wide-range oscillation there. Current market movements have largely validated our previous view.
One: Analysis of Bitcoin's Multi-Timeframe Price Structure
1. Analysis of BTC's Daily Chart Price Structure: (Three Scenarios for BTC's Subsequent Wave Structure)
Bitcoin _ Daily Candlestick Chart:
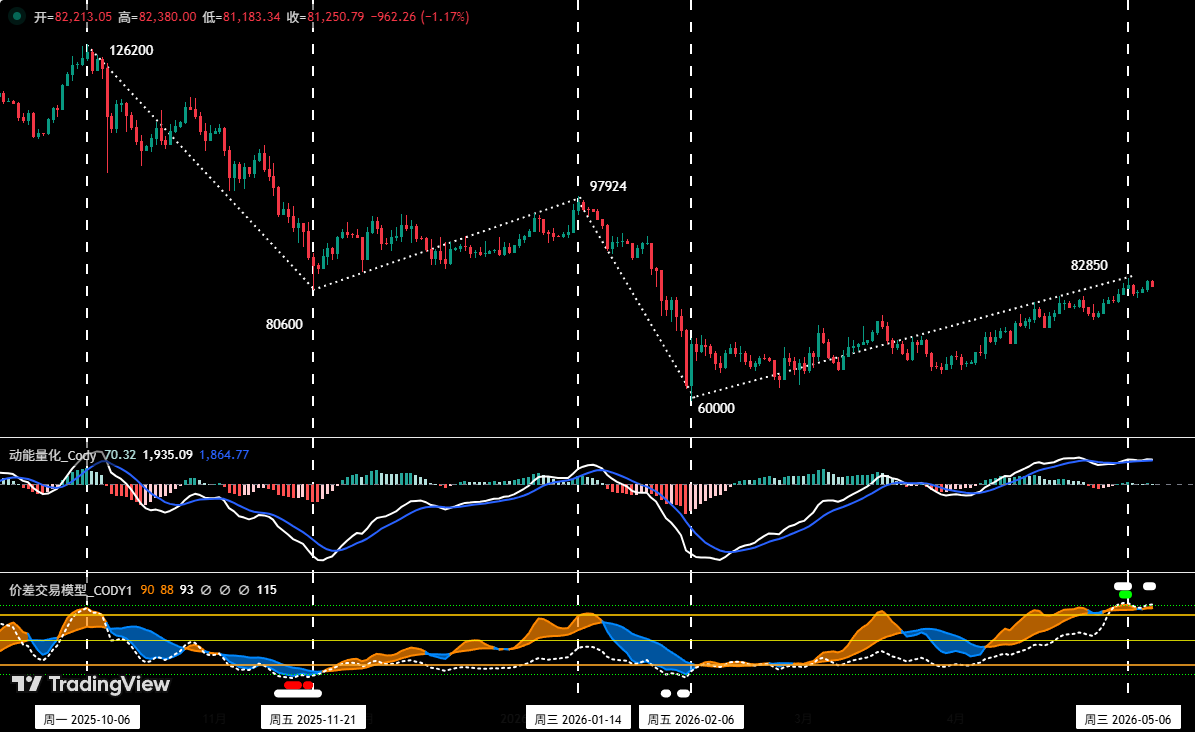
Chart One
As shown in (Chart One), since reaching the high of $126,200 in October 2025, Bitcoin has entered an adjustment cycle lasting about 7 months (216 days). There is significant divergence in the market regarding the subsequent direction. The bearish view argues that the downtrend is not over yet; after the recent rebound concludes, the price will still correct and break below the $60,000 low. The bullish view believes that the adjustment starting from $126,200 ended at $60,000, marking a reversal of the correction trend. The rebound since February is the start of a new upward trend. Next, we will analyze this daily chart correction structure based on Elliott Wave Theory rules and propose three technical scenarios for the subsequent movement for your reference.
1. Scenario One: Adjustment Concluded, New Rising Wave Initiated (Bullish View)
This view holds: The daily-level adjustment starting from the previous high of $126,200 is an A-B-C three-wave structure, with Wave C ending at $60,000. Currently, Major Wave I (the initial rising wave) is underway.
• Wave A (Decline): $126,200 (2025-10-06) to $80,600 (2025-11-21), lasting 46 days, maximum decline ~36%.
• Wave B (Rebound): $80,600 (2025-11-21) to $97,924 (2026-01-14), lasting 54 days, maximum increase ~21.5%.
• Wave C (Decline): $97,924 (2026-01-14) to $60,000 (2026-02-06), lasting 23 days, maximum decline ~38.7%.
• Major Wave I (Initial Rising Wave): $60,000 (2026-02-06) to present, has run for 94 days, maximum increase ~38.1% so far, still ongoing.
• Potential Major Wave II (Correction Wave): The adjustment wave to run after Major Wave I ends. Its low point will not break below $60,000.
2. Scenario Two: Complex Five-Wave Adjustment Structure, Currently in Wave D Rebound (Bearish View One)
This view holds: The daily-level adjustment starting from the previous high of $126,200 may complete as an A-B-C-D-E five-wave structure. Currently, Wave D rebound is underway.
• Wave A (Decline): $126,200 (2025-10-06) to $80,600 (2025-11-21), lasting 46 days, maximum decline ~36%.
• Wave B (Rebound): $80,600 (2025-11-21) to $97,924 (2026-01-14), lasting 54 days, maximum increase ~21.5%.
• Wave C (Decline): $97,924 (2026-01-14) to $60,000 (2026-02-06), lasting 23 days, maximum decline ~38.7%.
• Wave D (Rebound Wave): $60,000 (2026-02-06) to present, has run for 94 days, maximum increase ~38.1% so far, still ongoing.
• Potential Wave E (Decline Wave): The correction wave to run after Wave D rebound ends. Its low point may break below $60,000.
3. Scenario Three: Larger-Level Adjustment Structure (e.g., Weekly), Currently in Wave B Rebound (Bearish View Two)
This view holds: The daily-level adjustment starting from the previous high of $126,200 may be part of a larger-level A-B-C three-wave adjustment structure. Currently, Wave B rebound is underway.
• Wave A (Decline): $126,200 (2025-10-06) to $60,000 (2026-02-06), lasting 112 days, maximum decline ~52.5%.
• Wave B (Rebound Wave): $60,000 (2026-02-06) to present, lasting 94 days, maximum increase ~38.1% so far, still ongoing.
• Potential Wave C (Decline Wave): The correction wave to run after Wave B rebound ends. Its low point may break below $60,000.
4. Summary:
• From the perspective of Elliott Wave time rules and pattern harmony, in Scenario Two, Waves B and D are rebound waves of the same degree. However, the current Wave D rebound cycle (94 days) has significantly exceeded the Wave B rebound cycle (54 days). Therefore, due to the excessive extension of Wave D in the time dimension, it disrupts the balance of the wave structure, thereby significantly reducing the probability of this scenario occurring.
• Based on the above analysis, if Scenario Two is excluded, the probability of the market choosing Scenario One (bullish) and Scenario Three (bearish) increases accordingly. As for which of the two has a higher probability, it involves a comprehensive judgment of multiple dimensions, which we will delve into in the next weekly review.
2. In-depth Analysis of BTC's Hourly Chart Structure: (Using the 4-hour chart as the analysis timeframe)
Bitcoin _ 4-hour Candlestick Chart
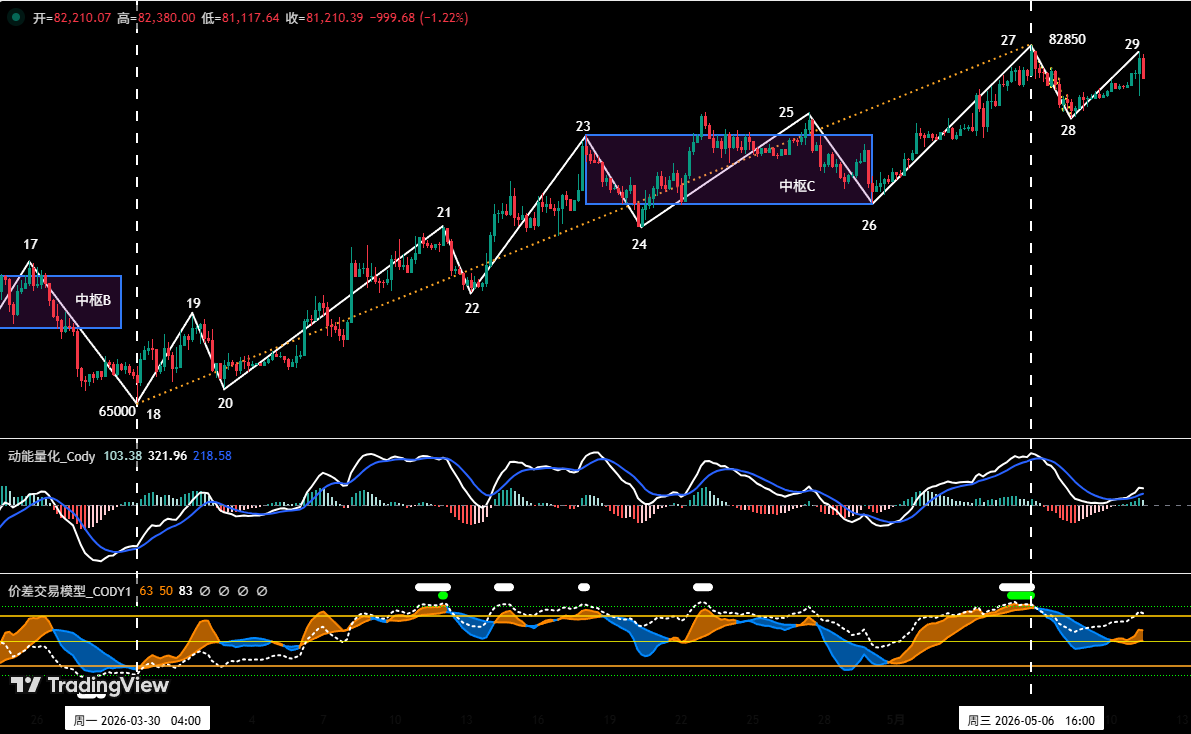
Chart Two
As shown in (Chart Two), the price is currently above central pivot C and is developing segment 28-29.
• If the price effectively holds support above the upper boundary of central pivot C (around $78,500), the high-range wide oscillation pattern will be maintained.
• If the price effectively breaks below the lower boundary of central pivot C (around $75,000), a daily-level correction may initiate.
Two: Bitcoin's Market Forecast and Trading Strategies for This Week
1. BTC Market Forecast for This Week:
Core view this week: The key to this week's movement lies in observing the battle between bulls and bears over the upper and lower boundaries of central pivot C. The gain or loss of this area can serve as an important basis for judging whether the price can continue its rebound or turn downward for adjustment.
2. Core Resistance Levels:
• First Resistance Zone: $83,500~$84,500 region (previous area of concentrated bulls/bears transactions)
• Second Resistance Zone: $89,000~$90,500 region (previous consolidation platform)
3. Core Support Levels:
• First Support Level: $78,500~$79,500 region (near the upper boundary of the central pivot)
• Second Support Level: $73,500~$75,000 region (previous important support level)
• Third Support Level: $69,500~$70,500 region (previous important support level)
4. Trading Strategies for This Week (Excluding Impact of Sudden News)
1. Mid-term Strategy:
Bitcoin _ Daily Candlestick Chart: (Position Monitoring Model)
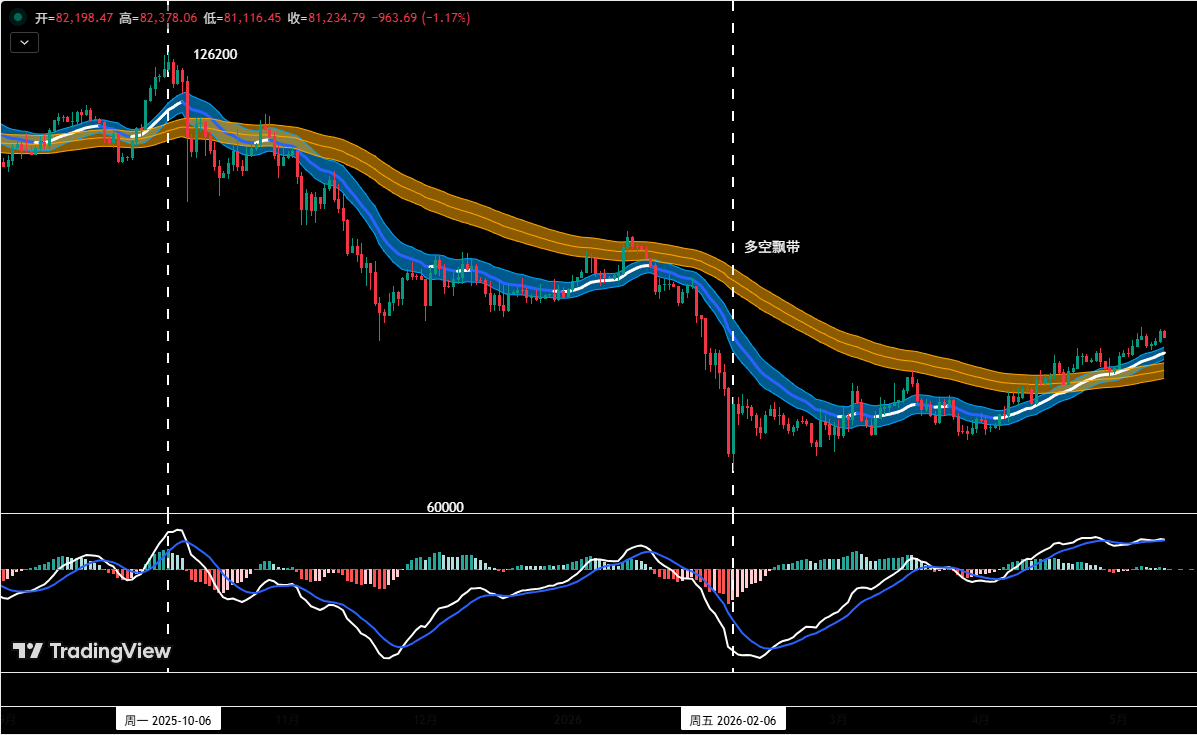
Chart Three
Position Monitoring Model: As shown in (Chart Three), based on trading rules, the market's mid-term direction is not yet clear. This week, the mid-term strategy is to maintain a cash position and wait patiently, avoiding chasing rallies or selling off in panic, until the direction becomes clear before entering positions.
2. Short-term Strategy: Use 30% of capital, set stop-loss points, and look for "price difference" opportunities based on support and resistance levels. (Use 30-minute/60-minute charts as the operation timeframe).
3. In short-term operations, to dynamically respond to the market's complex evolution, we have prepared two specific operation plans in advance, A/B.
• Plan A: Effective Holding Above, Go Long on Dips.
• Entry: When the price effectively holds above the $78,500~$79,500 region and combines with bottom signals from the quantitative model, a long position below 20% can be established.
• Risk Control: Initial stop-loss set below $78,500.
• Exit: When rebounding near important resistance levels and combined with model signals, gradually close positions to take profits.
• Plan B: Effective Break Below Support, Go Short on Rallies.
• Entry: When the price effectively breaks below the $73,500~$75,000 support region and combines with top signals from the model, a short position below 30% can be established.
• Risk Control: Initial stop-loss set above $76,500.
• Exit: When declining to important support levels and combined with model signals, gradually close positions to take profits.
Three: Analysis of HYPE's Daily Chart Price Structure:
HYPE_ Daily Candlestick Chart
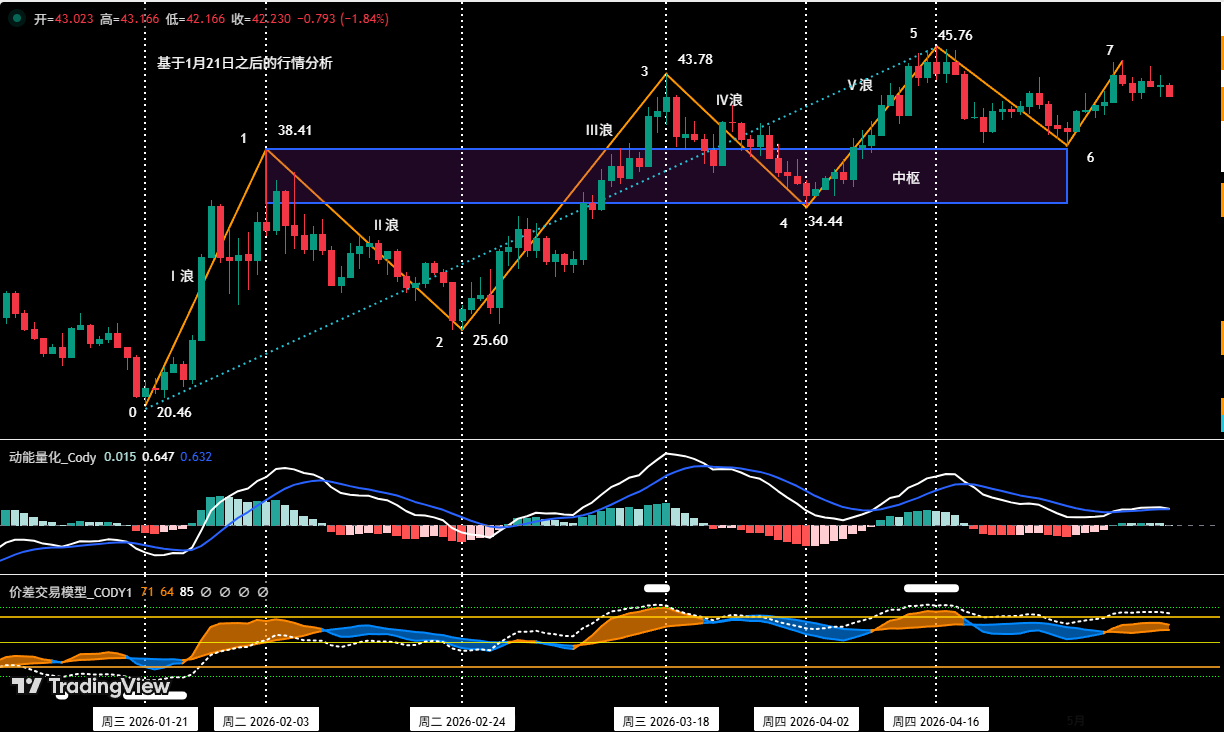
Chart Four
1. As shown in (Chart Four), the uptrend of HYPE starting from the low of $20.46 on January 21 can be divided into a seven-segment structure in the daily chart: 0-1, 1-2, 2-3, 3-4, 4-5, 5-6, 6-7. In the first five segments, prices continuously made new highs, forming a volatile rising structure. In the last two segments, because endpoint 7 ($44.79) is lower than endpoint 5 ($45.76), it is currently viewed as a correction structure.
2. (Chart Four) shows that because the price movements of segments 1-2, 2-3, and 3-4 overlap with each other, they together form an "uptrend central pivot."
Four: HYPE's Market Forecast and Short-Term Trading Strategies for This Week
1. HYPE Market Forecast for This Week:
Core view on HYPE this week:
• Focus on observing whether the price can break through the previous high of $45.76 in subsequent movements. A breakout would indicate the current movement is still within the daily-level uptrend structure.
• Pay attention to the battle between bulls and bears near the upper and lower boundaries of the central pivot.
2. HYPE Short-Term Trading Strategies for This Week:
• This week's short-term operations will be formulated based on the gain or loss of the two key price levels: the upper boundary of the central pivot ($38.41) and the lower boundary of the central pivot ($34.44).
• Long Strategy: If the price retraces to near $38.41, finds support, shows signs of stabilization, and combines with bottom signals triggered by the two major models, consider a light long position. Position size must be controlled below 30%, and stop-loss discipline must be strictly observed.
• Short Strategy: If the price effectively breaks below the support near $34.44 and combines with top signals triggered by the two major models, consider a light short position. Position size must be controlled below 30%, and stop-loss discipline must be strictly observed.
Five: Special Reminders:
1. When opening a position: Immediately set the initial stop-loss level.
2. When profit reaches 1%: Move the stop-loss to the entry cost price (breakeven point) to ensure capital safety.
3. When profit reaches 2%: Move the stop-loss to the level representing a 1% profit.
4. Continuous tracking: Thereafter, for every additional 1% profit in price, move the stop-loss up 1% accordingly, dynamically protecting and locking in profits.
Financial markets change rapidly. All market analysis and trading strategies require dynamic adjustment. All views, analysis models, and operation strategies mentioned in this article originate from personal technical analysis and are solely for personal trading log purposes. They do not constitute any investment advice or basis for operation. Markets involve risks; investing requires caution. Please do not make decisions based solely on this content.


