Three Consecutive Quarters of Decline: The Crypto Market is Experiencing Its Longest Ebb Since 2022

marsbitPublished on 2026-08-03Last updated on 2026-08-03

Abstract

The cryptocurrency market experienced its third consecutive quarterly decline in Q2 2026, marking its longest downturn since 2022, according to a CoinGecko report. The total market capitalization fell 12.6% to $2.1 trillion, a retreat of roughly 52% from its October 2025 peak. Multiple indicators signal an orderly capital exit from the sector. For the first time since Q3 2023, the total stablecoin market cap shrank (-1.6% to $305.1B), indicating funds are leaving the ecosystem entirely, not just rotating to safer crypto assets. Trading volumes on centralized exchanges dropped 27.9%, while DeFi's Total Value Locked (TVL) plummeted 23.4%. Both Bitcoin (-14.2%) and Ethereum (-25.4%) underperformed traditional risk assets like equities in Q2, breaking from previous correlative narratives. Ethereum saw its first-ever three-quarter losing streak, with its market share falling to around 10%. A few areas saw growth. Prediction market volumes surged 48.7%, largely driven by sports betting. Hyperliquid's HYPE token entered the top 10 by market cap, and tokenized collectibles platforms grew, though primarily via gamified mechanics. Despite a ~9.8% Bitcoin rebound in July, historical trends suggest caution for August. The market, now ~49% below its 2025 high, is undergoing a measured retreat. Its recovery hinges on future Federal Reserve policy and the industry's ability to develop sustainable revenue streams beyond speculation.

Author: Xiao Bing

According to the Q2 2026 cryptocurrency industry report previously released by CoinGecko, the data is grim: the total market capitalization of the crypto market fell by 12.6% in Q2, shrinking from $2.4 trillion to $2.1 trillion, hitting its lowest level since September 2024 and marking a decline of approximately 52% from the October 2025 peak. This is the third consecutive quarter of decline.

Within this 58-page report, the most noteworthy aspect is not any single number, but several trend lines all pointing in the same direction: capital is exiting the crypto market, and it's doing so in a remarkably orderly fashion.

Triple Evidence of Capital Outflows

The first piece of evidence comes from stablecoins.

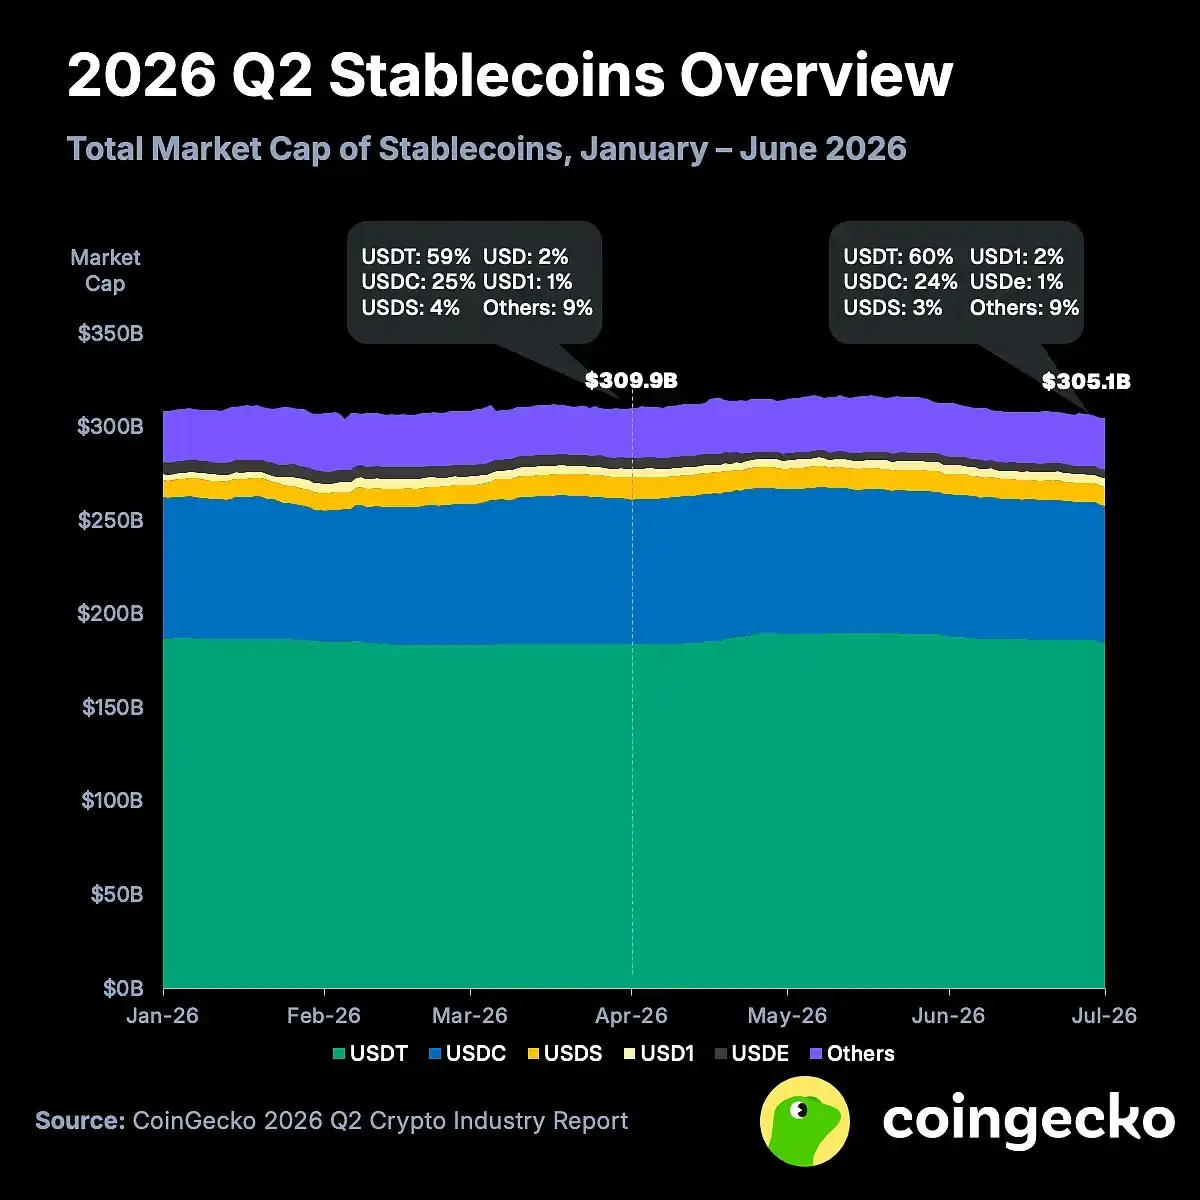
The total market cap of stablecoins declined by 1.6% to $3.051 trillion in Q2, marking the first quarterly negative growth since Q3 2023. Stablecoins are the "cash layer" of the crypto ecosystem; their shrinkage indicates that capital is no longer satisfied with retreating from risky assets to on-chain safe havens—it is directly exiting the industry.

Structural divergence is also intensifying. Tether's USDT defied the trend with a slight 0.2% increase, raising its market share to 60%, while Circle's USDC saw an outflow of $3.7 billion (-4.8%), Sky's USDS shrank by $2 billion (-16.4%), and Ethena's USDe contracted by $1.4 billion (-24.4%). This landscape indicates two things: demand for offshore dollars remains solid, but native yield-bearing stablecoins on-chain are experiencing a redemption wave, primarily because DeFi yields have fallen below the risk-free rate.
The second piece of evidence comes from trading volume.

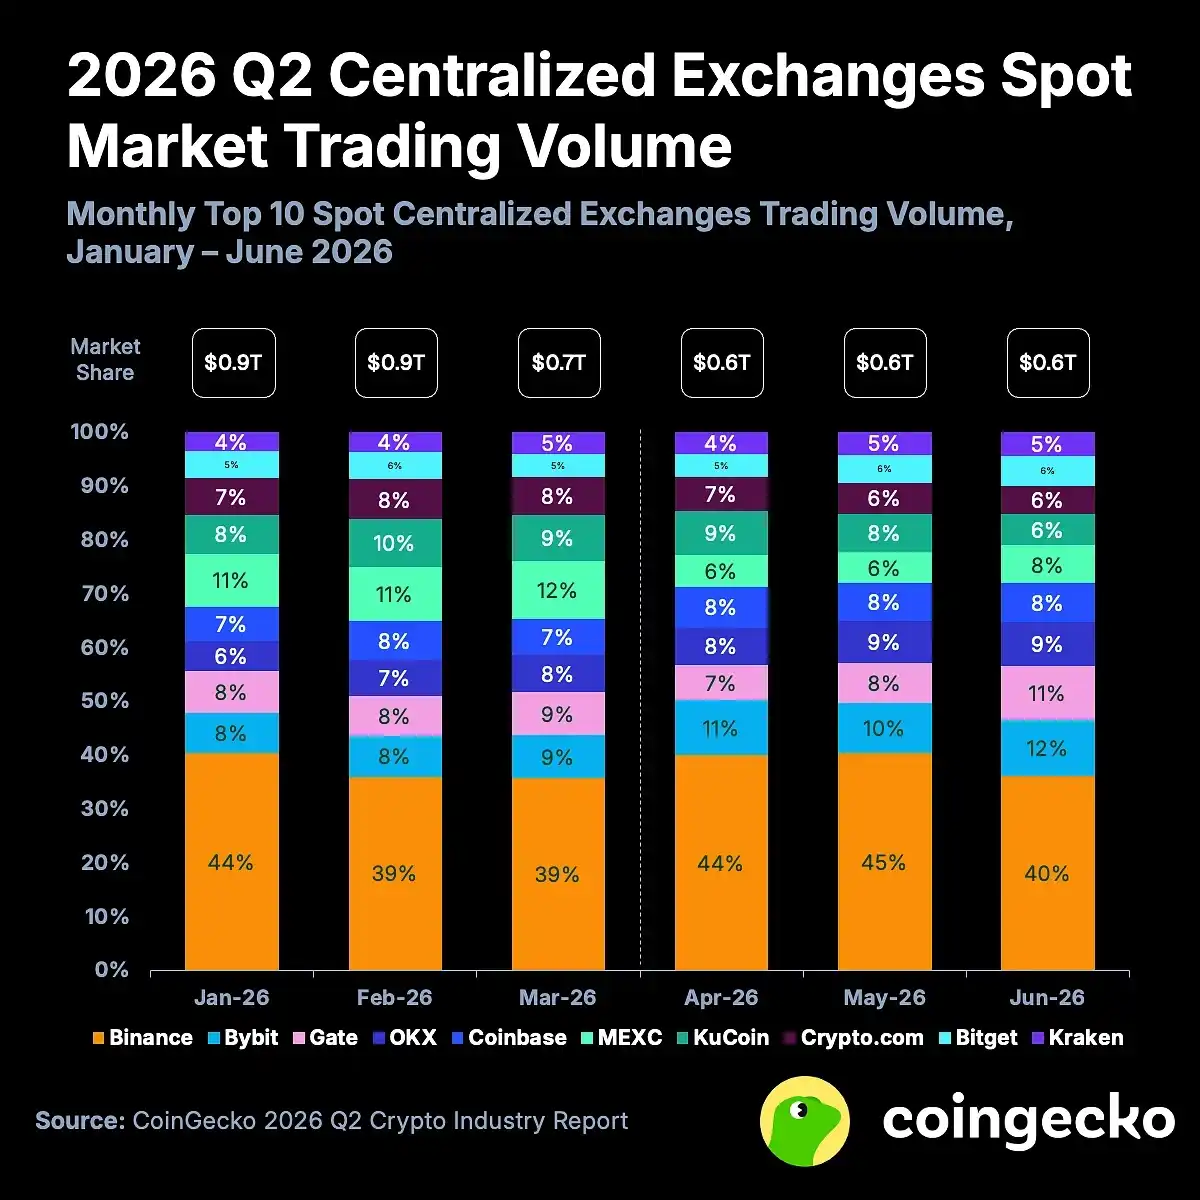
Spot trading volume on centralized exchanges fell by 27.9% to $1.95 trillion in Q2, with May's single-month volume of $619 billion being the lowest point of the year. Perpetual contract trading volume saw a relatively milder decline (-10% to $12.7 trillion), which is not good news. It suggests that speculative demand is declining slower than investment demand, indicating the market structure is becoming more fragile.
The third piece of evidence comes from DeFi.

Total Value Locked (TVL) in DeFi plummeted by 23.4% in Q2. Ethereum was hit hardest by the KelpDAO attack incident, with its TVL shrinking by 28.7% (-$15 billion) and its market share dropping to 52.9%. The decline in TVL, combined with an average 44.6% drop in on-chain transaction fees, indicates a broad contraction in on-chain economic activity.

BTC and ETH Both Lag Behind

If we only look at total market cap, a 12.6% decline is moderate within the volatility typical of crypto markets. What is truly unsettling is the divergence between crypto assets and traditional risk assets.

US stocks staged a strong rebound in Q2, while Bitcoin (-14.2%) and Ethereum (-25.4%) completely failed to keep up.

This is a significant structural signal: the narratives of "Bitcoin as digital gold/a risk asset/tech stock alternative" that prevailed over the past two years all failed simultaneously this quarter. It didn't rise with gold, didn't rise with the Nasdaq, and didn't act as a safe haven when risk aversion sentiment surged.

Ethereum's situation is worse.

Q2 marked the first time in Ethereum's history that it has declined for three consecutive quarters. While Bitcoin's dominance remains above 55%, Ethereum's share has fallen to around 10%, far below its historical average of 18%.

June was the most brutal month of the quarter. The Fed's hawkish stance, fluctuations in US-Iran tensions, and the symbolic sale of Bitcoin by MicroStrategy converged to ignite the most severe single-month decline of the year. That MicroStrategy sale involved only 32 BTC (worth about $2.5 million, or 0.0038% of its holdings), but it shattered the faith-based narrative of Michael Saylor "never selling." Subsequently, US-listed Bitcoin ETFs saw cumulative outflows of nearly $4 billion over the following 12 trading days.

A Few Bright Spots

Amid the overall shrinking market, a few corners are still growing, but the direction of this growth is thought-provoking.

Nominal trading volume in prediction markets grew by 48.7% to $113.8 billion in Q2, with a record high of $52.8 billion in June alone.
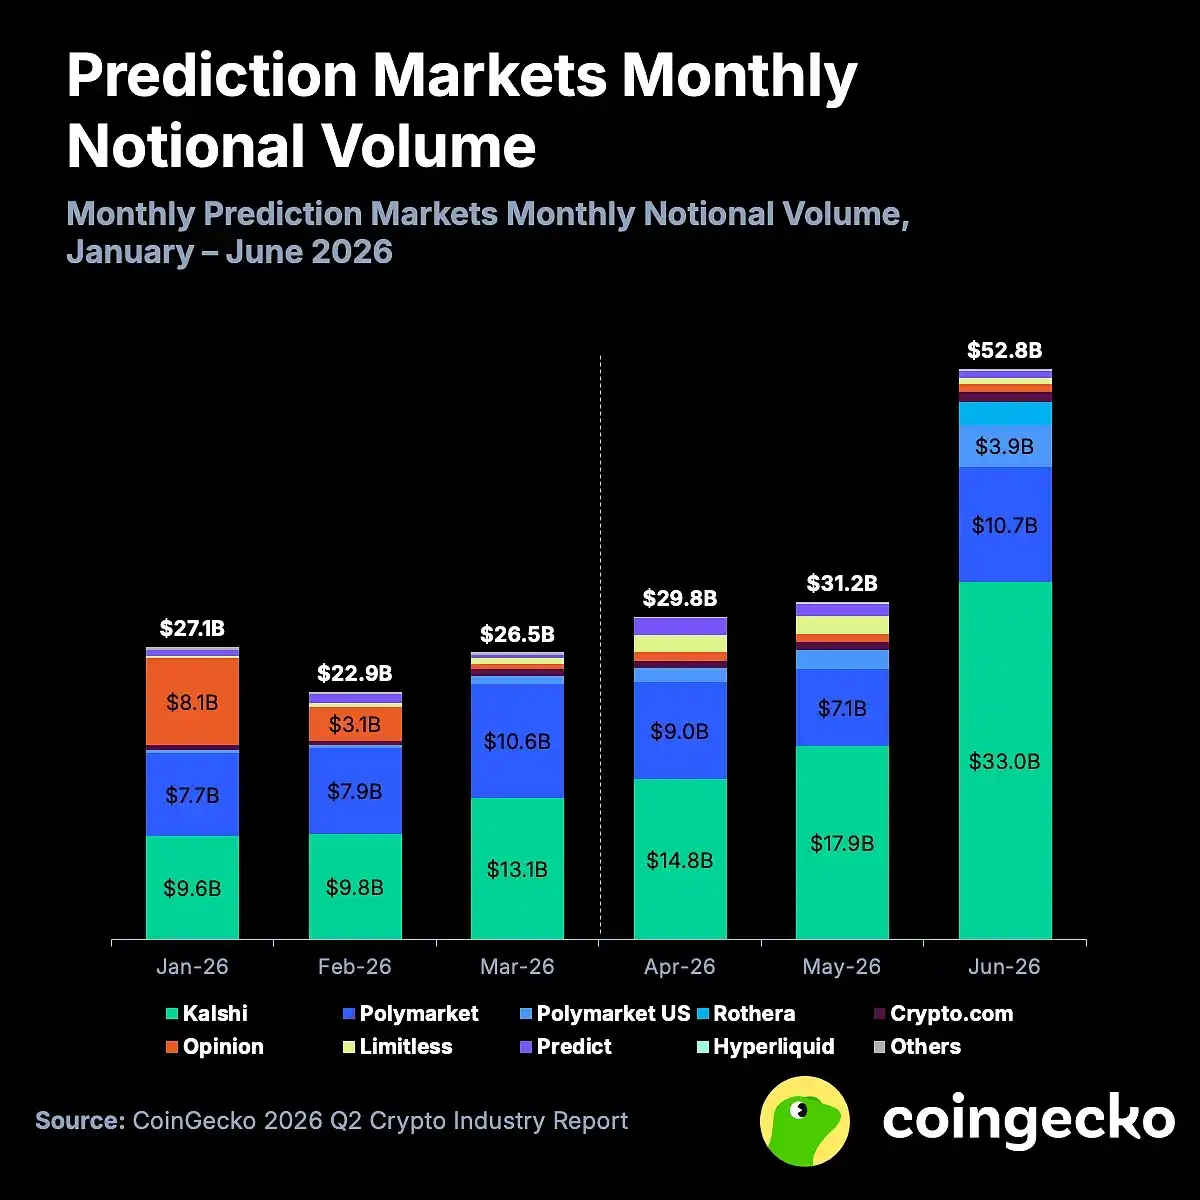
Kalshi's market share expanded from 42.4% to 58.9%, while Polymarket's share dropped from 35.8% to 30.2%. Robinhood's joint venture project with SIG, Rothera, launched in May and ranked fourth with $2.1 billion in trading volume in June. This growth was primarily driven by sporting events, with sports contracts accounting for 81% of the total volume on Polymarket by June.

Hyperliquid's HYPE token, propelled by newly launched ETFs, prediction market features, and a listing on Coinbase's protocol, broke into the top ten by market cap, standing out as a conspicuous exception among altcoins in Q2.

New players emerged in the tokenized collectibles market. Collector Crypt, with 317% monthly trading volume growth (from $97 million in January to $406 million in June), replaced Courtyard as the leader, capturing a 62.8% market share in June. However, the report also notes that over 98% of trading volume on these platforms comes from gacha-style blind box mechanisms, not genuine secondary market liquidity.

What July's Rebound Changed

The CoinGecko report covers data up to the end of June. The market has offered a partial response in July.

Bitcoin rebounded by approximately 9.8% in July, recovering from briefly falling below $58,000 at the start of the month to around $65,000, with a July high touching $67,000. However, this rebound is not encouraging in a historical context: August has seen declines in 9 of the past 12 years, with a median return of -7.49%. The 2018 script is the template most often cited for comparison: that year also saw a 21.3% rebound in July following a sharp decline, only to fall again by 9.4% in August, 6% in September, and crash completely in November.

Bitcoin's current price is around $64,000, representing a decline of approximately 49% from the October 2025 all-time high of $126,000, requiring a doubling to return to its previous peak. Whale addresses have accumulated a net increase of about 270,000 BTC over the past month, but the accumulation rate by long-term holders has slowed by 47%. ETF funds have not yet seen a large-scale return of inflows.

Overall, the crypto market is experiencing an orderly capital retreat, with no panicked crash, just a slow ebb tide. Where this tide will finally recede to depends on two things: when the Federal Reserve eases its stance, and whether this industry can find sources of real revenue beyond speculation before the next cycle arrives.


Related Questions

QAccording to CoinGecko's Q2 2026 report, by what percentage did the total cryptocurrency market capitalization shrink, and what is the significance of this being the third consecutive quarterly decline?

AThe total cryptocurrency market capitalization shrank by 12.6% in Q2 2026, from $2.4 trillion to $2.1 trillion. The significance of this being the third consecutive quarterly decline is that it marks the longest sustained downturn since 2022, indicating a prolonged and orderly withdrawal of capital from the market rather than a sudden crash.

QWhat three key pieces of evidence from the report indicate an orderly capital exodus from the crypto market?

AThe three key pieces of evidence are: 1) The total stablecoin market cap fell for the first time since Q3 2023, declining 1.6% to $305.1B, indicating direct withdrawals. 2) Spot trading volume on centralized exchanges dropped by 27.9%. 3) Total Value Locked (TVL) in DeFi plummeted by 23.4%, and average on-chain transaction fees fell by 44.6%, showing a contraction in economic activity.

QHow did the performance of Bitcoin and Ethereum in Q2 2026 deviate from traditional risk assets like US stocks, and what does this signal?

AWhile US stocks rallied strongly in Q2 2026, Bitcoin fell 14.2% and Ethereum fell 25.4%. This signals that the narratives of Bitcoin as a 'digital gold,' risk asset, or tech stock alternative simultaneously failed, as it did not move in correlation with gold, the Nasdaq, or act as a safe haven.

QDespite the overall market decline, which specific sectors saw growth in Q2 2026, and what was a notable characteristic of that growth?

AThe prediction markets sector saw growth, with nominal trading volume increasing 48.7% to $113.8B. A notable characteristic is that by June, sports-related contracts accounted for 81% of the volume on platforms like Polymarket, and the growth of new platforms like Collector Crypt in tokenized collectibles was largely driven (over 98%) by 'gacha'-style blind box mechanisms, not genuine secondary market liquidity.

QWhat are the two key factors identified in the article that will determine when the crypto market downturn stops?

AThe two key factors are: 1) When the U.S. Federal Reserve changes its tight monetary policy ('when the Fed loosens its grip'). 2) Whether the industry can find real sources of revenue beyond speculation before the next market cycle arrives.

Related Reads

Once-Popular Web3 Enters Wave of Layoffs

The once-hot Web3 industry is experiencing a severe wave of layoffs. While many companies attribute job cuts to AI-driven restructuring, the primary reason is often financial pressure. The Web3 sector, at the intersection of tech and finance, has been hit particularly hard. Employees at major cryptocurrency exchanges report sudden, impersonal layoffs—often with system access revoked overnight—and minimal or no severance. Common tactics include setting impossible performance targets or terminating employees for minor policy violations. The working atmosphere has become toxic, marked by intense monitoring, excessive meetings, and management obsessed with control and internal politics rather than product innovation. The industry's core business model is collapsing. Exchange revenue from trading fees and listing charges has plummeted due to a decline in quality projects and retail investor exodus. Events like the massive forced liquidation on October 10th further shattered confidence. Competition from on-chain derivatives platforms and prediction markets is intensifying the downturn. As layoffs continue, displaced workers struggle to find new opportunities. Many transition to the AI sector, but face significant bias from traditional finance and even some AI firms, which view crypto industry experience with suspicion. The current downturn appears more structural than cyclical, driven by unsustainable practices, internal strife, and a failure to innovate, raising questions about the industry's future trajectory.

marsbit45m ago

Once-Popular Web3 Enters Wave of Layoffs

marsbit45m ago

Sales Drop 26% But Prices Rise? Xiaomi's Dilemma

Xiaomi, facing a significant 26.3% year-on-year decline in global smartphone shipments in Q2 2026, has implemented its third price hike of the year. On August 2nd, prices were raised for nine models, including the flagship Mi 17 series (up 400-500 yuan) and Redmi K90/Turbo 5 series (up 300 yuan). This move completes a pattern where cost pressure, originating from surging memory chip prices, has climbed from entry-level to mid-range and now flagship products. The primary driver is a severe supply squeeze on consumer-grade DRAM and NAND flash memory, as major manufacturers like Samsung shift advanced capacity to more profitable HBM for AI applications. According to Xiaomi President Lu Weibing, memory prices for the same configuration have skyrocketed nearly fourfold since Q1 2025, adding roughly 1500 yuan to the cost of a mainstream 12GB+512GB phone. IDC estimates consumer memory costs have risen nearly 300% year-on-year. While the price increases hurt demand and contributed to the sales slump, Xiaomi's strategy of reducing entry-level models and upgrading its product mix also played a role. Domestically, its market share in China fell to 12% (5th place), while leaders Huawei and Apple saw shipments grow over 24%. To mitigate future risks, Xiaomi is accelerating its in-house "Surge" chip development and optimizing memory configurations across its lineup. Xiaomi is not alone; major brands like OPPO, vivo, and Apple have already raised prices in 2026, with industry insiders predicting another round of increases (200-800 yuan) in the second half. A full-scale industry-wide涨价 cycle is underway, forcing both manufacturers and consumers to recalibrate their strategies and purchasing decisions amid sustained cost pressures.

marsbit56m ago

Sales Drop 26% But Prices Rise? Xiaomi's Dilemma

marsbit56m ago

Trading

Spot
活动图片