The History of U.S. Stocks is, Behind It, a History of American Wars

marsbitPublished on 2026-05-08Last updated on 2026-05-08

Abstract

The article argues that the history of the U.S. stock market is deeply intertwined with American military conflicts. While current Middle East tensions raise economic concerns, major indices like the S&P 500 and Nasdaq continue hitting new highs. Historical analysis shows U.S. wars, from the Spanish-American War to recent conflicts in the Middle East, have often coincided with market gains, as seen in the Dow Jones's performance during these periods. The U.S. transitioned from a war participant to an initiator, with most conflicts post-Vietnam being short, focused on oil, and achieving strategic goals. The market's reaction to war has evolved. Pre-1950s, investor sentiment directly drove swings based on battle outcomes. From the Korean War onward, the focus shifted to economic channels like inflation, oil prices, and fiscal policy. For instance, during the Gulf War, stock movements inversely correlated with oil price swings. The primary beneficiary industries have also changed: coal dominated WWII, oil surged during Korea and Vietnam, but by the Gulf War, the indirect economic impact made consumer staples outperform. Overall, as the U.S. economy grew, the direct market impact of individual wars diminished, giving way to broader macroeconomic factors like interest rates and deficits as the key drivers.

Written by: Li Jia

Source: Wall Street News

When cannons roar, gold pours in. Just as the market is hotly debating whether Middle East conflicts will drag down the global economy, the S&P 500 and Nasdaq indices have both hit new record highs. What exactly does war mean for U.S. stocks?

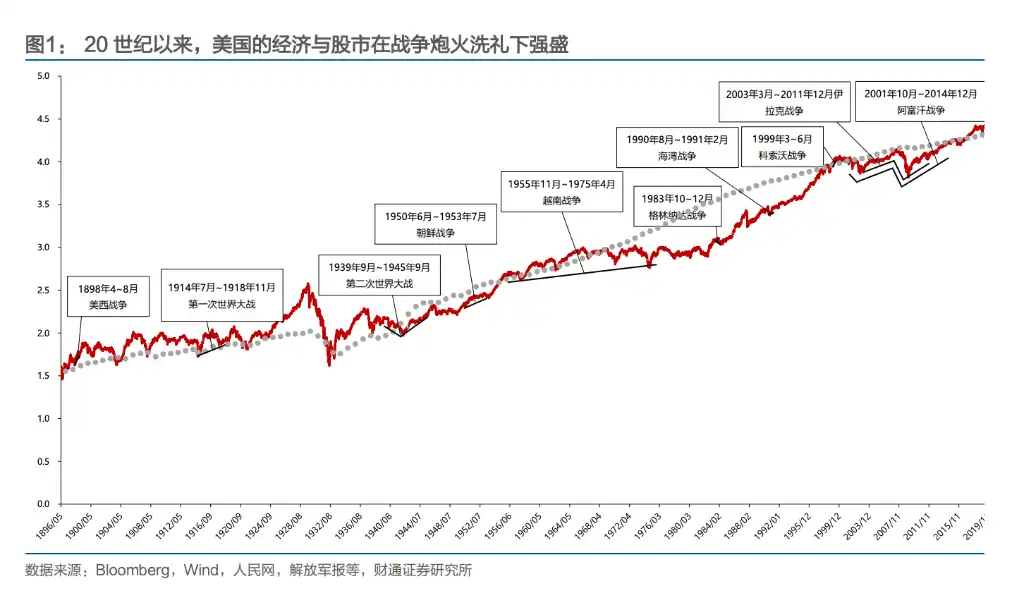
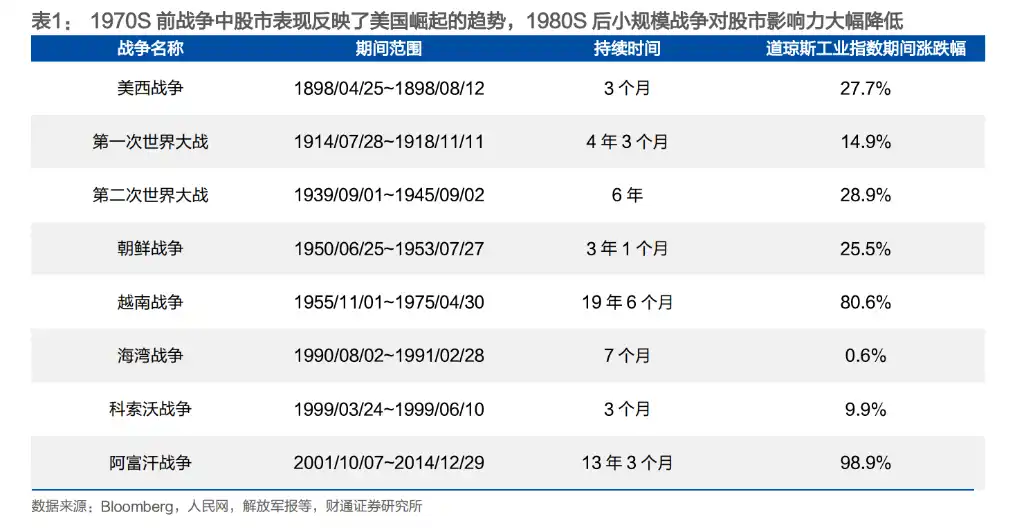
A report from Caitong Securities provides a straightforward answer: War and the long-term bull market in U.S. stocks are not opposites but rather symbiotic. The historical performance of the Dow Jones Industrial Average confirms this—it rose 28% during the Spanish-American War, 26% during the Korean War, and still gained over 80% during the 19-year Vietnam War, while nearly doubling during the Afghanistan War, which spanned the period around the 2008 financial crisis.

Since becoming the world's largest economy at the end of the 19th century, the U.S. has gained substantial benefits from most wars it fought, except for the Vietnam War. From seizing Spanish colonies in the Spanish-American War to profiting handsomely from the two World Wars, and further to the Gulf War and subsequent smaller-scale conflicts centered around oil resources, the U.S. completed its transformation from a 'war participant' to a 'war initiator.'

The reaction path of U.S. stocks amid the sound of gunfire is also clear: During WWII and earlier wars, the market was primarily impacted through sentiment shocks. Starting with the Korean War, this direct effect gradually weakened, and wars increasingly transmitted their impact to the stock market through economic channels like inflation, oil prices, and fiscal deficits.

The Vietnam War was the only war where the U.S. suffered a 'loss,' and it profoundly rewrote its war logic. Since then, almost every conflict initiated by the U.S. has shared three characteristics: short duration, limited geographic scope, and a focus on oil—with all ultimately achieving their objectives.

From 'Taking Advantage of a Fire' to Initiating Trouble: The Three Shifts in American War Strategy

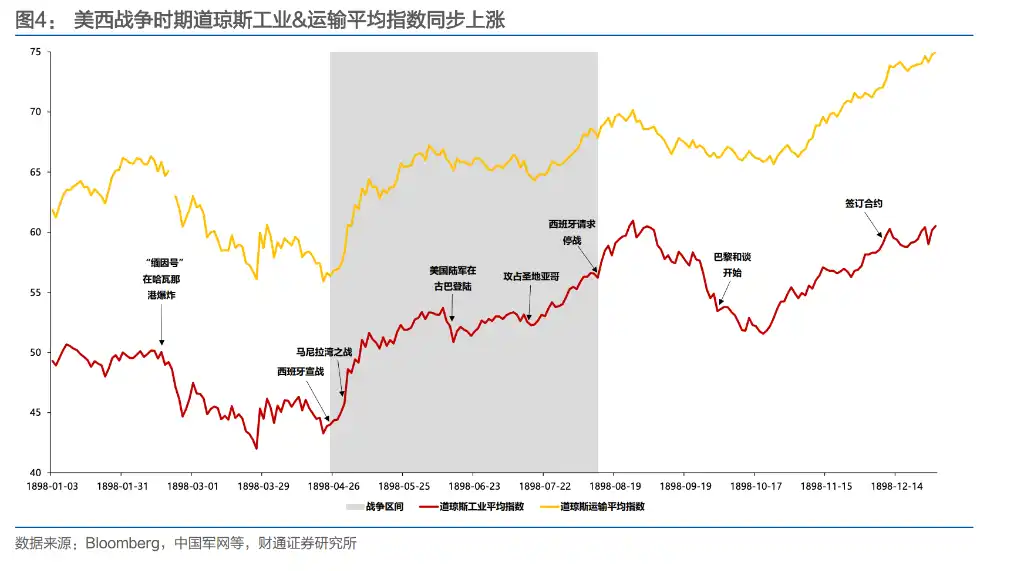
The 1898 Spanish-American War was the first major war actively initiated by the U.S. At that time, domestic monopoly conglomerates urgently needed new markets, investment venues, and sources of raw materials, and Spain's crumbling colonial empire became the ideal target. After the war, the U.S. gained control over Cuba and acquired the Philippine Islands, Guam, and Puerto Rico. The Dow Jones Industrial Average rose 28% during the three-month war, in sync with victories on the main battlefields.

When World War I broke out, the U.S. initially remained neutral. During the market closure in July 1914, investors realized America would become the biggest beneficiary of the European conflict—its homeland, far from the battlefield, could continue production and export arms to Europe. By 1917, American banks, including J.P. Morgan, had provided $10 billion in loans to the British and French governments for purchasing weapons. Although the index fell nearly 10% after the official entry into the war in April 1917, the industrial index had already risen approximately 107% from its low in 1914 to March 1917.

World War II was the crucial conflict that established the U.S. as a global hegemon. At the outbreak in September 1939, U.S. stocks initially fell due to suppressed corporate earnings expectations from the 'excess profits tax'—Congress imposed a tiered tax of up to 95% on profits exceeding $5,000, severely dampening the numerator in the Dividend Discount Model (DDM). It wasn't until the Battle of the Coral Sea and the Battle of Midway in May 1942 turned the tide of war that investors keenly sensed the war's direction, leading U.S. stocks to bottom out and rebound ahead of time. The industrial index rose 82% in the latter half of the war, the transportation index rose 127%, and the utilities index surged 203%.

The Korean War was the first war the U.S. 'did not win.' Although military demand stimulated the post-WWII sluggish economy, the U.S. military failed to achieve its stated objectives. Nonetheless, the Dow Jones Industrial Average still rose 26% throughout the entire period, with the transportation index soaring 86%.

The Vietnam War became a watershed; it was the only war where the U.S. was defeated and gained no benefits.

The U.S. defense budget skyrocketed from $49.6 billion in 1961 to $81.9 billion in 1968 (43.3% of the federal budget), the fiscal deficit ballooned from $3.7 billion to $25 billion, and inflation rose from 1.5% to 4.7%. The U.S. share of the world's total GDP fell from 34% to less than 30%. Post-war, U.S. war strategy shifted completely: it abandoned large-scale ground wars in favor of short-duration, low-casualty, air-strike-centric 'proxy-style' conflicts.

Subsequent wars—the Gulf War, Kosovo War, Afghanistan War, and Iraq War—were all without exception initiated by the U.S., leveraging local conflicts or black swan events. The war zones were mainly concentrated in the Middle East and the Balkans, with the core objectives revolving around oil resource control and military demand.

The Transmission of War to the Stock Market Has Changed: From Sentiment-Driven to Economy-Driven

During WWII and earlier, war events often directly impacted investor sentiment. During the Spanish-American War, victories at the Battle of Manila Bay and the Battle of Santiago de Cuba each drove the index up by about 10% within ten days. In contrast, news of the U.S. entering the two World Wars often triggered panic selling.

But starting with the Korean War, this direct impact gradually faded. From November 1950 to February 1951, despite successive retreats by UN and U.S. forces, the U.S. stock market continued to rise—the reason being that the post-WWII stagnant economy restarted during the Korean War: U.S. real GDP grew about 8.7% in 1950 and remained above 8% in 1951. The fiscal expansion brought by the war, in turn, became a catalyst for economic recovery.

This shift became even more pronounced during the Vietnam War. The Battle of Ia Drang in November 1965 (the first large-scale battle for U.S. troops in Vietnam) did not cause a significant market shock; the 'Tet Offensive' launched by North Vietnam in early 1968 also failed to stop U.S. stocks from reaching new highs. What truly drove the market was instead the Federal Reserve tightening credit conditions in 1966 in response to Vietnam War expenditures, along with the two economic recessions of 1969-1970 and 1973-1975. War sentiment had given way to macroeconomic policy and corporate earnings.

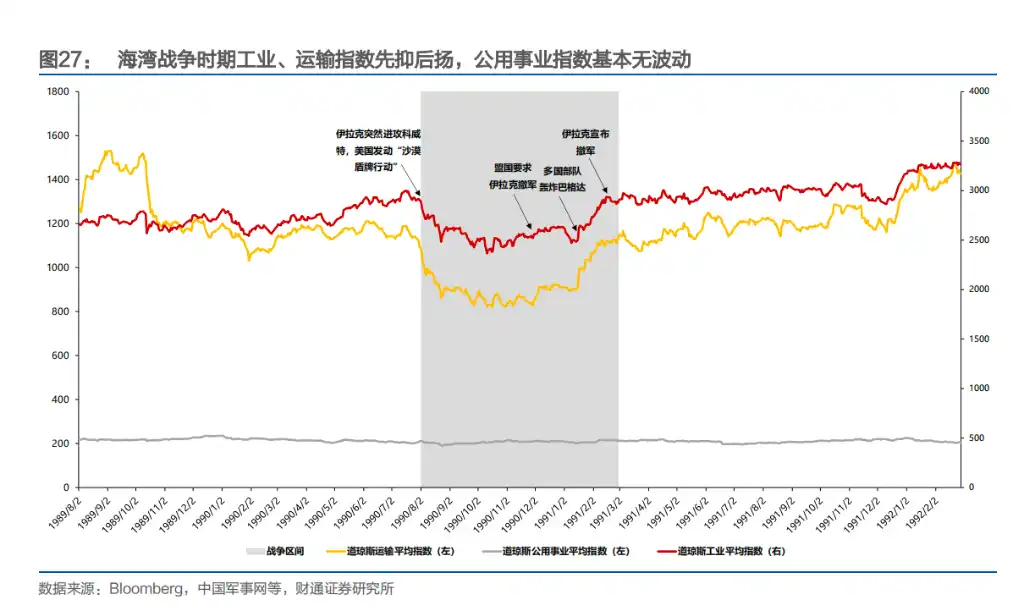
The Gulf War provides the clearest case of 'economic transmission.' After Iraq's invasion of Kuwait in August 1990, oil prices surged, and the market anticipated a U.S. economic recession, pushing S&P 500 valuations to a bottom. When coalition forces bombed Baghdad in January 1991, oil prices fell back to pre-war levels, and the stock market rebounded in sync. During the war, the Dow and crude oil prices moved almost perfectly inversely—the market was trading the trade-off between inflation and growth.

The 2001 Afghanistan War and the 2003 Iraq War further validated this pattern. The most symbolic moment was perhaps the killing of Osama bin Laden in May 2011—arguably the most breakthrough moment in the Afghanistan War. The next day, the Dow fell a mere 0.02%, and the S&P 500 declined 0.18%. The market almost completely ignored the news.

In summary, the reaction of U.S. stocks to war has undergone a clear evolution path: shifting from 'sentiment dominance' to 'economic transmission.' Early wars directly shook the market through news of victories and defeats, but since the Korean War, the stock market has increasingly focused on real economic variables like fiscal expansion, inflation expectations, oil price volatility, and monetary policy.

War itself is no longer the reason for rises or falls; how war affects growth and costs is what the market truly prices.

Which Industry Profits from War? The Answer is Changing

During WWII, coal was the lifeblood of war. Bituminous coal's share rose from 43.8% pre-war to 48.9%, and the industry cumulatively rose 415%.

During the Korean War, oil took over as the new protagonist. Crude oil extraction and refining took the top two spots for gains, with profits climbing continuously from mid-1950 to the first half of 1952. During the Vietnam War, the collapse of the Bretton Woods system forced the U.S. dollar to depreciate, and OPEC was allowed to raise prices to compensate for losses. The oil extraction industry exploded during the dollar crisis from late 1970 to early 1973, surging a staggering 1378% throughout the war.

The Kosovo War continued this pattern, with raw materials and energy industries performing best.

The Gulf War is the only exception—the transmission path shifted to the indirect mode of 'oil price → economic expectations,' making consumer staples and health industries advantageous in the short term, while energy, raw materials, industrials, and other heavy-asset sectors performed the worst.

A notable trend is: As the U.S. economy's size has expanded, the defense industry has transformed from a growth engine into a fundamental part of the economy. The marginal contribution of any single war to the overall economy has been declining, and the driving force for the stock market has increasingly shifted to macroeconomic variables like inflation, interest rates, and fiscal deficits.


Related Questions

QAccording to the article, how has the relationship between war and the U.S. stock market evolved over time?

AThe relationship has evolved from one where war directly impacted the market through sentiment (e.g., WWII and earlier), to one where its influence is transmitted indirectly through economic channels like inflation, oil prices, and fiscal deficits (e.g., from the Korean War onwards). The market now prices how war affects growth and costs, not the war events themselves.

QWhat was the turning point in U.S. war strategy according to the analysis, and what were its key features?

AThe Vietnam War was the turning point. It was the only war the U.S. lost and gained no benefit from. Post-Vietnam, U.S. strategy shifted to conflicts characterized by being short in duration, small in scale, and centered around oil resources, often fought through proxies or with air power dominance.

QWhich sector benefited the most during World War II, and how did the leading sector change in subsequent major conflicts?

ADuring World War II, the coal industry benefited the most, with its share of production rising significantly. In subsequent conflicts, the leading sector shifted: petroleum took the lead during the Korean and Vietnam Wars. However, the Gulf War was an exception, where consumer staples and healthcare performed better due to the indirect economic transmission via oil prices.

QHow did the U.S. stock market react to key battlefield victories in early wars versus significant events in modern wars, such as the killing of Osama bin Laden?

AIn early wars like the Spanish-American War, key battlefield victories (e.g., Manila Bay) caused immediate and significant stock market rallies (~10% in 10 days). In contrast, modern wars show a muted direct reaction. For example, the killing of Osama bin Laden in 2011 resulted in only minor daily movements in major indices, indicating the market had become largely indifferent to such event-driven war news.

QWhat role did World War I and World War II play in America's rise to global economic dominance, according to the article?

AWorld War I allowed the initially neutral U.S. to profit massively by producing and exporting arms and supplies to European allies, with banks providing huge loans. World War II was the key conflict that cemented America's global霸主 (hegemony) status. Although initial war taxes suppressed corporate profits, the market rebounded strongly after pivotal battles turned the tide, and the war effort ultimately solidified the U.S. as the world's leading economic and military power.

Related Reads

The Value Distribution of Stablecoins

**Summary: The Value Distribution of Stablecoins** The article argues that stablecoins are evolving from mere trading tools into broader channels for dollar access. It divides the stablecoin ecosystem into four layers to analyze how value is distributed: 1. **Issuance Layer:** Mints stablecoins, holds reserve assets, and captures the spread between reserve yield and user costs (e.g., Tether, Circle). This layer currently earns the largest profit margin. 2. **Infrastructure Layer:** Connects stablecoins to the traditional financial system, handling fiat on/off-ramps, banking integration, compliance (KYC/AML), and asset management (e.g., Bridge, BVNK). This is the "unglamorous" but critical work, building the essential bridges between crypto and real-world finance. 3. **Acquiring/Distribution Layer:** Integrates stablecoins into merchant systems, manages payment flows, and provides enterprise financial software (e.g., Stripe, Coinbase). They act as the access point for businesses. 4. **Application Layer:** The end-users and businesses that ultimately use stablecoins for payments, settlements, or as a store of value. They benefit from convenience but have little pricing power. The core thesis is that while the issuance layer currently dominates profits, the often-overlooked **infrastructure layer holds significant long-term potential**. The real challenge and barrier to mass adoption is not the on-chain transfer of stablecoins (which is simple), but the complex "last mile" integration into existing business workflows, banking systems, and regulatory frameworks across different countries. Companies in this layer are currently in a "land grab" phase, investing heavily to build networks, secure bank partnerships, and establish compliance pathways. While their position is currently pressured by the profitable issuers above and distribution platforms below, the article suggests that if stablecoins become a default financial rail for businesses, the infrastructure providers who have done the hard work of integration will ultimately gain strong pricing power and become entrenched, essential players.

marsbit4h ago

The Value Distribution of Stablecoins

marsbit4h ago

The Value Distribution of Stablecoins

The Value Distribution of Stablecoins The article argues that stablecoins are evolving from a mere trading tool into a broad "dollar channel." It analyzes the industry's value chain through four layers: 1. **Issuance Layer (e.g., Tether, Circle):** The top layer that mints stablecoins, holds reserve assets, and captures the thickest interest rate spread. 2. **Infrastructure Layer (e.g., Bridge, BVNK):** Connects stablecoins to the traditional financial system, handling critical but complex "dirty work" like fiat on/off-ramps, banking integration, compliance (KYC/AML), and cross-border settlement. 3. **Acquiring/Distribution Layer (e.g., Stripe, Coinbase):** Embeds stablecoins into merchant systems, manages payment flows, and integrates with enterprise software. 4. **Application Layer:** End-users and businesses that ultimately use stablecoins for payments, settlement, or storing value. The author posits that while the issuance layer currently captures the most profit, the most overlooked and potentially critical layer is infrastructure. The core challenge for stablecoin adoption isn't the on-chain transfer (which is simple), but bridging the gap between blockchain and the real-world financial system. This involves solving practical problems for businesses: fiat conversion, reconciliation, tax handling, and user onboarding. Infrastructure companies are currently in a difficult "land-grab" phase—building networks, securing banking relationships, and achieving compliance country-by-country. They face pressure from both the profitable issuance layer above and distribution platforms below. However, the author suggests this layer is building a crucial moat. Once stablecoins become a default business rail, the infrastructure players who have done the hard work of integration may gain significant, durable value and pricing power.

链捕手4h ago

The Value Distribution of Stablecoins

链捕手4h ago

How to Do Research Well: Deliberately Practice the Real Skills That Matter

No one truly teaches you how to do research. You're often given a desk, a pre-selected problem, and vague instructions to "create something new." Consequently, many people reverse-engineer the job based on visible outputs—papers, posts, announcements—learning only how to *appear* like a researcher rather than how to *become* one. True research capability is built from stacking small, trainable skills, nearly all of which can be developed through deliberate practice. **Pick Your Own Problem:** Most researchers absorb problems from advisors or trends, lacking the underlying reasoning. Choosing a problem you genuinely care about, as John Schulman advises, leads to original work. Develop "taste" like a muscle: predict experiment outcomes, guess paper results from methods, and track which findings remain important over time. **Upgrade Your Inputs:** Relying on shared reading lists (arXiv hot lists, filtered group chats) leads to unoriginal conclusions. Undervalued old literature often holds crucial insights (e.g., MoE, LSTM, backpropagation). Richard Sutton's "The Bitter Lesson" or Claude Shannon's 1952 talk on creative thinking are more predictive than lengthy modern surveys. Breadth matters as much as depth: draw from neuroscience, mechanism design, hardware knowledge, and honest statistics. Read papers directly, especially appendices and limitations sections. **Write Everything Down:** As Paul Graham noted, writing exposes flaws in seemingly mature ideas. Writing is the cheapest defense against self-deception. Following Feynman's principle, Darwin programmatically wrote down facts contradicting his theory to combat memory bias. Maintain a detailed log of hypotheses, setups, predictions, results, and updated understandings. Reviewing past logs fosters essential humility.

marsbit6h ago

How to Do Research Well: Deliberately Practice the Real Skills That Matter

marsbit6h ago

Trading

Spot
Futures
活动图片