Stablecoin usage up 600% – Is USDC taking the lead from USDT?

ambcryptoPublished on 2026-03-23Last updated on 2026-03-23

Abstract

Stablecoin usage on the Ethereum network has grown significantly, with active addresses surging 600% from March 2025 to March 2026, indicating deeper integration beyond speculative trading into payments and cross-border transactions. A notable shift in market preference shows USD Coin (USDC) leading with a $4.5 billion supply increase, while Tether (USDT) experienced a $2 billion contraction, reflecting a move toward perceived regulatory clarity. Despite a slight decline in exchange reserves and net outflows of $485 million, the capital is being parked rather than fully exiting, reducing immediate sell pressure and supporting short-term market stability. Overall, stablecoin liquidity is consolidating rather than expanding, with total supply at $316.45 billion.

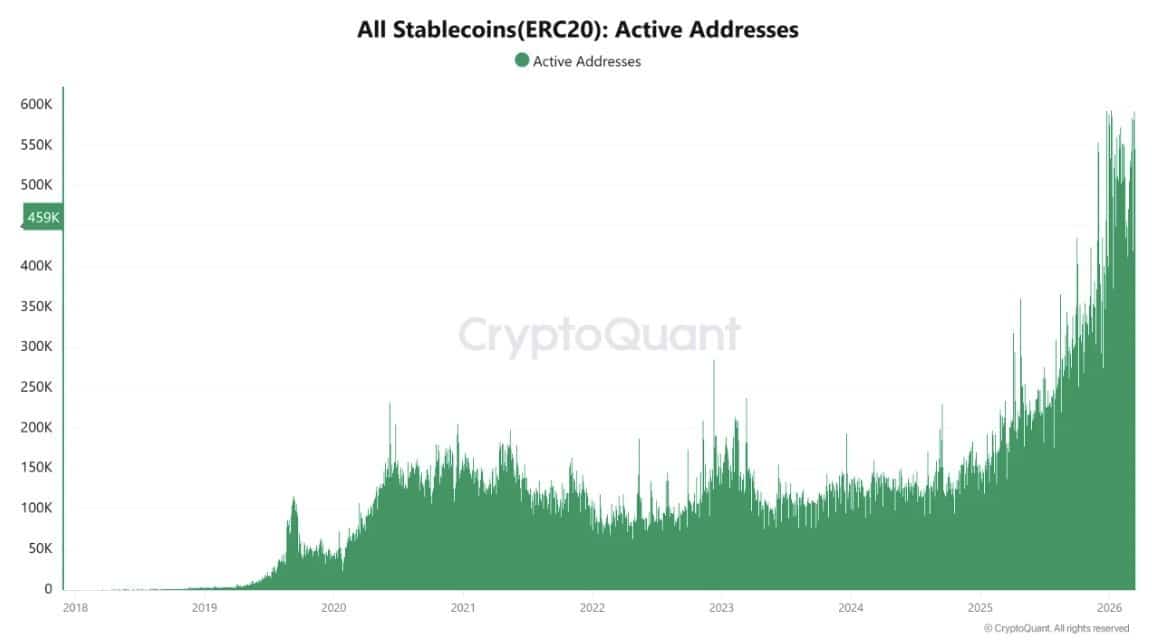
ERC20 stablecoin activity is undergoing a structural expansion, as active addresses surged from roughly 85,000 in March 2025 to nearly 600,000 in March 2026.

This 600% growth reflects more than temporary spikes, as activity has trended upward steadily since 2024. As participation broadens, the pattern shifts from isolated bursts to sustained usage, which suggests deeper integration across the network.

Source: CryptoQuant

At the same time, this rise signals a change in function.

Stablecoins are moving beyond DeFi trading pairs toward transactional infrastructure. As a result, flows increasingly reflect payments, settlements, and cross-border transfers rather than speculative positioning.

However, rising activity also implies higher dependency on stablecoin liquidity.

As usage concentrates around these assets, they become central to capital movement across markets. This dynamic suggests crypto liquidity is becoming more efficient, while also more sensitive to stablecoin-driven demand cycles.

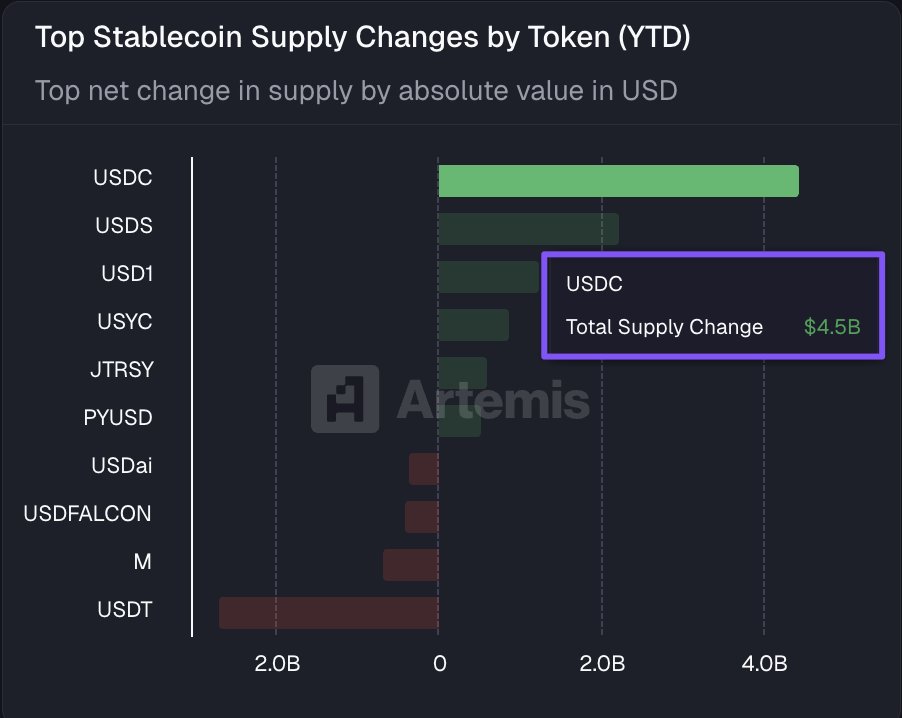
Stablecoin flows shift as USDC gains dominance over USDT

Stablecoin flows show a clear rotation in market preference, as USD Coin [USDC] leads supply expansion year-to-date.

USDC added $4.5 billion, marking the largest increase across all tracked assets. This rise reflects strong inflows during a volatile period.

Tether [USDT] moved in the opposite direction, with its supply contracting by roughly $2 billion, signaling capital outflows. As this divergence forms, it highlights a shift toward perceived stability and regulatory clarity.

Source: Artemis

This gap suggests growing usage beyond simple liquidity storage. As volumes expand, USDC strengthens its role in DeFi and payments infrastructure.

However, this concentration also implies that liquidity is becoming more centralized. As capital rotates, market dependence on fewer stablecoins increases, shaping how liquidity flows across the broader ecosystem.

Stablecoin flows show consolidation, not capitulation

Stablecoin flows reflect a cautious but balanced shift, as liquidity moves away from exchanges without fully exiting the market. Exchange Reserves stand at $65.37 billion, down 0.72% in 24 hours.

Net Outflows reached over $485 million, signaling movement toward self-custody. This suggests capital is being parked rather than actively deployed. However, this shift also reduces immediate sell pressure on exchanges, which can support price stability.

Total stablecoin supply sits at $316.45 billion, rising just 0.17% weekly. USDT grew 0.08% to $184.1 billion, while USDC fell 0.22% to $79.1 billion, showing mixed demand.

This balance implies liquidity is rotating rather than expanding, keeping markets stable in the short term while leaving momentum dependent on renewed capital deployment.


Final Summary

Related Questions

QWhat was the percentage growth in active addresses for ERC20 stablecoins from March 2025 to March 2026?

A600%

QWhich stablecoin led the supply expansion year-to-date and by how much?

AUSD Coin (USDC) led the supply expansion, adding $4.5 billion.

QWhat was the change in Tether's (USDT) supply during the same timeframe?

ATether's (USDT) supply contracted by roughly $2 billion.

QWhat is the new primary function that stablecoins are moving towards, according to the article?

AStablecoins are moving beyond DeFi trading pairs toward transactional infrastructure, such as payments, settlements, and cross-border transfers.

QWhat was the total stablecoin supply and the 24-hour change in Exchange Reserves mentioned in the article?

AThe total stablecoin supply was $316.45 billion, and Exchange Reserves were $65.37 billion, down 0.72% in 24 hours.

Related Reads

The King of Blind Date Attire in Korea: How SK Hynix Made a Comeback Against Samsung?

In South Korea's dating scene, SK Hynix employees are now highly sought after, a status shift fueled by the company's astronomical profits and employee bonuses, projected to reach up to 6.1 million RMB per person by 2027. This marks a dramatic reversal for the long-time second-place player in memory semiconductors, which has now surpassed its rival Samsung in annual operating profit. The turnaround story began in 2008 when a struggling Hynix, emerging from bankruptcy restructuring, took a risky bet by agreeing to develop High Bandwidth Memory (HBM) with AMD. At the time, HBM had no clear market beyond high-end graphics cards and was a costly, complex technology. Major players like Samsung, pursuing its own HMC technology, declined. For Hynix, with only memory as its core business, it was a gamble born of necessity. The pivotal moment came in 2012 when SK Group Chairman Chey Tae-won acquired Hynix. Defying industry downturns, he invested heavily in R&D and fabrication, sustaining the HBM project through over a decade of commercial uncertainty and internal challenges. A key break occurred around 2016-2017 when Samsung faced production issues supplying HBM2 for Google's TPU, allowing SK Hynix to gain a crucial foothold in the data center market. The AI explosion post-ChatGPT in 2022 was the catalyst, turning HBM into a critical bottleneck for AI accelerators like NVIDIA's GPUs. By 2025, SK Hynix captured 62% of the global HBM market, leaving Samsung at 17%. For the first time, its annual operating profit exceeded Samsung's. Analysts point to the "innovator's dilemma" to explain Samsung's miss: its vast, successful business portfolio made it risk-averse, preventing an all-in bet on the initially niche HBM technology. In contrast, SK Hynix, as a challenger with its back against the wall, had no choice but to commit fully. The story highlights how Korea's chaebol system allows for ultra-long-term bets beyond quarterly pressures. However, SK Hynix's lead isn't guaranteed. Samsung is aggressively catching up on HBM4, and challenges like customer concentration (heavy reliance on NVIDIA) and technical hurdles in advanced packaging remain. The narrative underscores a market truth: the greatest alpha often comes from betting on uncertain, long-term directions others dismiss, much like HBM in 2008.

marsbit40m ago

The King of Blind Date Attire in Korea: How SK Hynix Made a Comeback Against Samsung?

marsbit40m ago

Trading

Spot
Futures
活动图片