Something Bad Is Coming For Bitcoin: Analyst Says BTC Has Entered This Bearish Sell Zone

bitcoinistPublished on 2026-04-14Last updated on 2026-04-14

Abstract

Bitcoin's recent price action above $70,000 appears bullish, but technical analysis suggests a potential downturn is imminent. According to analyst Tony Research, Bitcoin follows a consistent four-year cycle pattern, historically involving a bull run to new all-time highs followed by a distribution phase and a major correction. The current cycle, which began in 2023, is tracking similarly to previous ones and may have already peaked in October 2025 near $126,000. The current trading range between $60,000 and $76,000 indicates market indecision and is likely the final stage before a deeper correction. The Gaussian Channel indicator shows BTC has entered a terminal distribution phase, signaling that a significant drop could occur at any time. Additionally, analysis based on the 200-day moving average suggests this is not an ideal time for aggressive accumulation, as Bitcoin has already spent many months above this key level.

Bitcoin is looking like it might be turning bullish above $70,000 again, but technical analysis shows that something bad may be coming soon for the price action.

The price action at the end of last week is starting to generate optimistic views for the Bitcoin price, but a pattern that has repeated across every major Bitcoin market cycle shows that the leading cryptocurrency is still in a sell zone.

A Repeating 4-Year Cycle That Ends The Same Way

Technical analysis of Bitcoin’s price action on the weekly candlestick timeframe chart shows an interesting observation. The analysis was done by a crypto analyst called Tony Research, who looked at one of the most consistently observed structures in Bitcoin’s history: the four-year cycle.

The analysis looked at the following durations from bottom to bottom across three distinct cycles. Cycle 1 (2015 to 2018) ran for 1,431 days; Cycle 2 (2019 to 2022) covered 1,421 days; and the current Cycle 3 (2023 to 2026) is tracking at approximately 1,390 days.

The Gaussian Channel indicator on the weekly timeframe chart shows that each of these cycles has followed the same general structure. The structure involves a recovery from a bear market bottom, a bull run that carries the BTC price to new all-time highs, and then a final distribution phase before a major drawdown.

Source: Chart from Tony Research on X

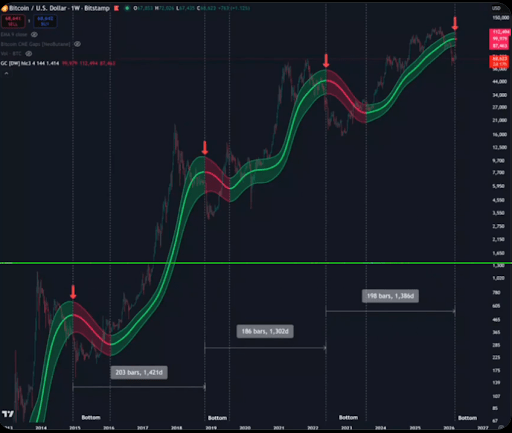
Bitcoin formed bull market tops in November 2013, December 2017, and November 2021, with each cycle spanning approximately four years from peak to peak. Consistent with this structure, the most recent cycle appears to have peaked on October 6, 2025, at just above $126,000.

Price action trading between $60,000 and $76,000 is, in Tony’s view, not for nothing but a reflection of indecision at a critical point in the cycle. The conclusion is that this range is the final stage before a deeper correction.

Bitcoin Might Be In The Sell Zone

History shows that the moment Bitcoin crossed back beneath the upper band of the Gaussian Channel signified the entry into what is the terminal distribution phase. The same signal has now appeared on the current chart, and this reinforces the idea that BTC is trading in a zone where the final drop might happen any time.

In another analysis, Tony outlined an approach to Bitcoin that has, by his assessment, outperformed the vast majority of retail traders over a four-year period. The approach is based on Bitcoin’s relationship with its 200-day moving average.

Whenever the price falls below the MA200, the instruction is to buy and accumulate. When Bitcoin breaks back above the MA200 and has been trading above it for approximately 1,000 days, the instruction is to sell.

At present, BTC has already spent many months above this moving average. Therefore, the cryptocurrency might not be in a phase where aggressive accumulation makes sense.

BTC trading at $70,766 on the 1D chart | Source: BTCUSDT on Tradingview.com

Related Questions

QAccording to the analyst Tony Research, what indicator shows that Bitcoin has entered a bearish sell zone?

AThe Gaussian Channel indicator on the weekly timeframe chart shows that Bitcoin has crossed back beneath the upper band, signifying entry into the terminal distribution phase, which is a bearish sell zone.

QWhat is the key pattern in Bitcoin's market cycle that the analyst identifies as repeating?

AThe analyst identifies a repeating four-year cycle from bottom to bottom, consisting of a recovery from a bear market bottom, a bull run to new all-time highs, and a final distribution phase before a major drawdown.

QBased on the analysis, what is the significance of Bitcoin's current price range between $60,000 and $76,000?

AThe price range between $60,000 and $76,000 is seen as a reflection of indecision at a critical point in the cycle and is the final stage before a deeper correction.

QWhat simple trading strategy does the analyst suggest has outperformed most retail traders over a four-year period?

AThe strategy is to buy and accumulate when Bitcoin's price falls below its 200-day moving average (MA200), and to sell when it breaks back above the MA200 and has been trading above it for approximately 1,000 days.

QAccording to the analysis, when did the most recent Bitcoin cycle peak and at what price?

AThe most recent cycle appears to have peaked on October 6, 2025, at a price just above $126,000.

Related Reads

Why Hasn't the U.S. Seen the Rise of 'Huabei' or 'Jiebei'?

The article explores why the U.S. lacks large-scale consumer credit products like China's "Huabei" and "Jiebei," despite having a developed financial sector. Key reasons include: 1. **Structural Barriers**: A fragmented federal and state regulatory system, reinforced by post-2008 reforms like the Dodd-Frank Act, raises compliance costs and protects traditional banks, stifling fintech innovation. 2. **Credit Card Dominance**: Credit cards, used by 70-80% of adults, form a $1.28 trillion debt market with high APRs (avg. 22.3%). This system cross-subsidizes users who pay in full with those carrying balances, creating a predatory yet entrenched ecosystem. 3. **Data Privacy Laws**: Strict regulations (e.g., FCRA, CCPA) prevent tech giants from leveraging behavioral data for credit scoring, unlike in China where such data fuels fintech models. 4. **Capital Market Disincentives**: Wall Street penalizes tech firms entering finance due to lower valuations associated with heavy regulation and risk, as seen in Apple’s failure with Apple Card. 5. **Banking Oligopoly**: Major banks control consumer lending, leveraging lobbying power and consumer habits to maintain high-cost credit, while alternatives like payday loans (400% APR) or "unbanked" services remain niche or exploitative. Ultimately, regulatory, structural, and corporate interests collectively block the emergence of accessible, low-cost digital lending in the U.S.

Odaily星球日报1h ago

Why Hasn't the U.S. Seen the Rise of 'Huabei' or 'Jiebei'?

Odaily星球日报1h ago

Trading

Spot
Futures

Hot Articles

What is $BITCOIN

DIGITAL GOLD ($BITCOIN): A Comprehensive Analysis Introduction to DIGITAL GOLD ($BITCOIN) DIGITAL GOLD ($BITCOIN) is a blockchain-based project operating on the Solana network, which aims to combine the characteristics of traditional precious metals with the innovation of decentralized technologies. While it shares a name with Bitcoin, often referred to as “digital gold” due to its perception as a store of value, DIGITAL GOLD is a separate token designed to create a unique ecosystem within the Web3 landscape. Its goal is to position itself as a viable alternative digital asset, although specifics regarding its applications and functionalities are still developing. What is DIGITAL GOLD ($BITCOIN)? DIGITAL GOLD ($BITCOIN) is a cryptocurrency token explicitly designed for use on the Solana blockchain. In contrast to Bitcoin, which provides a widely recognized value storage role, this token appears to focus on broader applications and characteristics. Notable aspects include: Blockchain Infrastructure: The token is built on the Solana blockchain, known for its capacity to handle high-speed and low-cost transactions. Supply Dynamics: DIGITAL GOLD has a maximum supply capped at 100 quadrillion tokens (100P $BITCOIN), although details regarding its circulating supply are currently undisclosed. Utility: While precise functionalities are not explicitly outlined, there are indications that the token could be utilized for various applications, potentially involving decentralized applications (dApps) or asset tokenization strategies. Who is the Creator of DIGITAL GOLD ($BITCOIN)? At present, the identity of the creators and development team behind DIGITAL GOLD ($BITCOIN) remains unknown. This situation is typical among many innovative projects within the blockchain space, particularly those aligning with decentralized finance and meme coin phenomena. While such anonymity may foster a community-driven culture, it intensifies concerns about governance and accountability. Who are the Investors of DIGITAL GOLD ($BITCOIN)? The available information indicates that DIGITAL GOLD ($BITCOIN) does not have any known institutional backers or prominent venture capital investments. The project seems to operate on a peer-to-peer model focused on community support and adoption rather than traditional funding routes. Its activity and liquidity are primarily situated on decentralized exchanges (DEXs), such as PumpSwap, rather than established centralized trading platforms, further highlighting its grassroots approach. How DIGITAL GOLD ($BITCOIN) Works The operational mechanics of DIGITAL GOLD ($BITCOIN) can be elaborated on based on its blockchain design and network attributes: Consensus Mechanism: By leveraging Solana’s unique proof-of-history (PoH) combined with a proof-of-stake (PoS) model, the project ensures efficient transaction validation contributing to the network's high performance. Tokenomics: While specific deflationary mechanisms have not been extensively detailed, the vast maximum token supply implies that it may cater to microtransactions or niche use cases that are still to be defined. Interoperability: There exists the potential for integration with Solana’s broader ecosystem, including various decentralized finance (DeFi) platforms. However, the details regarding specific integrations remain unspecified. Timeline of Key Events Here is a timeline that highlights significant milestones concerning DIGITAL GOLD ($BITCOIN): 2023: The initial deployment of the token occurs on the Solana blockchain, marked by its contract address. 2024: DIGITAL GOLD gains visibility as it becomes available for trading on decentralized exchanges like PumpSwap, allowing users to trade it against SOL. 2025: The project witnesses sporadic trading activity and potential interest in community-led engagements, although no noteworthy partnerships or technical advancements have been documented as of yet. Critical Analysis Strengths Scalability: The underlying Solana infrastructure supports high transaction volumes, which could enhance the utility of $BITCOIN in various transaction scenarios. Accessibility: The potential low trading price per token could attract retail investors, facilitating wider participation due to fractional ownership opportunities. Risks Lack of Transparency: The absence of publicly known backers, developers, or an audit process may yield skepticism regarding the project's sustainability and trustworthiness. Market Volatility: The trading activity is heavily reliant on speculative behavior, which can result in significant price volatility and uncertainty for investors. Conclusion DIGITAL GOLD ($BITCOIN) emerges as an intriguing yet ambiguous project within the rapidly evolving Solana ecosystem. While it attempts to leverage the “digital gold” narrative, its departure from Bitcoin's established role as a store of value underscores the need for a clearer differentiation of its intended utility and governance structure. Future acceptance and adoption will likely depend on addressing the current opacity and defining its operational and economic strategies more explicitly. Note: This report encompasses synthesised information available as of October 2023, and developments may have transpired beyond the research period.

363 Total ViewsPublished 2025.05.13Updated 2025.05.13

What is $BITCOIN

Discussions

Welcome to the HTX Community. Here, you can stay informed about the latest platform developments and gain access to professional market insights. Users' opinions on the price of BTC (BTC) are presented below.

活动图片