Riot Financial Report Breakdown: When BTC Falls Below $74K, Miners Can't Even Cover Electricity Costs

marsbitPublished on 2026-03-09Last updated on 2026-03-09

Abstract

Based on Riot Platforms' financial data, this analysis deconstructs Bitcoin mining costs into three distinct layers: electricity, operational, and accounting. At a BTC price of $67,200, a miner with modern ASICs and a $0.0667/kWh electricity rate (like in Texas) can cover its direct power cost ($64,635/BTC) for a slim profit. However, adding Riot's non-power operational expenses ($9,809/BTC) pushes the operational breakeven to ~$74,444, resulting in a loss. Further incorporating non-cash depreciation ($39,687/BTC) raises the full accounting breakeven to ~$114,130, indicating significant losses at the corporate level. The model projects that only a BTC price of $126,000 would make mining profitable across all three layers for Riot before the next halving. This framework demonstrates that a mining operation can be cash-flow positive from electricity while remaining unprofitable from operational and accounting perspectives, highlighting the substantial gap between simply running machines and running a profitable public company. The analysis underscores that machine efficiency and electricity rates are critical, as older hardware carries a persistent cost disadvantage.

Author: CryptoSlate

Compiled by: Deep Tide TechFlow

Deep Tide Guide: With BTC currently around $67K, miners are barely breaking even on electricity costs, but operational expenses and depreciation keep overall operations in the red. This article uses real financial data from Riot Platforms to build a three-tier cost model, thoroughly deconstructing the often oversimplified number of "mining cost"—providing direct reference value for understanding mining stock valuations and BTC price pressure levels.

Right now, buying Bitcoin is cheaper than mining it, unless your electricity cost is below 7 cents per kWh.

Full Text Below:

Riot Case Reveals the Three-Tier Profit and Loss Structure of US Miners

Bitcoin mining cost is often simplified to a single number: "the cost to mine one BTC." In reality, this number depends on which level of the business you are measuring.

Electricity costs determine whether to turn on the machines today, operational expenses determine if the mining farm can sustain the entire company, and accounting costs determine whether the business ultimately reports a profit.

To analyze these three levels more clearly, CryptoSlate built a Bitcoin mining cost model based on first principles, calculating mining economics from network difficulty, block reward, transaction fees, ASIC efficiency, and electricity price.

The model then incorporated company-level cost data from Riot Platforms' public financial filings to show the actual economic situation.

Under current network conditions, the model shows miners can cover electricity costs but still cannot cover broader operational and accounting expenses.

Riot's Texas operations reveal: even after the BTC price recovery, there remains a significant gap between the electricity break-even point, the operational break-even point, and the full accounting profitability point.

Riot's Mining Economics Reveal a Three-Tier Profit and Loss Structure

At the current BTC price of $67,200, Riot crosses one break-even point but fails to cross the latter two.

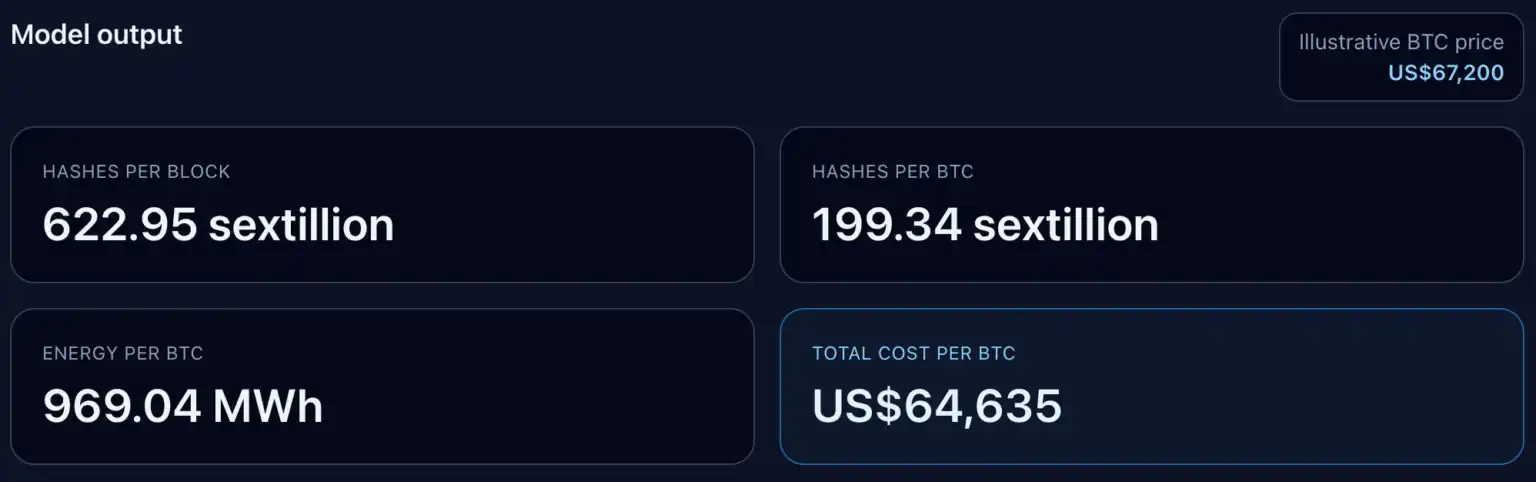
The model is built on the following current network conditions: Bitcoin difficulty 145,042,165,424,850, block reward 3.125 BTC, modern ASIC efficiency around 17-19 J/TH, Texas industrial electricity price approx. $0.0667/kWh. As the current average transaction fee is about 0.02 BTC/block, this model ignores block fees.

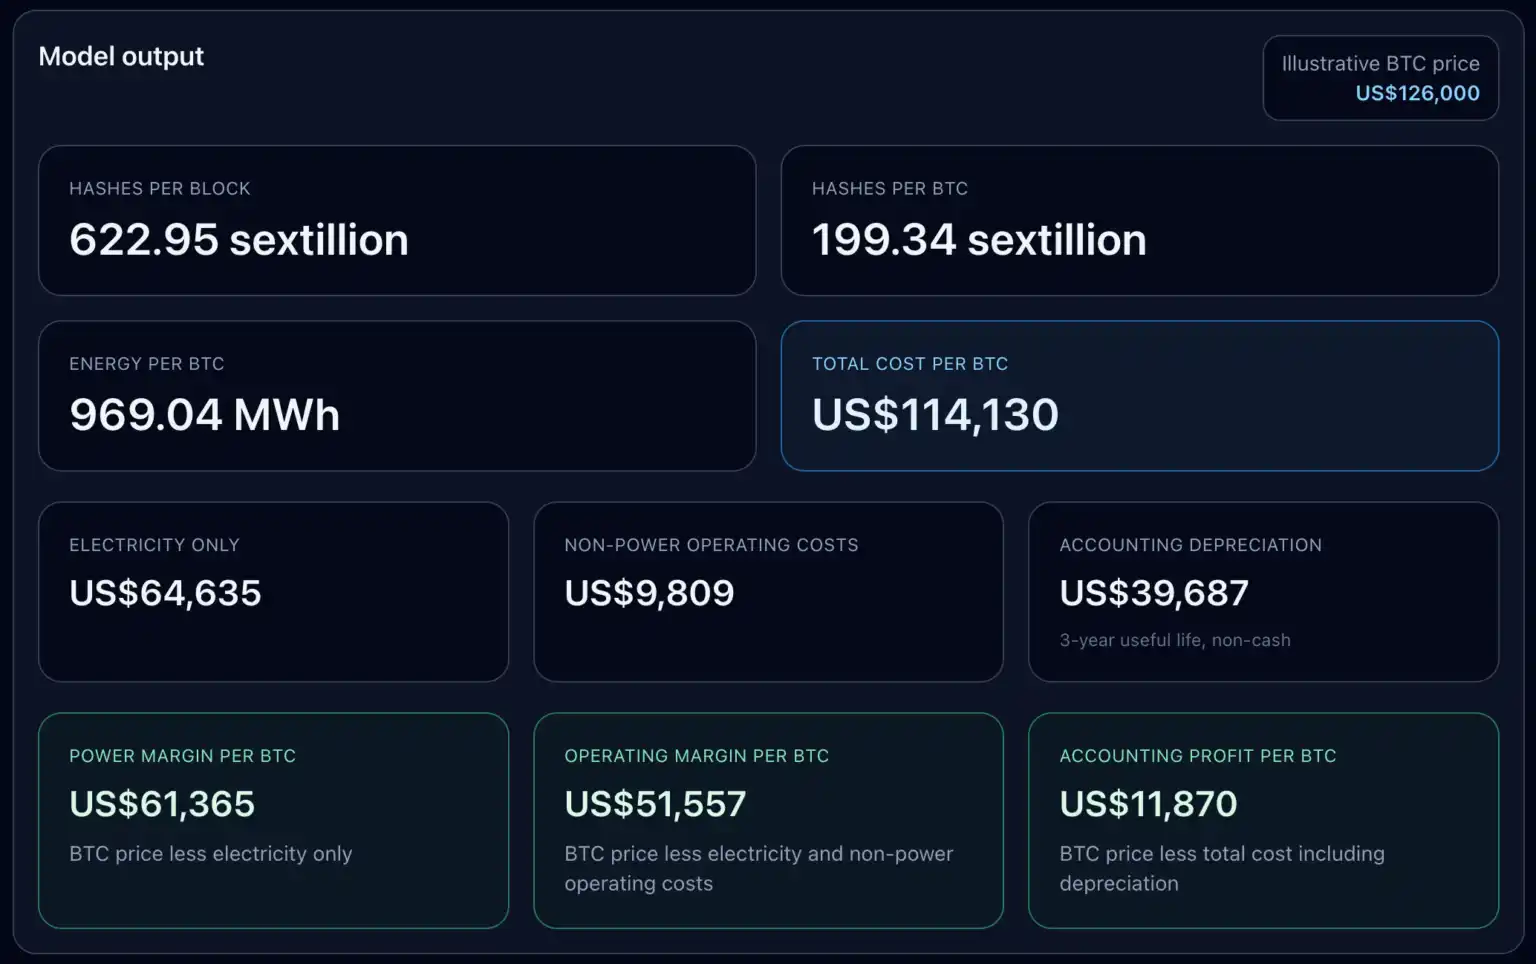
The above parameters yield the following results: total network hashrate per block 622.95 exahashes, hashrate required per BTC 199.34 exahashes, energy consumption per BTC 969.04 MWh.

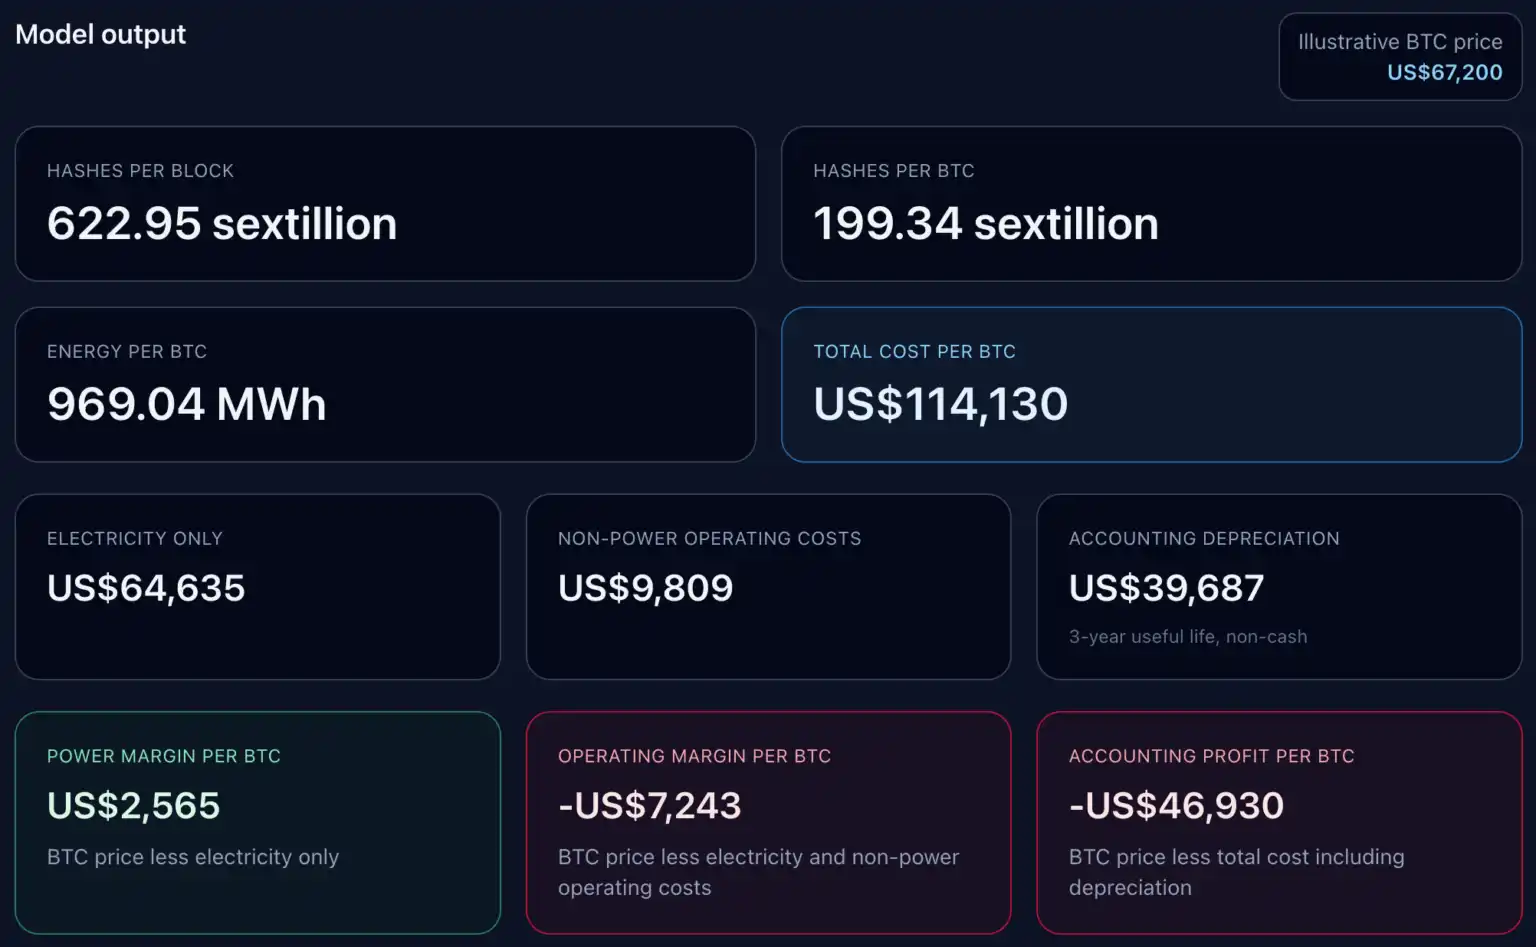
Accordingly, the electricity cost to mine one BTC at the current price is $64,635, resulting in an electricity profit of $2,565/BTC.

After adding non-electricity operational costs of approximately $9,809/BTC from Riot's financial filings, the operational profit becomes negative $7,243, and the total cost increases accordingly. After further adding non-cash depreciation of approximately $39,687/BTC, the accounting profit falls to negative $46,930.

This clearly shows that for large US miners, there is no single number for "the cost to mine one BTC."

First tier: Electricity cost, determines short-term profitability of turning on machines.

Second tier: Adds broader operational costs, determines if self-mining can cover the overall business.

Third tier: Adds depreciation, determines if book profit aligns with cash profit.

The model displays these three tiers side by side, revealing how large the gap between them remains even after the market recovery.

The Break-Even Ladder Defines the Operational Picture

The break-even ladder provided by the model is more illustrative than any single all-in cost number.

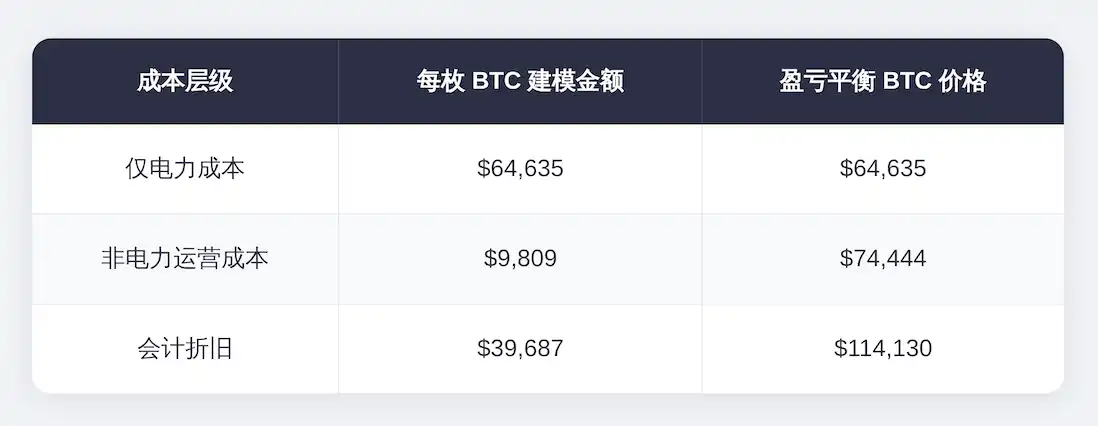
Break-even point for electricity cost only: $64,635/BTC.

After adding Riot's non-electricity operational costs, the break-even point rises to approximately $74,444.

After adding accounting depreciation, the full accounting break-even point rises to $114,130.

Therefore, a miner can report positive gains at the electricity level while still being at a loss at the operational or accounting level.

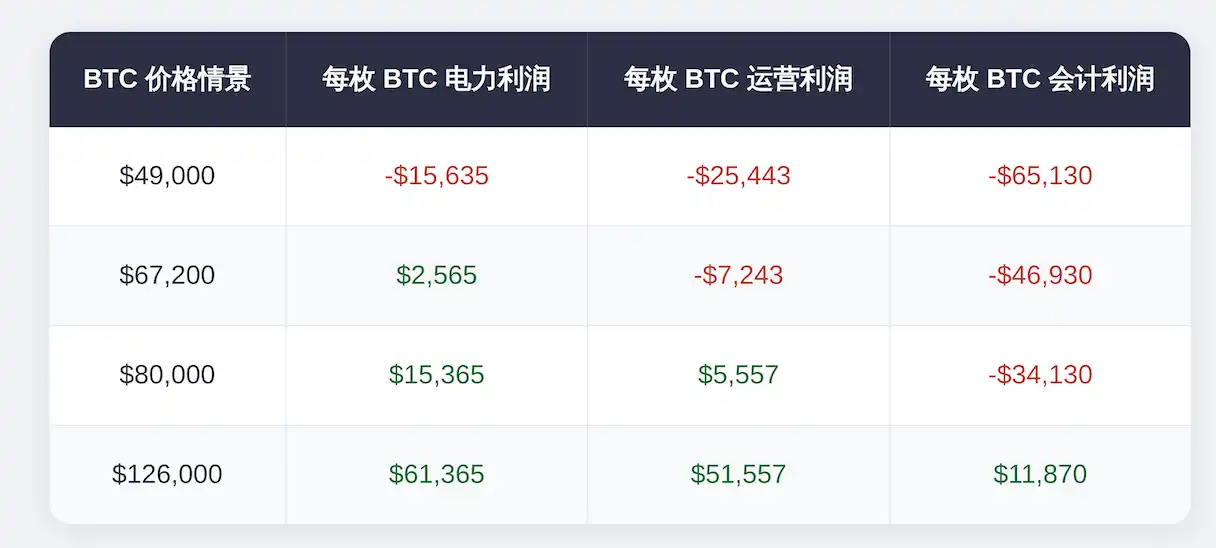
I created four price scenarios to demonstrate how this ladder works in practice.

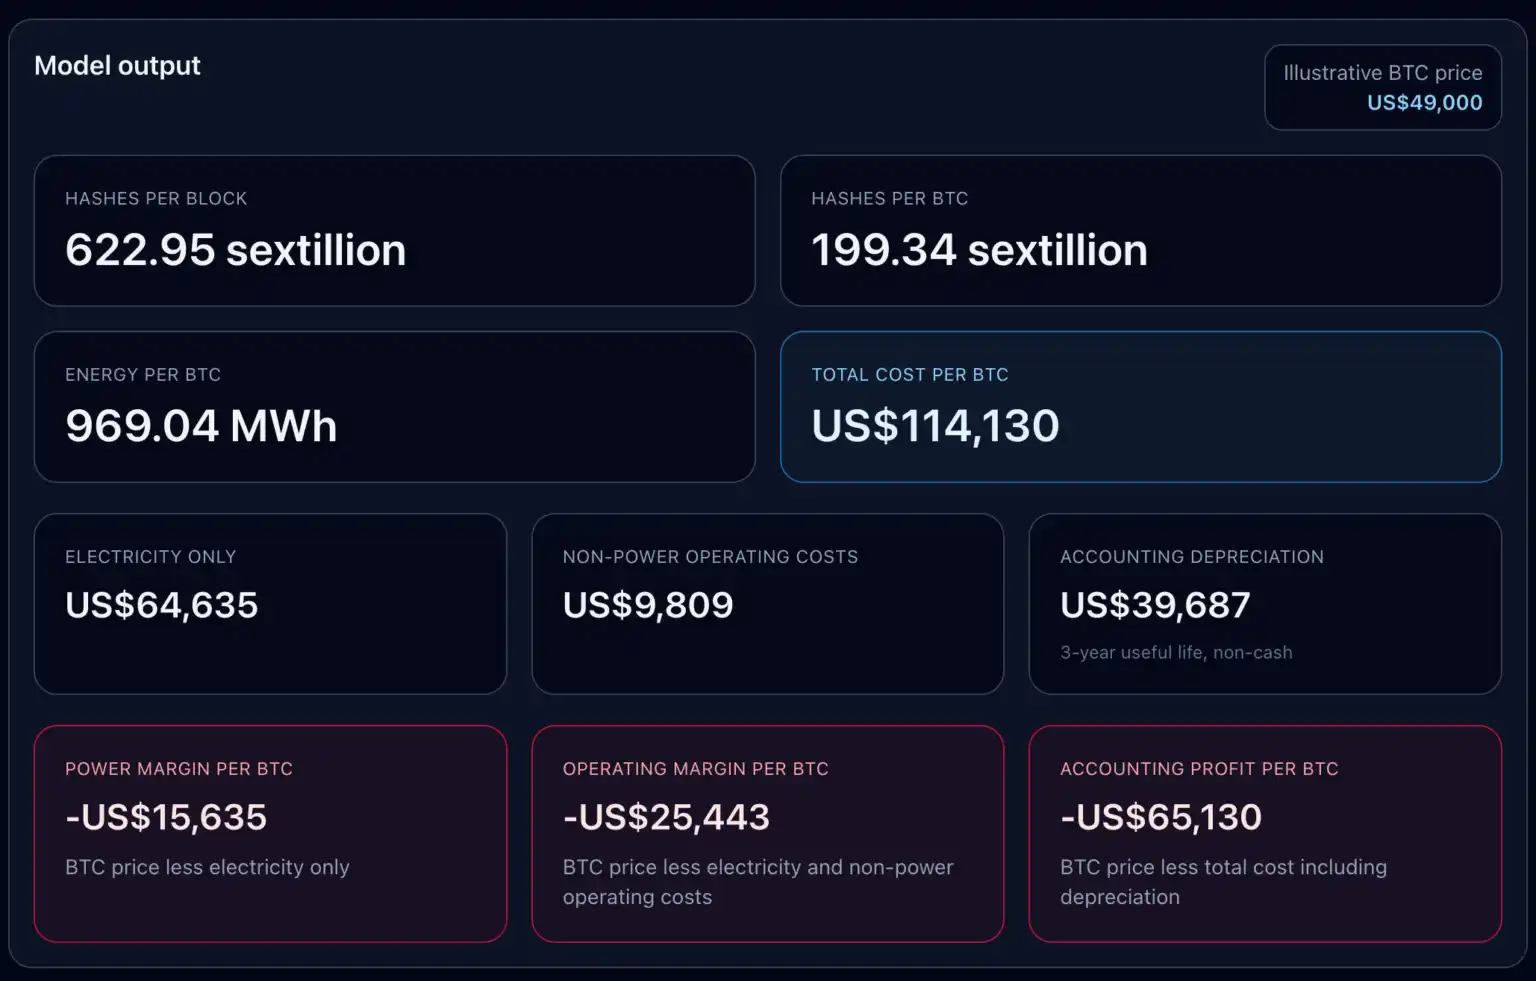
In the $49,000 bear market scenario, Riot is negative at all levels: electricity profit -$15,635/BTC, operational profit -$25,443/BTC, accounting profit -$65,130/BTC.

In the $67,200 current price scenario, Riot just crosses the electricity break-even point, barely above the threshold. Electricity profit turns positive, but the operational and accounting perspectives remain negative.

In the $80,000 recovery scenario, Riot crosses the operational break-even point, with an operational profit of $5,557/BTC, but remains at a loss of $34,130 at the accounting level.

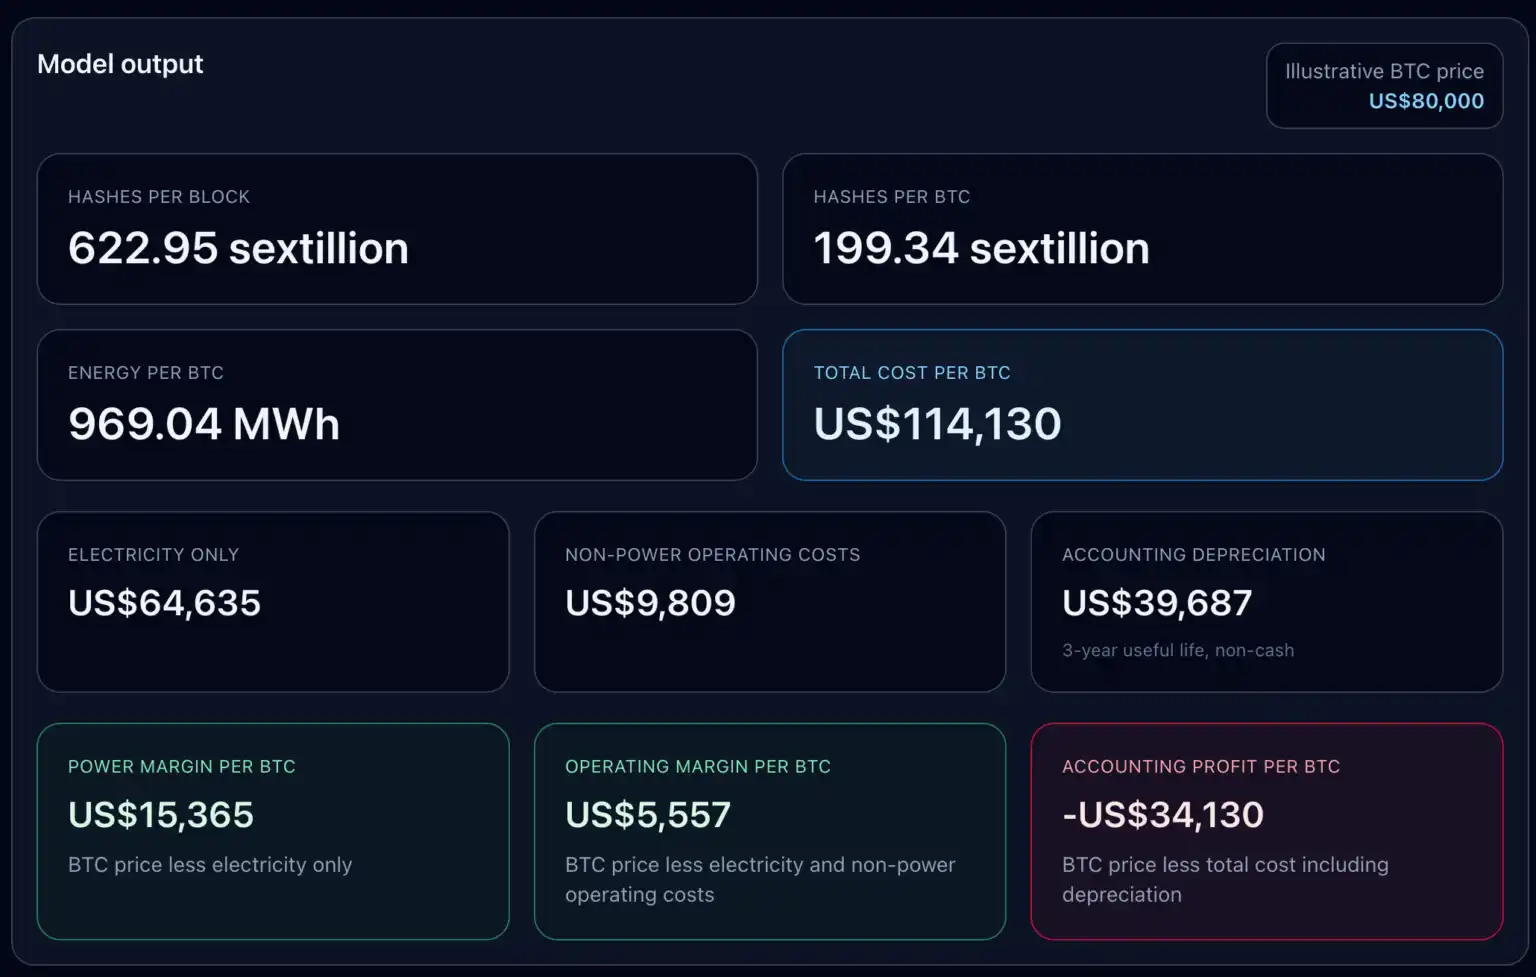
For all three levels to turn positive simultaneously, BTC needs to return to its all-time high of $126,000, at which point the accounting profit would be $11,870/BTC.

This distinction has practical significance. Riot's depreciation layer is explicitly characterized as a non-cash expense, calculated based on a three-year useful life, representing an accounting allocation rather than a short-term avoidable cash outflow.

But it is still part of this picture because listed miners cannot survive on electricity profit alone—they must report income statements, replace machinery, and bear corporate operating costs.

Therefore, the truly valuable question is: which profit line are investors, analysts, and management actually looking at when judging a miner's profitability.

Riot's Price Stress Test Before the Next Halving

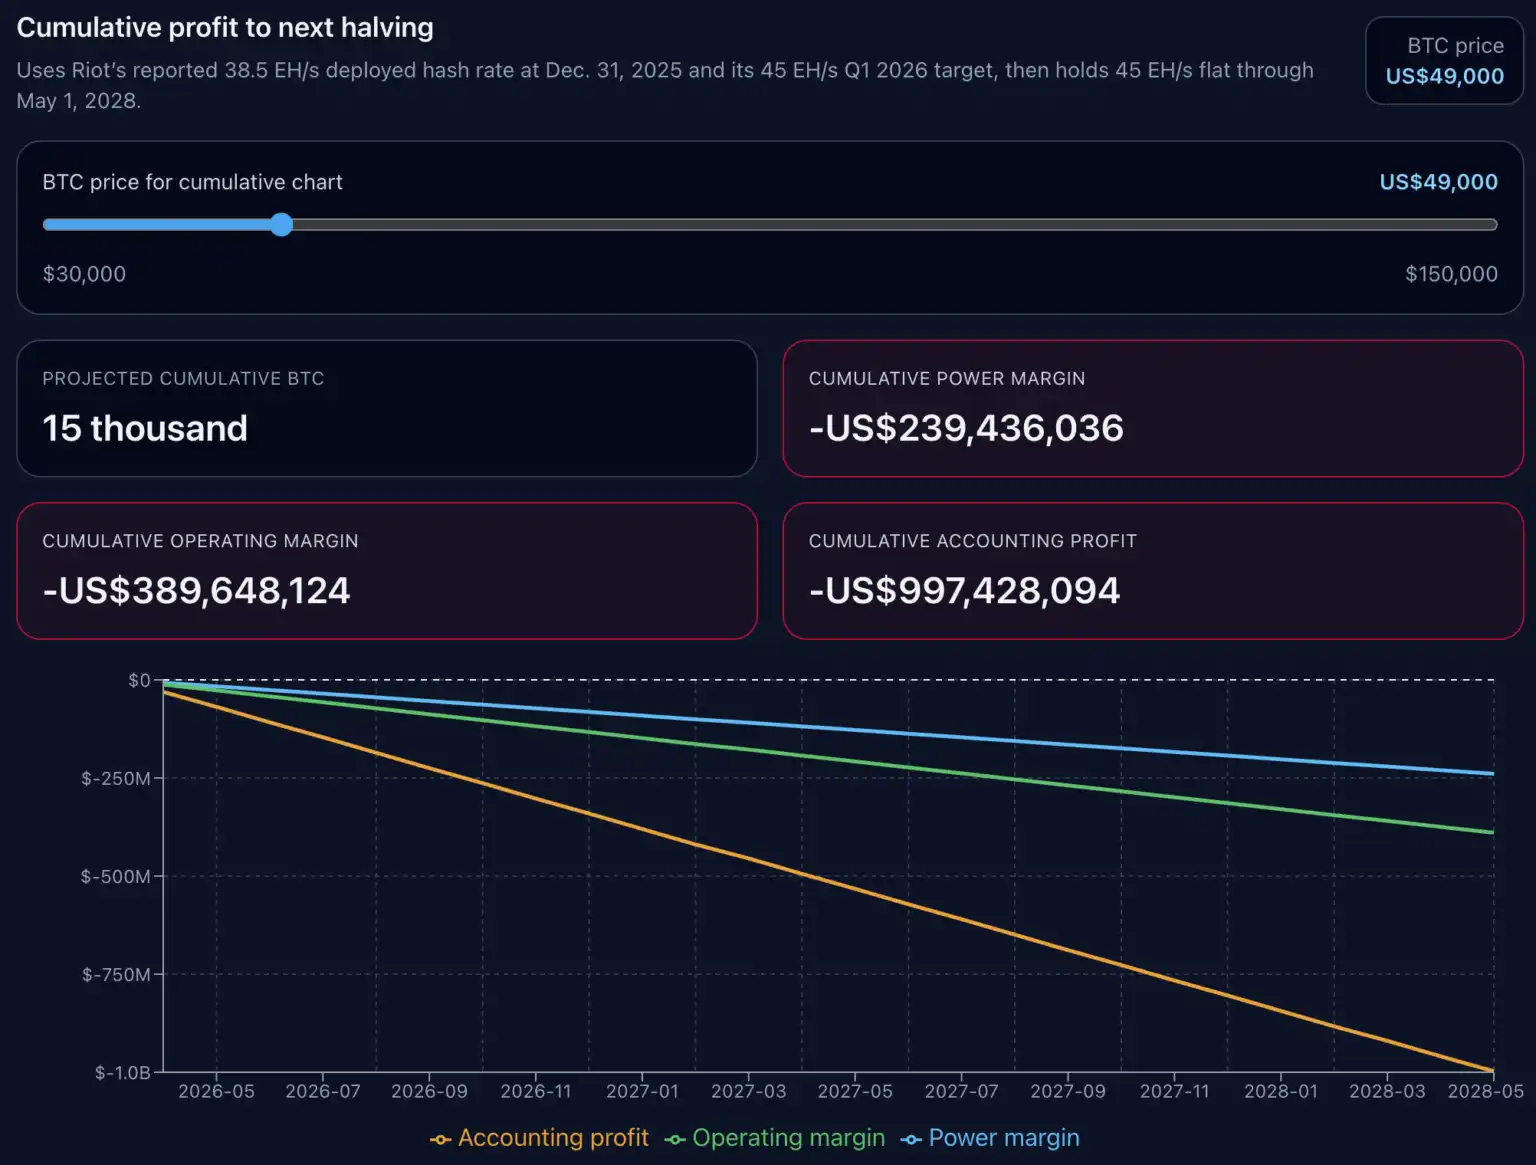
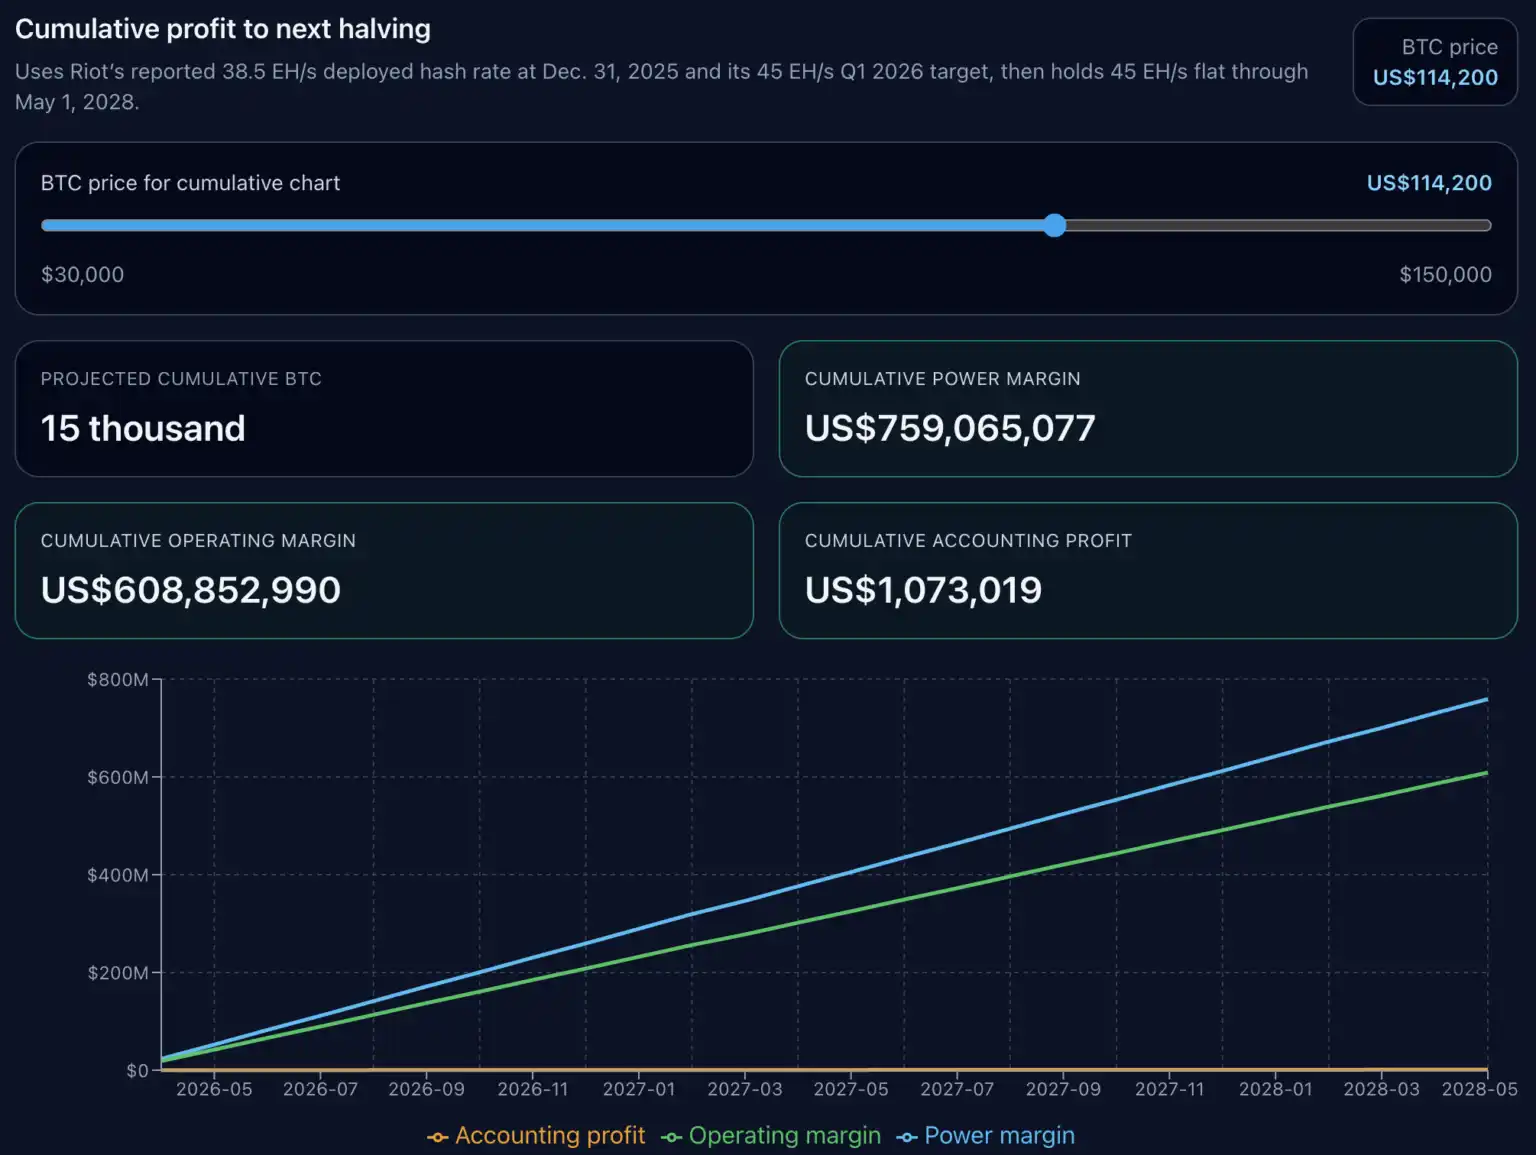
We then extended the cost model to the next halving in 2028.

Based on Riot's latest public filings, assuming a current hashrate of 38.5 EH/s, ramping up to 45 EH/s by March 31, 2026, and maintaining that level until the next halving window.

This model does not reconstruct the entire market but rather keeps the current per-BTC economics constant and projects them along the self-mining hashrate path Riot has reported and planned.

This is a scenario analysis focused on operational leverage, with clear price sensitivity.

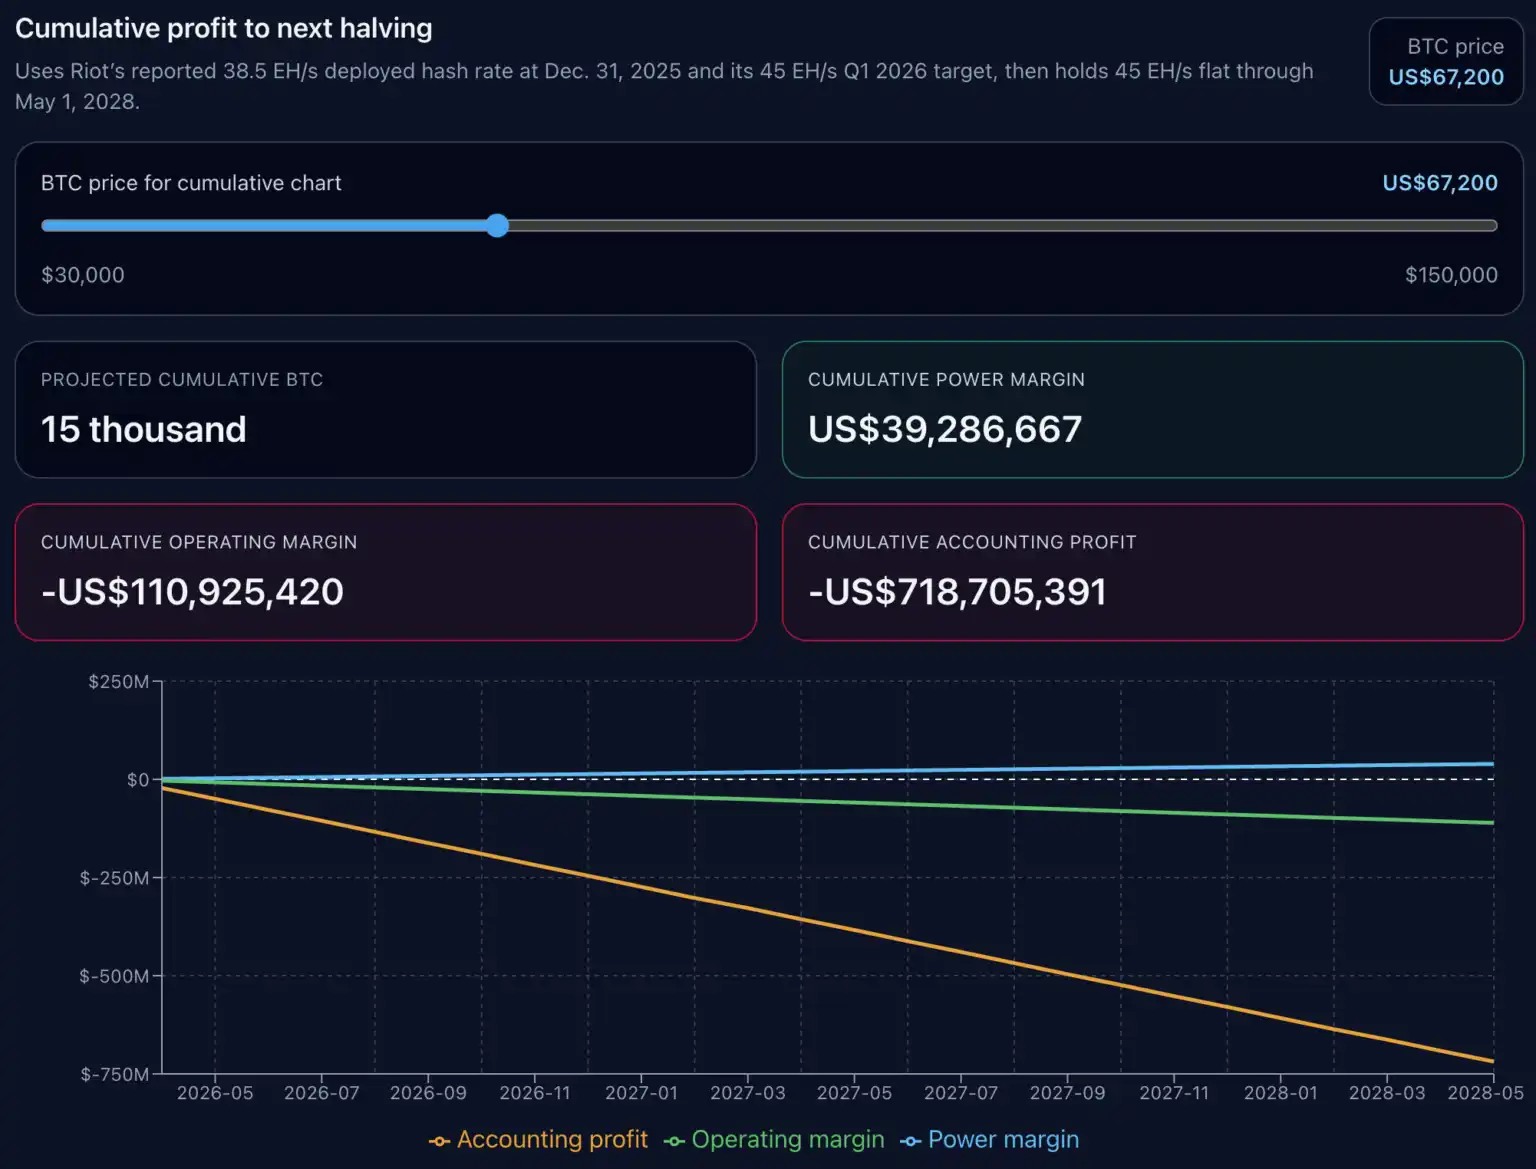
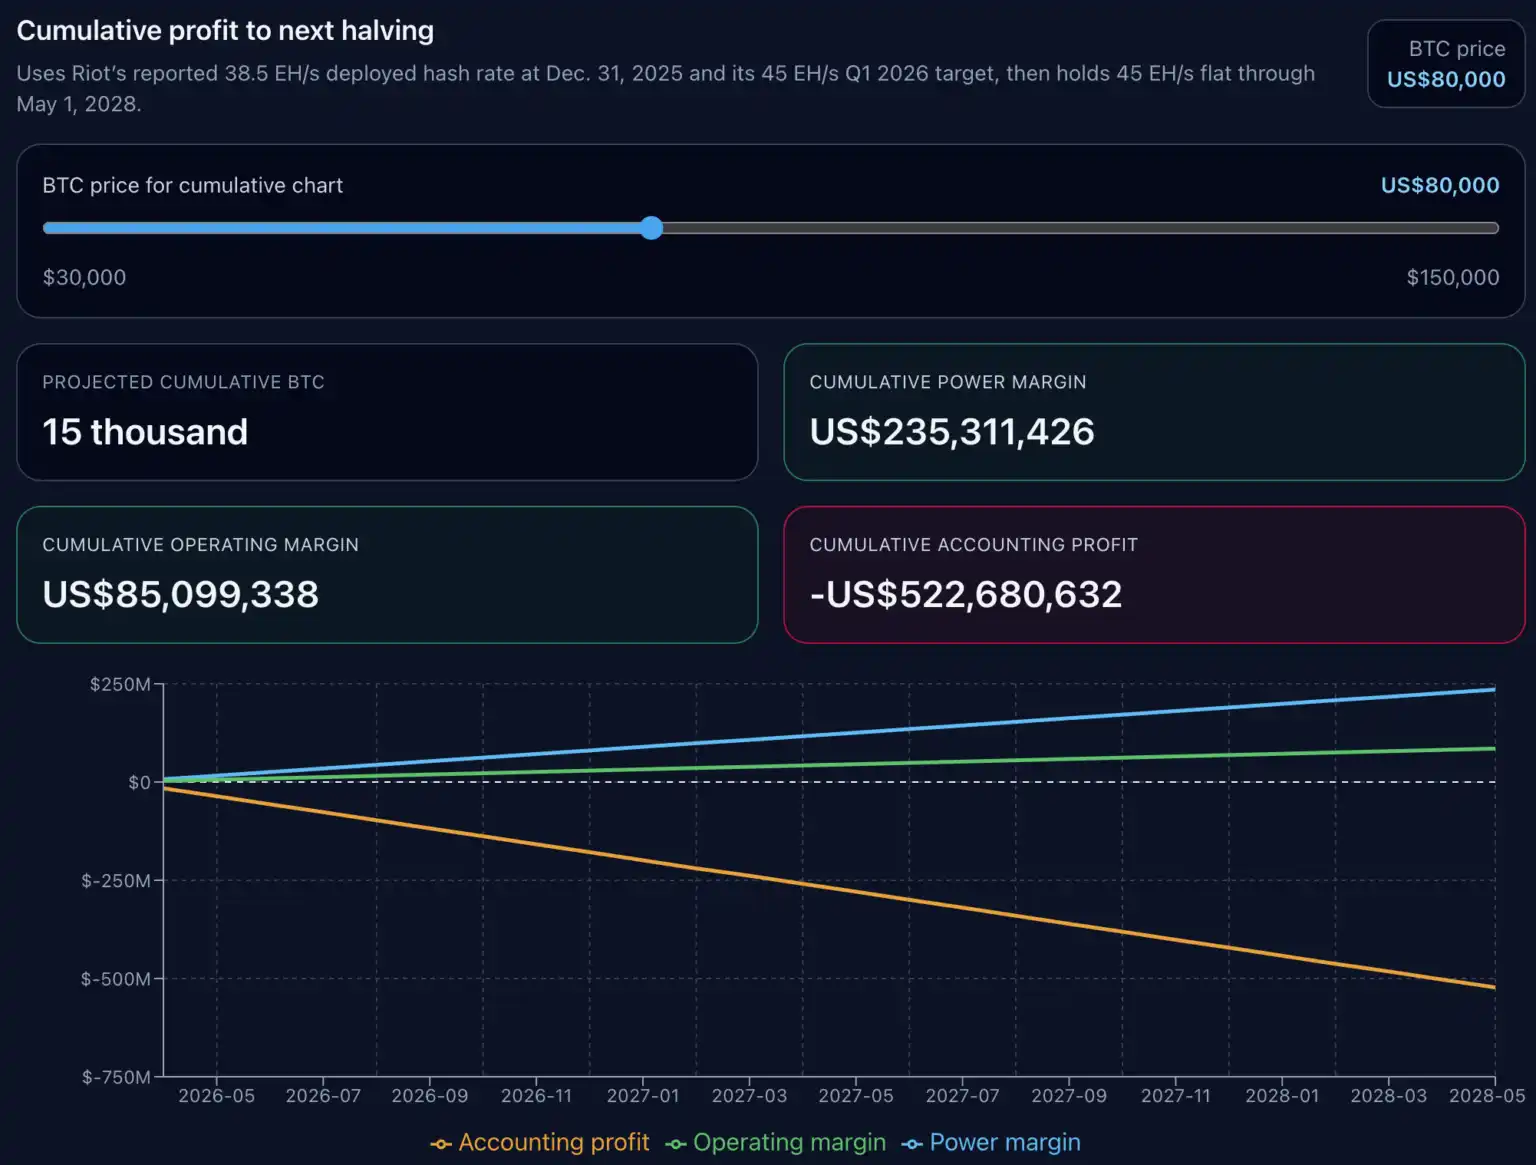
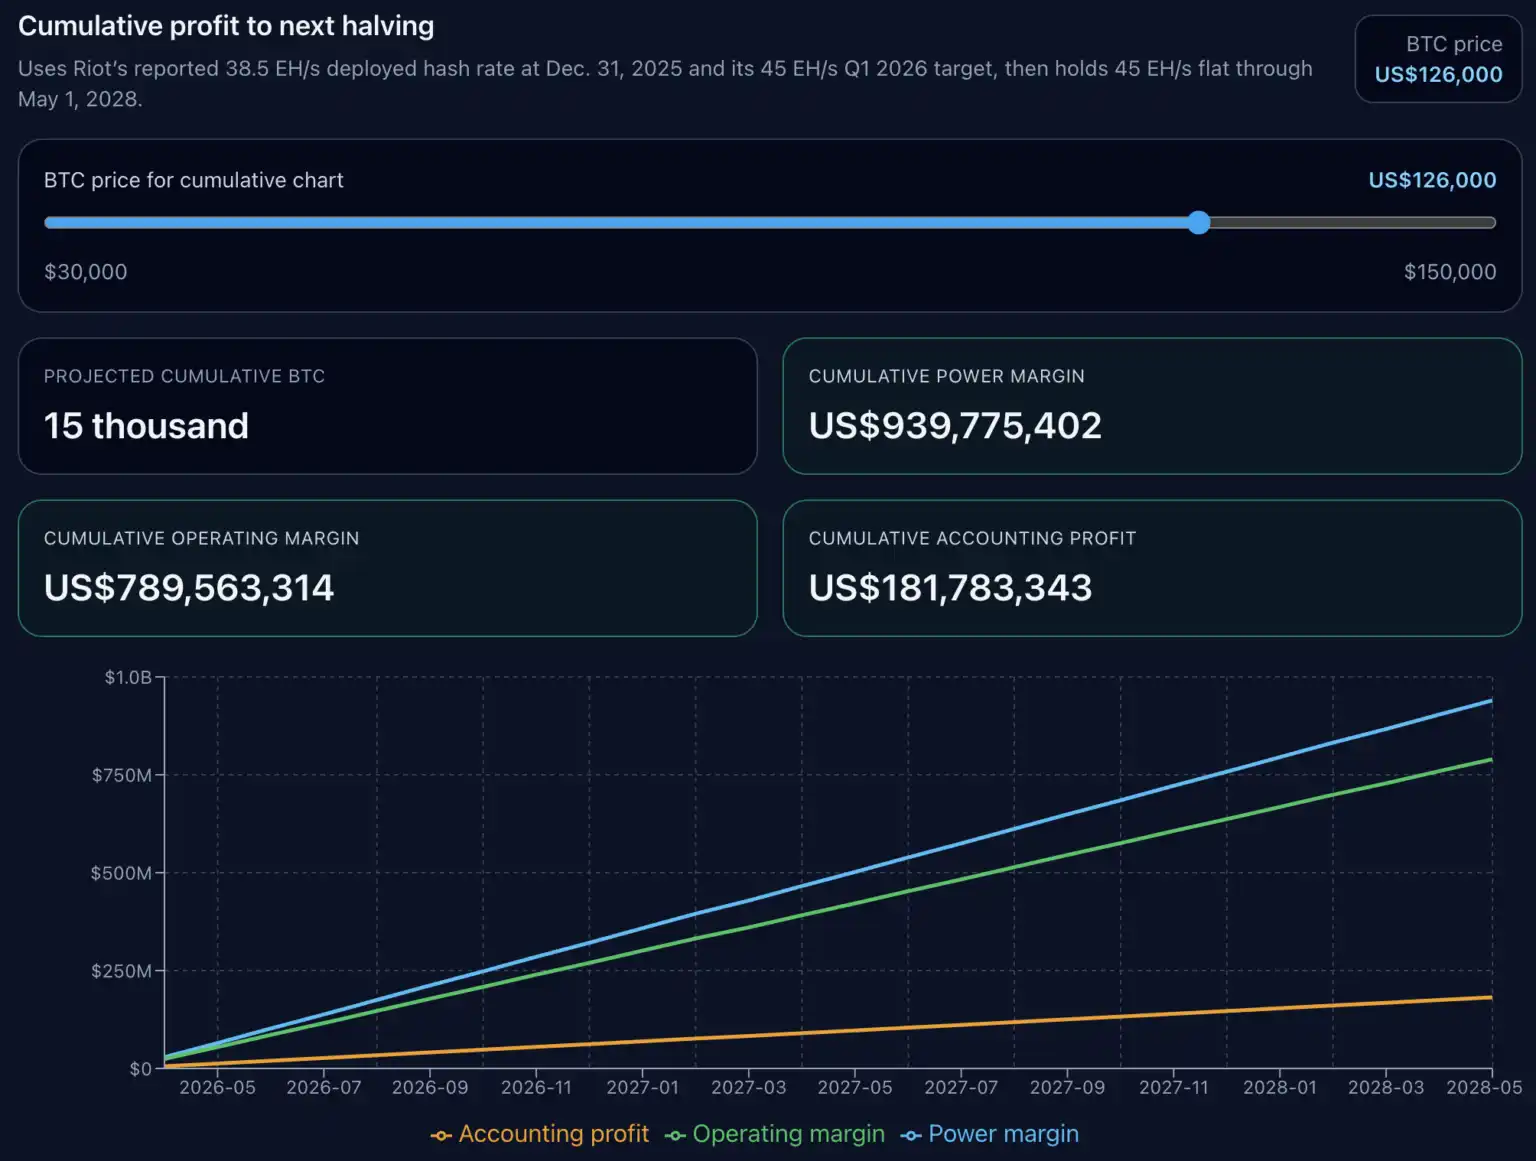
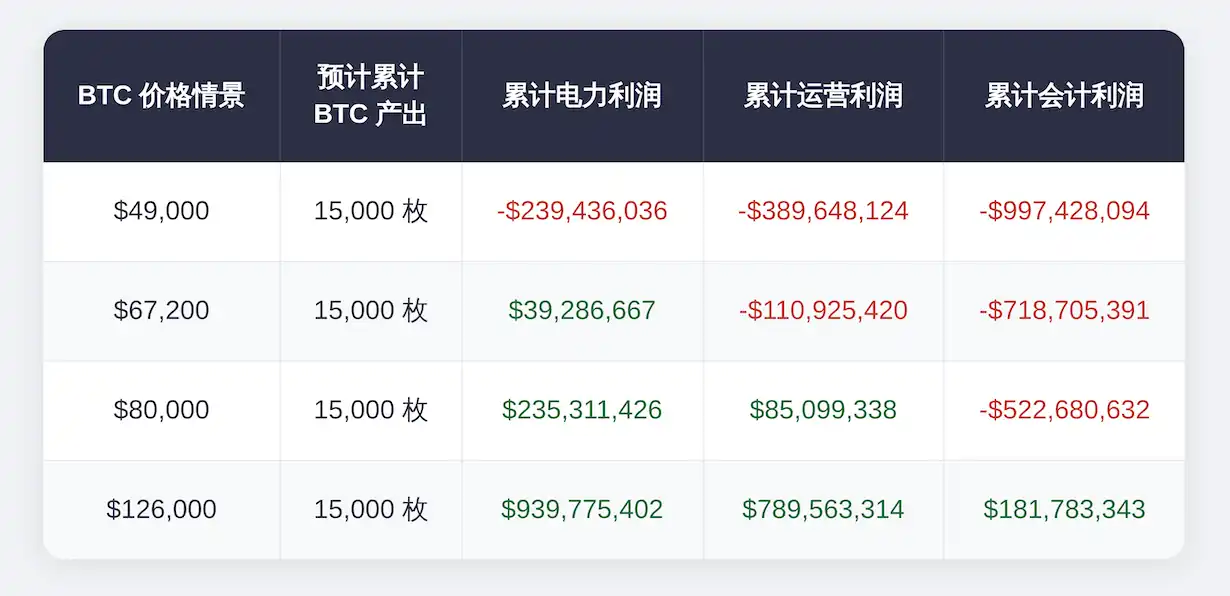
In all four scenarios, the projected cumulative total mined BTC is 15,000 coins; what changes is the profit structure.

In the $49,000 scenario, Riot's cumulative electricity profit is -$239,436,036, cumulative operational profit is -$389,648,124, and cumulative accounting profit is -$997,428,094.

In the $67,200 scenario, cumulative electricity profit turns positive to $39,286,667, but cumulative operational profit remains negative at -$110,925,420, and cumulative accounting profit is -$718,705,391.

In the $80,000 scenario, cumulative operational profit turns positive to $85,099,338, but cumulative accounting profit remains negative at -$522,680,632.

Only in the $126,000 scenario do all three lines turn positive, with a cumulative accounting profit of $181,783,343.

Miners can maintain positive electricity returns for extended periods yet still fail to cover broader operational costs; they can also be operationally positive while still far from accounting profitability. The Riot case shows this gap between these two states is substantial.

In the model, the gap between the electricity break-even point and the full accounting break-even point is approximately $49,495/BTC. This spread helps explain why miners might appear healthy at the hashrate scheduling level but seem stretched thin at the reported profitability level.

Our cumulative charts do not predict future difficulty, fees, downtime, demand response income, financing, or new capital expenditures, only assuming current per-BTC economics remain constant and projecting them along Riot's planned hashrate path.

This limitation does not affect the core signal the model conveys: with other economic factors held constant, fixing these parameters, the discussion before the next halving will still largely depend on the BTC price.

For Riot, the model achieves cumulative accounting profitability in the $126,000 scenario, but in absolute terms, this critical point is $114,200.

Implications of the Riot Case for the Entire US Mining Sector

For US miners, the broader implication is direct: price alone cannot solve operational problems; machine efficiency and electricity price remain the first hurdles.

Regarding cost sensitivity, we compared three ASIC presets: Bitmain S21 (17.5 J/TH), MicroBT M60S (18.5 J/TH), and Antminer S19 Pro (29.5 J/TH), all using the Texas industrial reference electricity price.

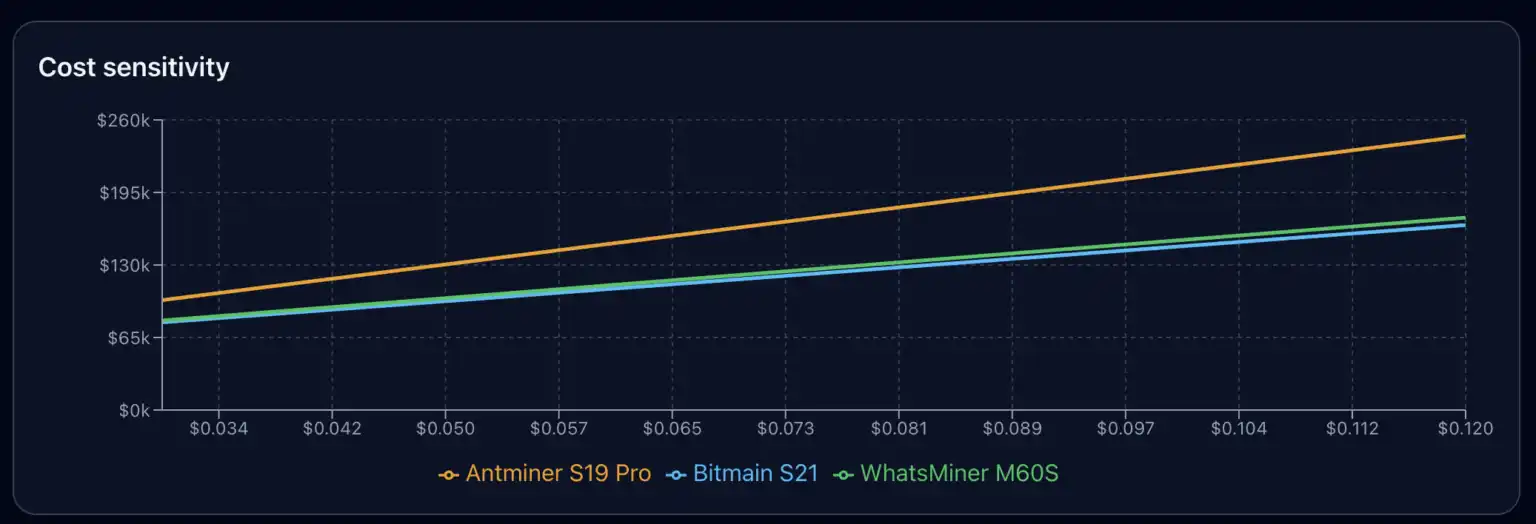
Within this electricity price range, the per-BTC cost for the S19 Pro remains higher than the newer models. The two new models have similar costs, while the less efficient miner maintains a significantly higher cost line throughout the chart.

This conclusion applies beyond Riot. Riot's non-electricity cost layer and depreciation assumptions are company-specific; other miners may have different overhead bases, different useful life assumptions, different demand response income structures, or different actual electricity mixes. But the applicability of the three-tier analysis framework itself is not affected.

First tier: Electricity cost. Second tier: Operational cost. Third tier: Accounting cost.

Companies that survive low-price cycles often easily cross the first tier. Companies that compound growth through cycles...

Related Questions

QWhat are the three layers of the Bitcoin mining cost structure as revealed by Riot Platforms' financial data?

AThe three layers are: 1) Electricity cost, which determines short-term operational decisions; 2) Operational cost, which includes non-power operational expenses and determines if the overall business is sustainable; 3) Accounting cost, which includes non-cash depreciation and determines the final reported profitability.

QAt what Bitcoin price does Riot Platforms break even on its electricity costs according to the model?

ARiot Platforms breaks even on its electricity costs at a Bitcoin price of $64,635 per BTC.

QWhat is the full accounting break-even price for Riot Platforms, and what major cost component pushes it so high?

AThe full accounting break-even price for Riot Platforms is $114,130 per BTC. The major cost component that pushes it this high is the non-cash depreciation expense, which amounts to approximately $39,687 per BTC.

QWhy can a mining company like Riot show a profit at the electricity level but still report an overall accounting loss?

AA mining company can show a profit at the electricity level if the Bitcoin price covers the direct power cost. However, it can still report an overall accounting loss because the broader operational costs (e.g., salaries, maintenance) and significant non-cash accounting depreciation expenses are not covered by that price.

QWhat does the Riot case study suggest about the relationship between ASIC efficiency and mining profitability?

AThe Riot case study highlights that ASIC efficiency (measured in J/TH) is a critical first hurdle for profitability. Newer, more efficient models like the Bitmain S21 have a significantly lower cost per BTC compared to older, less efficient models like the Antminer S19 Pro, especially at a given electricity price. This efficiency directly impacts the first layer of the cost structure (electricity cost).

Related Reads

Google and Amazon Simultaneously Invest Heavily in a Competitor: The Most Absurd Business Logic of the AI Era Is Becoming Reality

In a span of four days, Amazon announced an additional $25 billion investment, and Google pledged up to $40 billion—both direct competitors pouring over $65 billion into the same AI startup, Anthropic. Rather than a typical venture capital move, this signals the latest escalation in the cloud wars. The core of the deal is not equity but compute pre-orders: Anthropic must spend the majority of these funds on AWS and Google Cloud services and chips, effectively locking in massive future compute consumption. This reflects a shift in cloud market dynamics—enterprises now choose cloud providers based on which hosts the best AI models, not just price or stability. With OpenAI deeply tied to Microsoft, Anthropic’s Claude has become the only viable strategic asset for Google and Amazon to remain competitive. Anthropic’s annualized revenue has surged to $30 billion, and it is expanding into verticals like biotech, positioning itself as a cross-industry AI infrastructure layer. However, this funding comes with constraints: Anthropic’s independence is challenged as it balances two rival investors, its safety-first narrative faces pressure from regulatory scrutiny, and its path to IPO introduces new financial pressures. Globally, this accelerates a "tri-polar" closed-loop structure in AI infrastructure, with Microsoft-OpenAI, Google-Anthropic, and Amazon-Anthropic forming exclusive model-cloud alliances. In contrast, China’s landscape differs—investments like Alibaba and Tencent backing open-source model firm DeepSeek reflect a more decoupled approach, though closed-source models from major cloud providers still dominate. The $65 billion bet is ultimately about securing a seat at the table in an AI-defined future—where missing the model layer means losing the cloud war.

marsbit4h ago

Google and Amazon Simultaneously Invest Heavily in a Competitor: The Most Absurd Business Logic of the AI Era Is Becoming Reality

marsbit4h ago

Computing Power Constrained, Why Did DeepSeek-V4 Open Source?

DeepSeek-V4 has been released as a preview open-source model, featuring 1 million tokens of context length as a baseline capability—previously a premium feature locked behind enterprise paywalls by major overseas AI firms. The official announcement, however, openly acknowledges computational constraints, particularly limited service throughput for the high-end DeepSeek-V4-Pro version due to restricted high-end computing power. Rather than competing on pure scale, DeepSeek adopts a pragmatic approach that balances algorithmic innovation with hardware realities in China’s AI ecosystem. The V4-Pro model uses a highly sparse architecture with 1.6T total parameters but only activates 49B during inference. It performs strongly in agentic coding, knowledge-intensive tasks, and STEM reasoning, competing closely with top-tier closed models like Gemini Pro 3.1 and Claude Opus 4.6 in certain scenarios. A key strategic product is the Flash edition, with 284B total parameters but only 13B activated—making it cost-effective and accessible for mid- and low-tier hardware, including domestic AI chips from Huawei (Ascend), Cambricon, and Hygon. This design supports broader adoption across developers and SMEs while stimulating China's domestic semiconductor ecosystem. Despite facing talent outflow and intense competition in user traffic—with rivals like Doubao and Qianwen leading in monthly active users—DeepSeek has maintained technical momentum. The release also comes amid reports of a new funding round targeting a valuation exceeding $10 billion, potentially setting a new record in China’s LLM sector. Ultimately, DeepSeek-V4 represents a shift toward open yet realistic infrastructure development in the constrained compute landscape of Chinese AI, emphasizing engineering efficiency and domestic hardware compatibility over pure model scale.

marsbit5h ago

Computing Power Constrained, Why Did DeepSeek-V4 Open Source?

marsbit5h ago

Trading

Spot
Futures

Hot Articles

What is $BITCOIN

DIGITAL GOLD ($BITCOIN): A Comprehensive Analysis Introduction to DIGITAL GOLD ($BITCOIN) DIGITAL GOLD ($BITCOIN) is a blockchain-based project operating on the Solana network, which aims to combine the characteristics of traditional precious metals with the innovation of decentralized technologies. While it shares a name with Bitcoin, often referred to as “digital gold” due to its perception as a store of value, DIGITAL GOLD is a separate token designed to create a unique ecosystem within the Web3 landscape. Its goal is to position itself as a viable alternative digital asset, although specifics regarding its applications and functionalities are still developing. What is DIGITAL GOLD ($BITCOIN)? DIGITAL GOLD ($BITCOIN) is a cryptocurrency token explicitly designed for use on the Solana blockchain. In contrast to Bitcoin, which provides a widely recognized value storage role, this token appears to focus on broader applications and characteristics. Notable aspects include: Blockchain Infrastructure: The token is built on the Solana blockchain, known for its capacity to handle high-speed and low-cost transactions. Supply Dynamics: DIGITAL GOLD has a maximum supply capped at 100 quadrillion tokens (100P $BITCOIN), although details regarding its circulating supply are currently undisclosed. Utility: While precise functionalities are not explicitly outlined, there are indications that the token could be utilized for various applications, potentially involving decentralized applications (dApps) or asset tokenization strategies. Who is the Creator of DIGITAL GOLD ($BITCOIN)? At present, the identity of the creators and development team behind DIGITAL GOLD ($BITCOIN) remains unknown. This situation is typical among many innovative projects within the blockchain space, particularly those aligning with decentralized finance and meme coin phenomena. While such anonymity may foster a community-driven culture, it intensifies concerns about governance and accountability. Who are the Investors of DIGITAL GOLD ($BITCOIN)? The available information indicates that DIGITAL GOLD ($BITCOIN) does not have any known institutional backers or prominent venture capital investments. The project seems to operate on a peer-to-peer model focused on community support and adoption rather than traditional funding routes. Its activity and liquidity are primarily situated on decentralized exchanges (DEXs), such as PumpSwap, rather than established centralized trading platforms, further highlighting its grassroots approach. How DIGITAL GOLD ($BITCOIN) Works The operational mechanics of DIGITAL GOLD ($BITCOIN) can be elaborated on based on its blockchain design and network attributes: Consensus Mechanism: By leveraging Solana’s unique proof-of-history (PoH) combined with a proof-of-stake (PoS) model, the project ensures efficient transaction validation contributing to the network's high performance. Tokenomics: While specific deflationary mechanisms have not been extensively detailed, the vast maximum token supply implies that it may cater to microtransactions or niche use cases that are still to be defined. Interoperability: There exists the potential for integration with Solana’s broader ecosystem, including various decentralized finance (DeFi) platforms. However, the details regarding specific integrations remain unspecified. Timeline of Key Events Here is a timeline that highlights significant milestones concerning DIGITAL GOLD ($BITCOIN): 2023: The initial deployment of the token occurs on the Solana blockchain, marked by its contract address. 2024: DIGITAL GOLD gains visibility as it becomes available for trading on decentralized exchanges like PumpSwap, allowing users to trade it against SOL. 2025: The project witnesses sporadic trading activity and potential interest in community-led engagements, although no noteworthy partnerships or technical advancements have been documented as of yet. Critical Analysis Strengths Scalability: The underlying Solana infrastructure supports high transaction volumes, which could enhance the utility of $BITCOIN in various transaction scenarios. Accessibility: The potential low trading price per token could attract retail investors, facilitating wider participation due to fractional ownership opportunities. Risks Lack of Transparency: The absence of publicly known backers, developers, or an audit process may yield skepticism regarding the project's sustainability and trustworthiness. Market Volatility: The trading activity is heavily reliant on speculative behavior, which can result in significant price volatility and uncertainty for investors. Conclusion DIGITAL GOLD ($BITCOIN) emerges as an intriguing yet ambiguous project within the rapidly evolving Solana ecosystem. While it attempts to leverage the “digital gold” narrative, its departure from Bitcoin's established role as a store of value underscores the need for a clearer differentiation of its intended utility and governance structure. Future acceptance and adoption will likely depend on addressing the current opacity and defining its operational and economic strategies more explicitly. Note: This report encompasses synthesised information available as of October 2023, and developments may have transpired beyond the research period.

363 Total ViewsPublished 2025.05.13Updated 2025.05.13

What is $BITCOIN

Discussions

Welcome to the HTX Community. Here, you can stay informed about the latest platform developments and gain access to professional market insights. Users' opinions on the price of BTC (BTC) are presented below.

活动图片