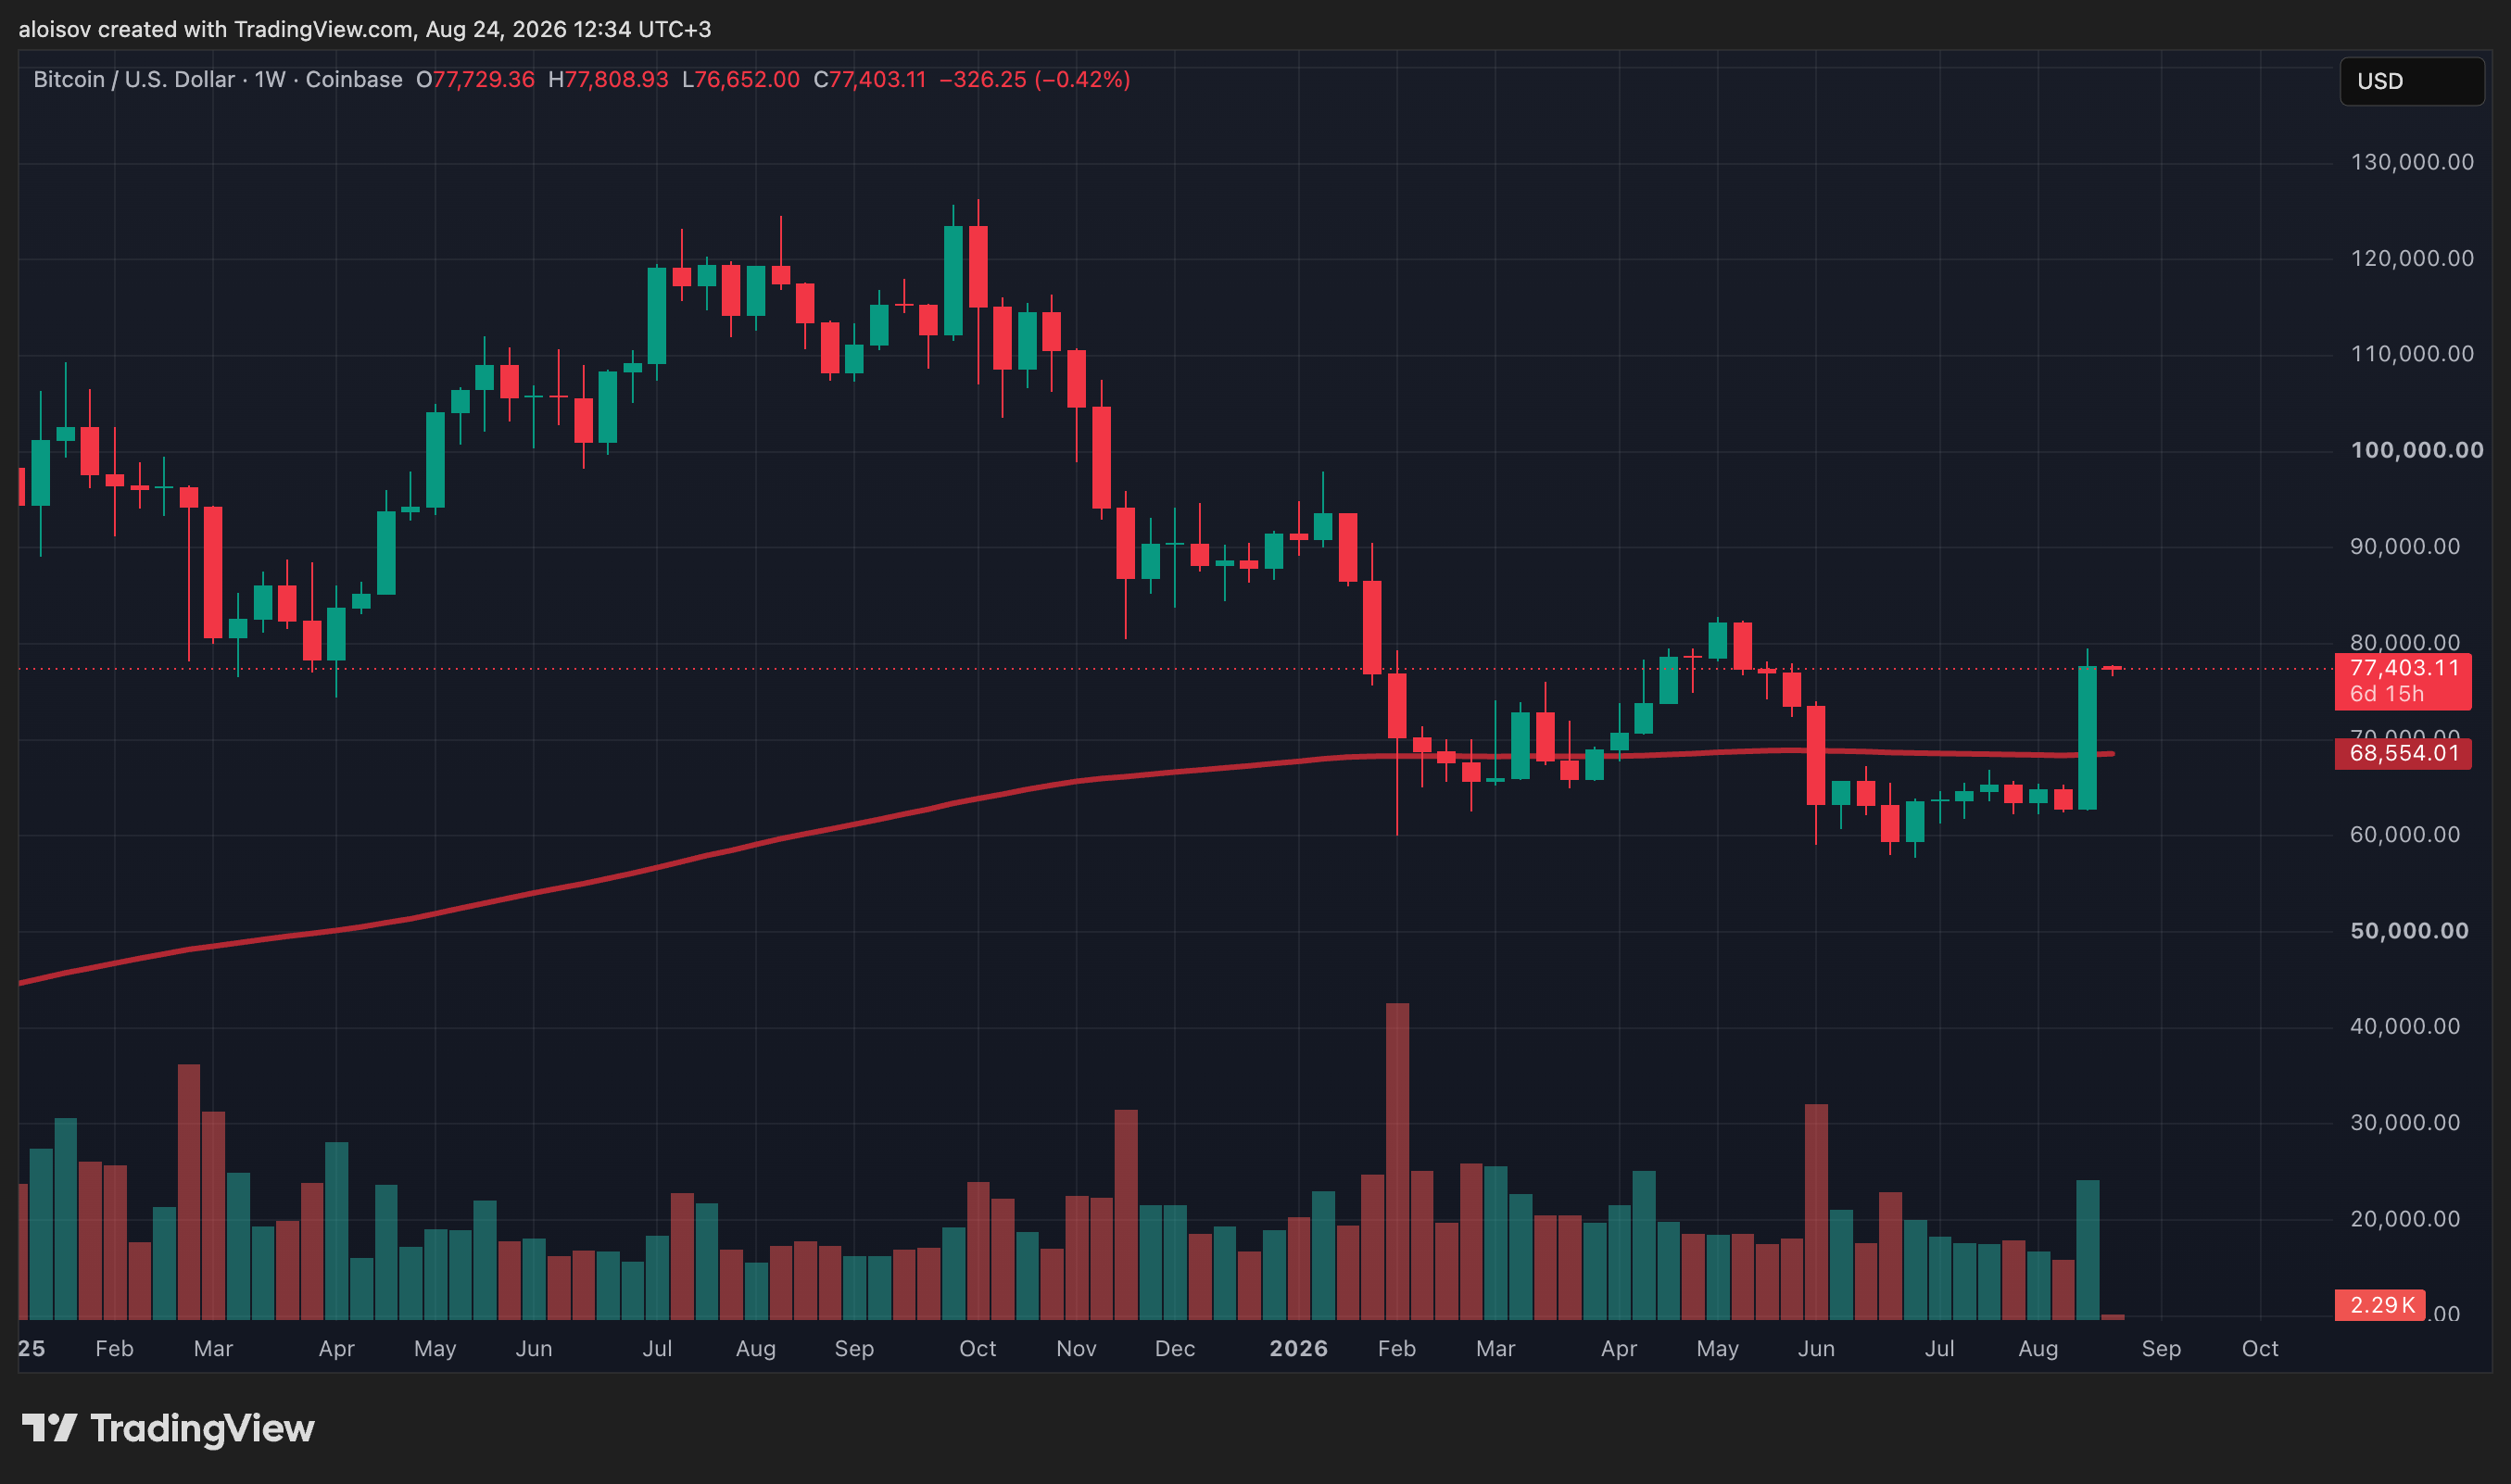
Trading firm QCP Capital has published a fresh report analyzing the sharp rise in Bitcoin and linking it to changes in the U.S. government bond market. According to the report, Bitcoin had its strongest week since March 2024, gaining over 20% and briefly reaching $79,500 on August 21. QCP Capital analysts connect this movement to a shift in interest rates: the yield on 30-year U.S. Treasury bonds approached 5.3%—a high since 2007—while total public debt exceeded $40 trillion.
Against this backdrop, the U.S. Treasury announced it would at least double the volume of bond buyback operations—a liquidity support tool—in the 10-to-20-year and 20-to-30-year maturity segments. The maximum size of a single operation will increase from $2 billion to at least $4 billion, with the buybacks to be conducted from September 9 to November 4. Following the announcement, long-term bond yields fell, the dollar weakened, while Bitcoin and gold rose.
QCP Capital emphasizes: it's important not to confuse these operations with quantitative easing. The Treasury is conducting debt management, not creating new central bank reserves—that is the Fed's role, not the Treasury's. The Treasury itself described the change as a way to enhance liquidity in the long-term nominal bond segment.
The buyback program remains modest compared to the government's overall financing needs. However, as QCP notes, the episode demonstrates the growing significance of liquidity at the long end of the Treasury yield curve for broader financial conditions—especially against the backdrop of elevated borrowing and growing public debt.
From Short Squeeze to Broader Demand
The QCP Capital report separately examines the mechanics of the rally. The initial impulse, according to the firm's analysts, was largely related to market positioning: a sharp breakout of key levels occurred on Wednesday, accompanied by massive short position liquidations, which accelerated forced buying. By Friday, Bitcoin reached a three-month high around $79,500 before slightly pulling back from the peak.
However, the move wasn't solely a technical squeeze. Inflows into spot Bitcoin and Ethereum exchange-traded funds (ETFs) accelerated along with the price rise. As QCP Capital points out, U.S. spot Bitcoin and Ethereum ETFs attracted $2.6 billion over the week—the strongest combined weekly result since October 2025. Bitcoin funds accounted for about $1.9 billion, Ethereum funds for approximately $697 million. For comparison, the week before, the funds showed a combined outflow of $392 million.
The dynamics of capital inflows into Bitcoin ETFs during the week looked like this:
-
Wednesday — $517 million;
-
Thursday — $606 million, with about $503 million going to BlackRock's IBIT fund;
-
Friday — inflows slowed to around $307 million.
QCP Capital notes that this distinction is important from a market structure perspective. Short squeezes can sharply amplify the initial price movement, whereas subsequent ETF inflows are an independent indicator of spot market participation, manifesting after positioning has played its role.
Volatility Awakens
A separate section of the QCP Capital report is devoted to the options market, which reacted to increased realized price volatility. According to QCP's own desk data, Bitcoin's implied volatility on the near end of the curve spiked sharply after a calm start to August. The report explains that actual price movements in individual sessions exceeded the levels previously priced into options as "breakeven" daily fluctuations. This triggered a revaluation of the entire near-term volatility curve.
To help the reader understand the logic, it's worth explaining these terms. Implied volatility is the market's expectation of future price swings, priced into option costs: the higher the expected fluctuations, the more expensive the option. When actual price movement (realized volatility) exceeds what was priced into the options, traders who sold those options start incurring losses—and a market revaluation occurs: implied volatility rises following reality.
At the same time, as QCP Capital notes, the so-called skew—the difference in the cost of put and call options, which shows how much more expensive the market values downside protection compared to upside protection—remained relatively subdued. In other words, the options market more strongly revalued the expected range of future movements than the relative cost of near-term downside protection.
Practically, this means the following: if an investor wants to hedge a Bitcoin position by buying near-the-money put options (i.e., with a strike price close to the current asset price), the cost of such protection hasn't risen as sharply as the overall price of options. The advantage of this approach is the relatively accessible cost of insurance against a correction amid a general rise in volatility. The risk is that buying put options itself involves paying a premium, which expires if the expected price drop doesn't materialize, and the increase in implied volatility generally makes any options strategies—both protective and speculative—more expensive.
This detail, according to QCP Capital, is particularly important this week, when several major macroeconomic and corporate events are concentrated within a short timeframe.
Three Stress Tests This Week
The first test is U.S. economic data. On Tuesday, July new home sales statistics will be released, and on Wednesday—two important releases at once: the second estimate of U.S. Q2 GDP and July personal income and spending data. The latter report includes the Personal Consumption Expenditures (PCE) index—the Fed's preferred inflation gauge. According to preliminary estimates, the U.S. economy grew at an annualized rate of 1.5% in the second quarter—down from 2.1% in Q1.
The second test is related to the corporate sector: Nvidia reports on Wednesday. Given the scale of investments in artificial intelligence infrastructure across the U.S. economy, its results and guidance will provide another benchmark for AI infrastructure demand and the capex cycle, which increasingly influences the stock market and corporate financing.
The third, and perhaps main test, is a speech by Fed Chair Kevin Warsh at the Jackson Hole symposium. The key address is scheduled for Friday, August 28, at 10:00 AM U.S. Eastern Time (22:00 Singapore time)—the timing is confirmed by the Fed's official calendar. Since taking office, Warsh has deliberately given the market fewer forward signals, so his speech is interesting not so much for specific hints about a September decision, but for how he describes inflation, economic growth, and the overall approach to monetary policy.
Currently, the market is pricing in only about a 30% probability of a rate hike in September—a minority of scenarios. This makes the upcoming inflation data and Warsh's overall tone particularly significant ahead of the Federal Open Market Committee (FOMC) meeting on September 15–16.
What This Means for the Crypto Market
By the end of the week analyzed by QCP Capital, the backdrop against which the market trades has changed. Bitcoin broke out of the range it had been in for most of August, ETF inflows strengthened, and volatility was noticeably revalued upward.
At the same time, QCP Capital emphasizes, the fundamental macroeconomic questions haven't gone away. Long-term government bond yields remain elevated, government financing needs are significant, inflation is above the Fed's target, and AI capital expenditures continue to compete for available funding.
The expansion of the Treasury's buyback program, in the analysts' view, should not be perceived as the start of a new monetary easing cycle. Rather, it once again confirms how crucial the liquidity of the Treasury bond market and yields at the long end of the curve are for overall financial conditions.
The three key events of the week—PCE data, Nvidia's earnings, and the Jackson Hole speech—will give the market three different perspectives on the same backdrop: inflation, economic activity around AI, and monetary policy, respectively.
After a week dominated by positioning and Treasury decisions, the focus shifts to whether macro data will confirm the sustainability of the conditions against which the rally unfolded.
Key Events of the Week
-
Tuesday, August 25 — U.S. July new home sales data;
-
Wednesday, August 26, 20:30 Singapore time — second estimate of U.S. Q2 GDP, July PCE index;
-
Wednesday, August 26 — Nvidia earnings report;
-
Thursday–Saturday, August 27–29 — Economic Policy Symposium in Jackson Hole;
-
Friday, August 28, 22:00 Singapore time — key speech by Fed Chair Kevin Warsh.
AI Opinion
From a machine data analysis perspective, the QCP Capital report captures an effect that rarely receives separate coverage: the link between Treasury operations at the long end of the yield curve and the everyday cost of credit for households. Thirty-year mortgage rates are already among the indicators analysts consider when assessing the pressure of government bond yields on the broader economy—long before that pressure reaches the crypto market.
The macroeconomic link here is two-way. Lower yields supported risk appetite and strengthened Bitcoin, but the same dynamic directly determines borrowing costs for the real economy—mortgages, auto loans, corporate debt. The Treasury's buyback program alleviates a symptom without addressing the cause—growing public debt and elevated borrowing. A question for the reader: if pressure on the long end of the curve resumes after Jackson Hole, which of the two markets—bonds or cryptocurrencies—will be the first to signal an alarm?