Price predictions 12/22: SPX, DXY, BTC, ETH, BNB, XRP, SOL, DOGE, ADA, BCH

cointelegraphPublished on 2025-12-22Last updated on 2025-12-22

Abstract

Bitcoin is attempting a recovery above $90,000, though analysts remain divided on its near-term direction, with some predicting a drop to $74,000. The S&P 500 Index is range-bound, while the US Dollar Index faces resistance. Major altcoins show weak bounces, indicating continued bearish pressure. Ethereum is forming a symmetrical triangle, suggesting uncertainty. BNB, XRP, Solana, Dogecoin, Cardano, and Bitcoin Cash all face key resistance levels, with breakdown risks if support is lost. Overall, the market remains cautious, with potential for further declines if buyers fail to overcome immediate hurdles.

Key points:

  • Bitcoin is attempting to start a recovery, but higher levels are likely to attract sellers.

  • The weak bounce in several altcoins shows that the bears continue to exert pressure.

Bitcoin (BTC) rallied above $90,000 at the start of the new week, indicating that the bulls are attempting a comeback. Analysts are divided in their opinion about BTC’s next major move. While some anticipate a rally to a new all-time high, others expect a drop to as low as $70,000.

Santiment founder Maksim Balashevich is also not convinced that a bottom is in. Balashevich said in a YouTube video that BTC could fall to $74,000 as there is still a lot of optimism online. He added that a drop toward the said level could provide “a very good setup” for traders.

Crypto market data daily view. Source: CoinMarketCap

Although the near-term looks uncertain, BlackRock’s spot Bitcoin exchange-traded fund, iShares Bitcoin Trust (IBIT), $25 billion in year-to-date inflows show potential for the long term.

Bloomberg ETF analyst Eric Balchunas said in a post on X that IBIT, at sixth place, was the only fund in the top cohort with negative returns for the year. If a negative year could attract $25 billion, “imagine the flow potential in a good year,” Balchunas added.

Could BTC and the major altcoins start a relief rally, or will the bears pull the price lower? Let’s analyze the charts of the top 10 cryptocurrencies to find out.

S&P 500 Index price prediction

The S&P 500 Index (SPX) has been range-bound between 6,550 and 6,920 for several days.

SPX daily chart. Source: Cointelegraph/TradingView

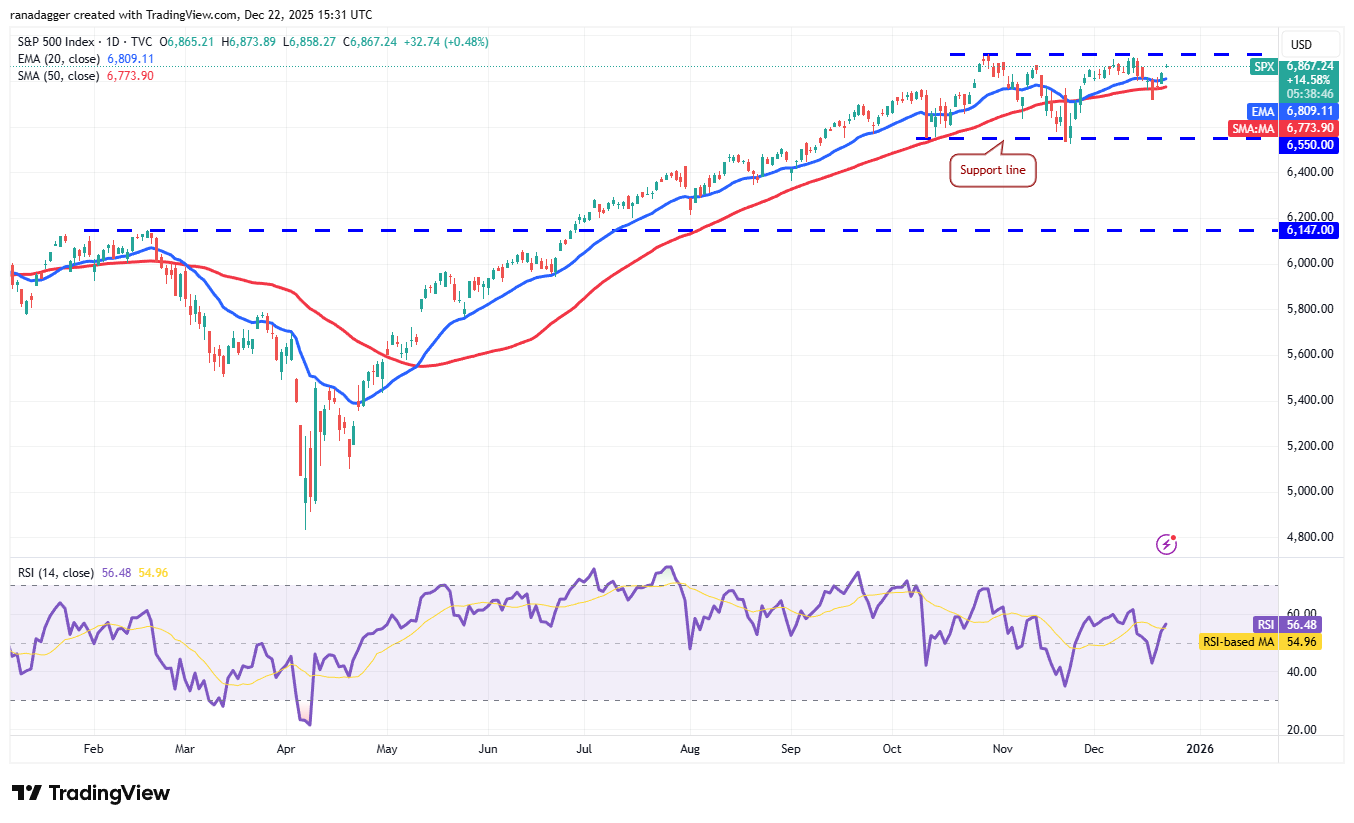
A positive sign is that the bulls are attempting to maintain the price above the moving averages. That improves the possibility of a break above the 6,920 resistance. If that happens, the index could rally toward the 7,290 level.

Sellers are likely to have other plans. They will attempt to defend the overhead resistance and pull the price below the moving averages. If they do that, the index could extend its stay inside the range for some more time. The bears will be back in the driver’s seat on a close below 6,550.

US Dollar Index price prediction

The US Dollar Index (DXY) dipped below the 98.03 support on Tuesday, but the bears could not sustain the lower levels.

DXY daily chart. Source: Cointelegraph/TradingView

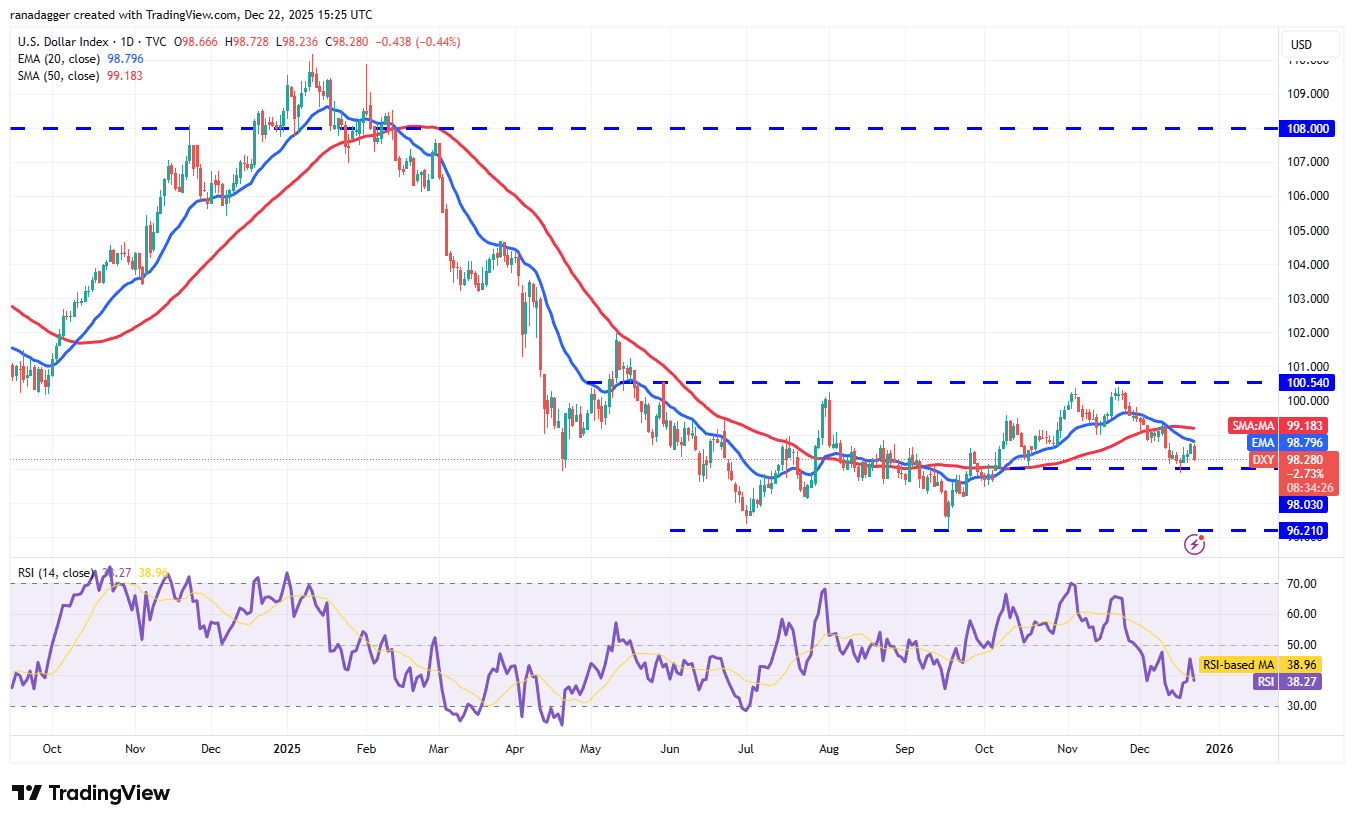
The relief rally reached the 20-day exponential moving average (98.79) on Friday, where the bears are posing a strong challenge. Sellers will attempt to sink the price below the 98.03 support. If they manage to do that, the index may descend to 97.20.

Instead, if the price turns up from 98.03 and breaks above the moving averages, it suggests buying at lower levels. The index may then climb to the stiff overhead resistance at 100.54. Sellers are expected to vigorously defend the 100.54 level, as a break above it may start a new uptrend.

Bitcoin price prediction

BTC’s bounce off the $84,000 level is facing resistance at the 20-day EMA ($89,322), but a positive sign is that the bulls have kept up the pressure.

BTC/USDT daily chart. Source: Cointelegraph/TradingView

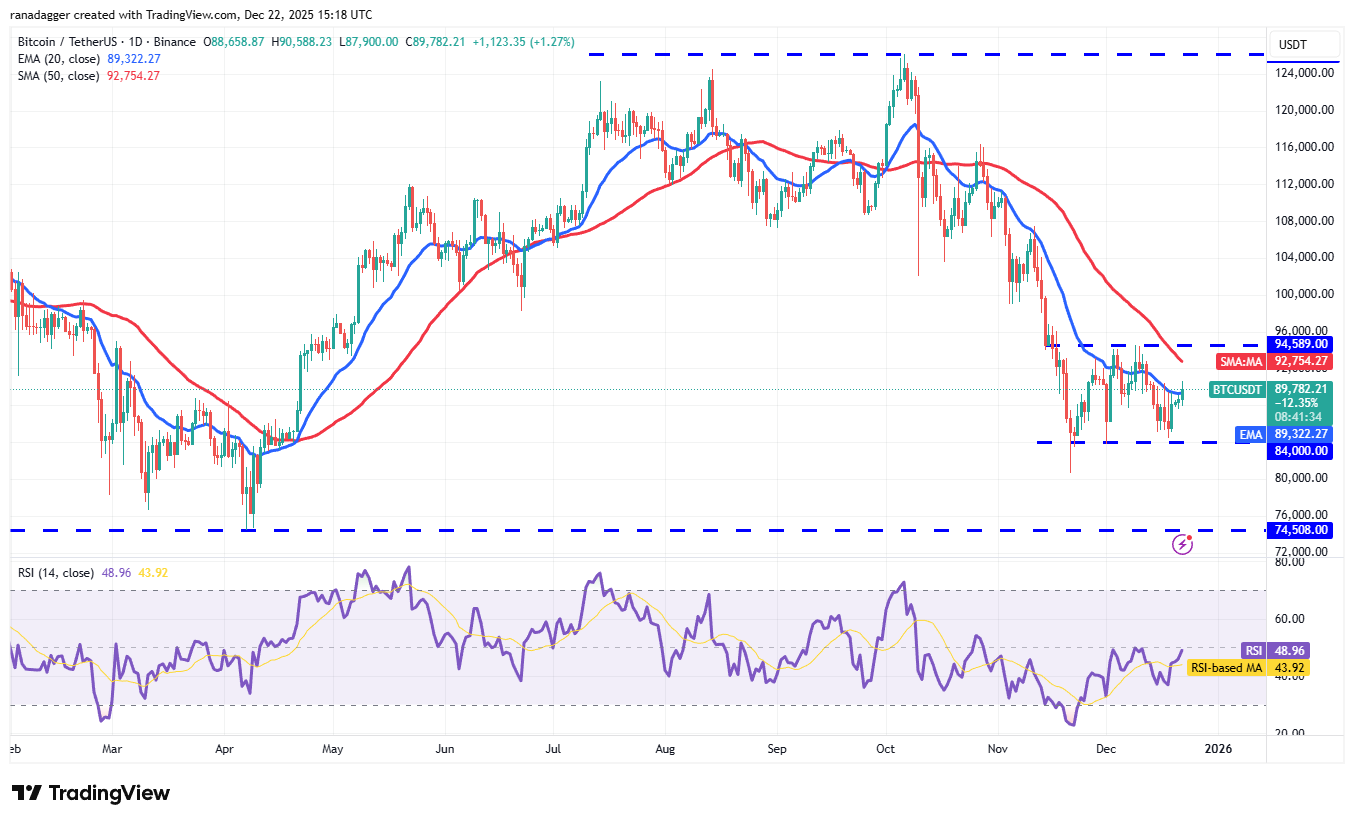
A close above the 20-day EMA opens the doors for a rise to the 50-day simple moving average ($92,754) and then to the overhead resistance at $94,589. Sellers are expected to defend the $94,589 level with all their might, as a close above it suggests that the corrective phase may be over.

If the Bitcoin price closes above $94,589, the BTC/USDT pair could surge to $100,000 and later to $107,500. On the downside, bears will regain control on a close below the $84,000 support.

Ether price prediction

Ether (ETH) has formed a symmetrical triangle pattern, indicating uncertainty about the next directional move.

ETH/USDT daily chart. Source: Cointelegraph/TradingView

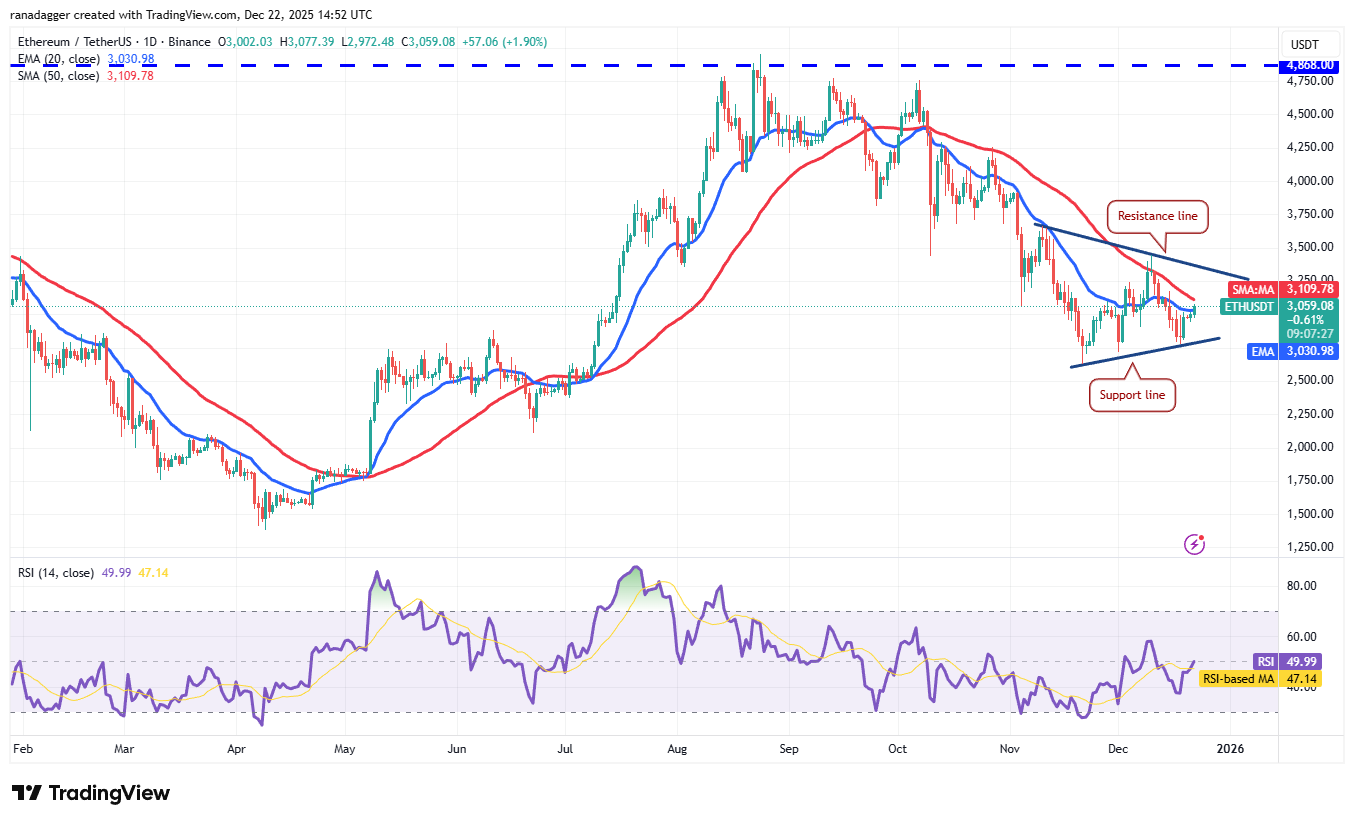
If buyers drive the price above the moving averages, the ETH/USDT pair could rally to the resistance line. Sellers will attempt to defend the resistance line and keep the Ether price inside the triangle, but if the bulls prevail, the pair could surge to $4,000 and then to the pattern target of $4,386.

Contrarily, if the price turns down from the moving averages and breaks below the support line, it signals an advantage to the bears. The pair may then plummet to $2,111.

BNB price prediction

BNB’s (BNB) rebound off the uptrend line has reached the 20-day EMA ($872), where the bears are expected to step in.

BNB/USDT daily chart. Source: Cointelegraph/TradingView

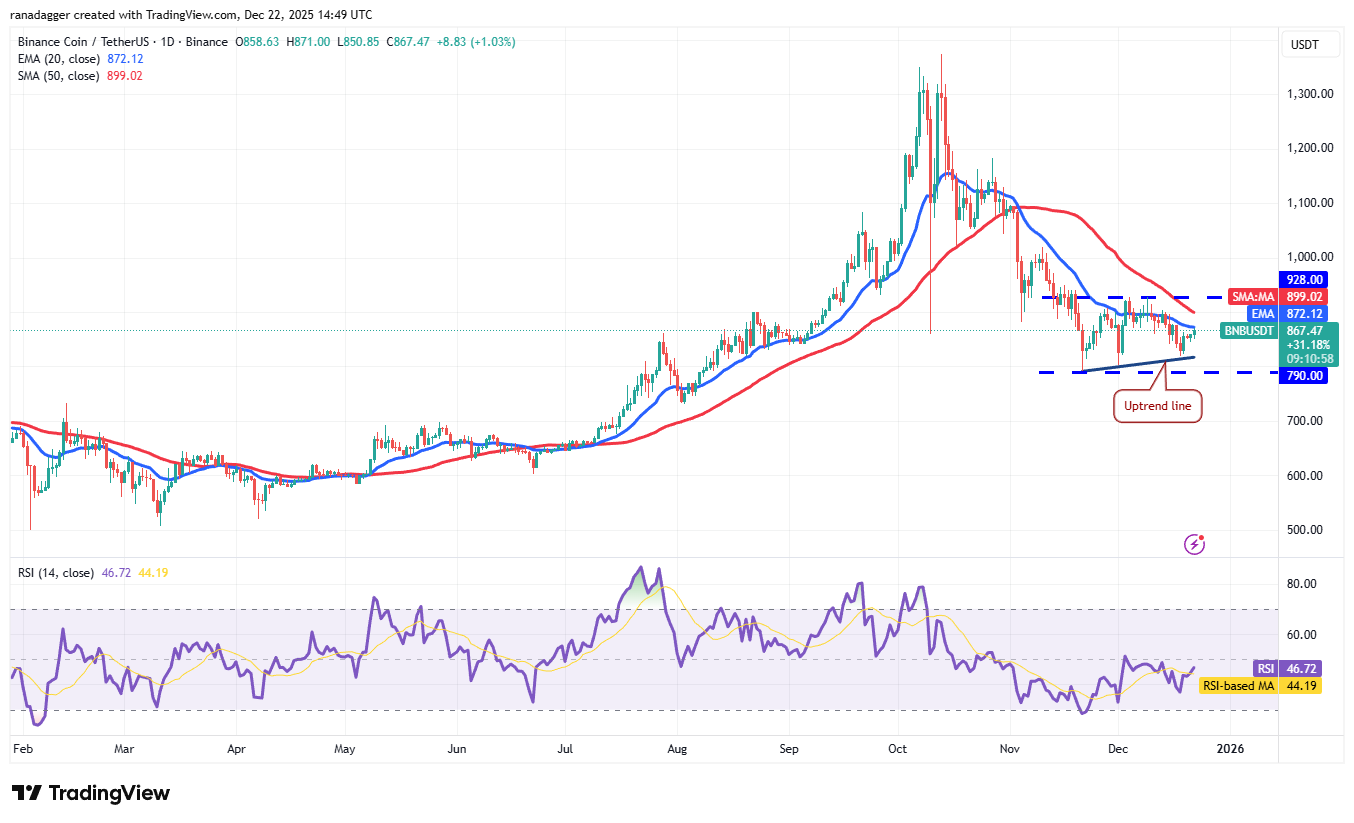
If the price turns down sharply from the moving averages and breaks below the uptrend line, it increases the risk of a break below $790. If that happens, the BNB/USDT pair could tumble to $730.

Contrary to this assumption, if the BNB price continues higher and breaks above $928, it suggests that the correction is over. The pair may then ascend to $1,019 and, after that, to $1,100.

XRP price prediction

XRP’s (XRP) bounce off the support line of the descending channel pattern is facing resistance at the 20-day EMA ($1.98).

XRP/USDT daily chart. Source: Cointelegraph/TradingView

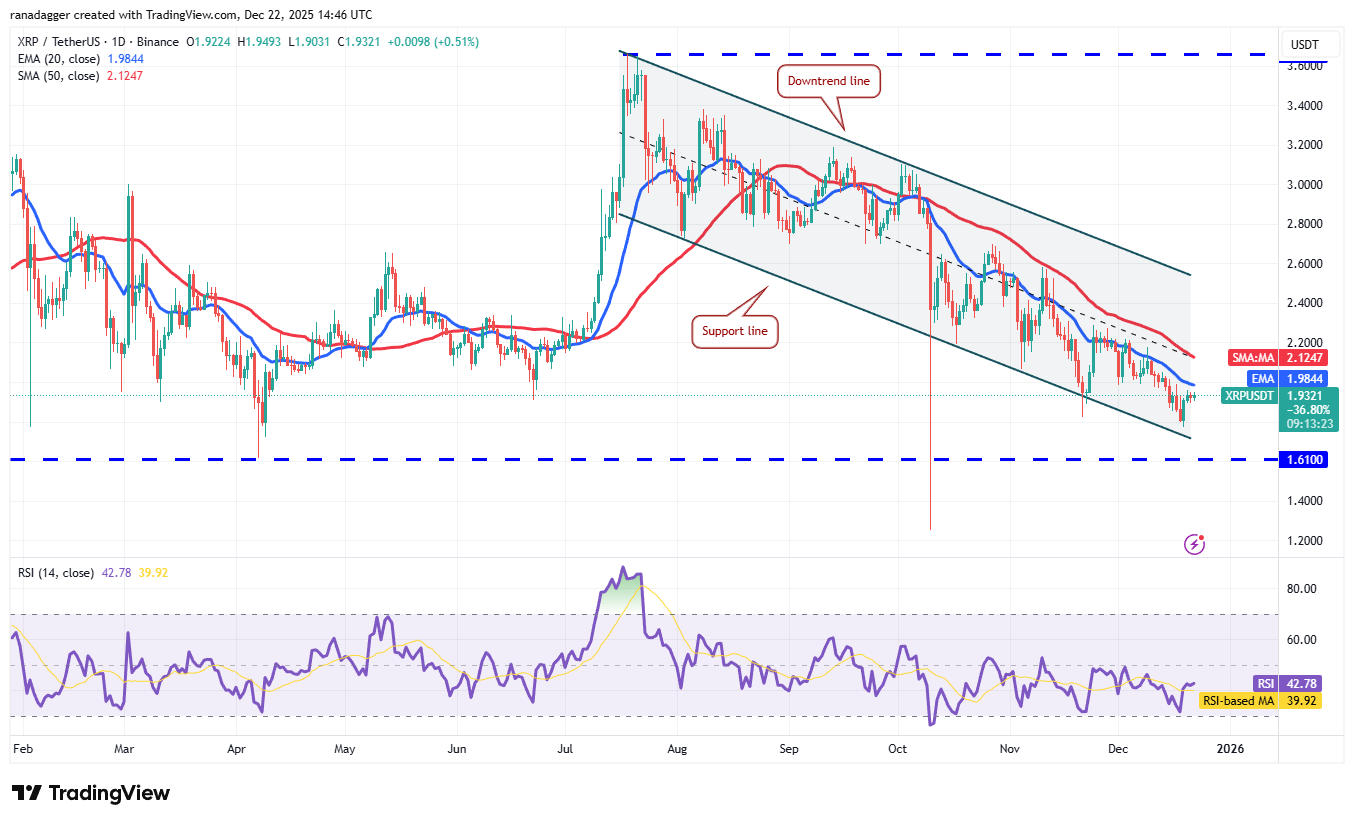
If the price turns down sharply from the 20-day EMA, the bears will attempt to pull the XRP/USDT pair to the $1.61 support. This is a critical level to watch out for in the near term, as a break below it may accelerate selling. The XRP price may then collapse to the Oct. 10 low of $1.25.

This negative view will be invalidated in the near term if the price continues higher and breaks above the moving averages. The pair may then climb to the downtrend line. A close above the downtrend line signals a potential trend change.

Solana price prediction

Solana (SOL) remains below the moving averages, but the positive divergence on the RSI suggests that the selling pressure is reducing.

SOL/USDT daily chart. Source: Cointelegraph/TradingView

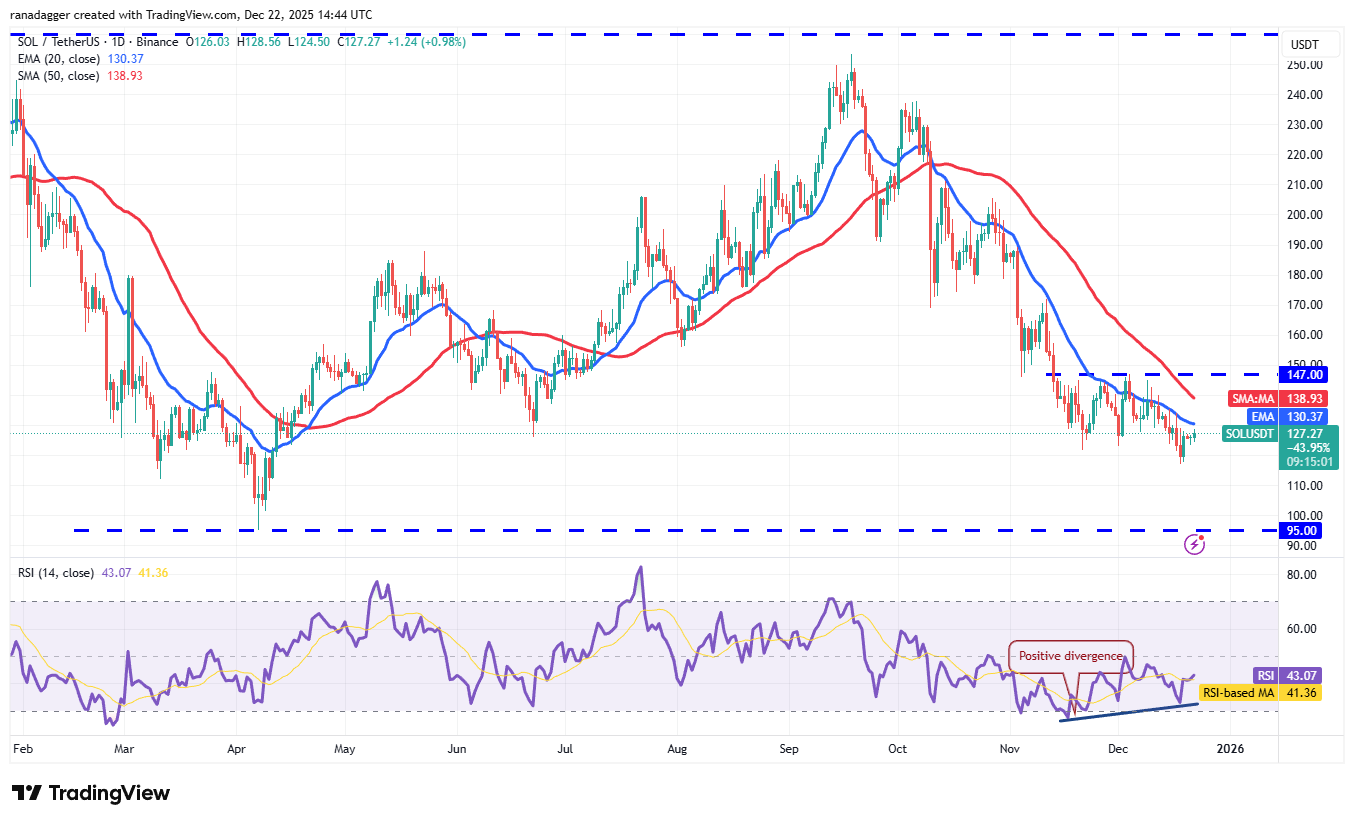
If the price breaks above the 20-day EMA ($130), the SOL/USDT pair could rise to the overhead resistance at $147. A close above $147 signals that the bulls are back in the game. The pair may then rally to $172.

Related: Bitcoin ‘Santa rally’ targets $120K as key BTC metric flips bullish

On the other hand, if the Solana price turns down sharply from the 20-day EMA, it indicates a negative sentiment. The pair could then continue its slide to $110 and eventually to the solid support at $95.

Dogecoin price prediction

Dogecoin (DOGE) climbed back above the breakdown level of $0.13 on Friday, indicating buying at lower levels.

DOGE/USDT daily chart. Source: Cointelegraph/TradingView

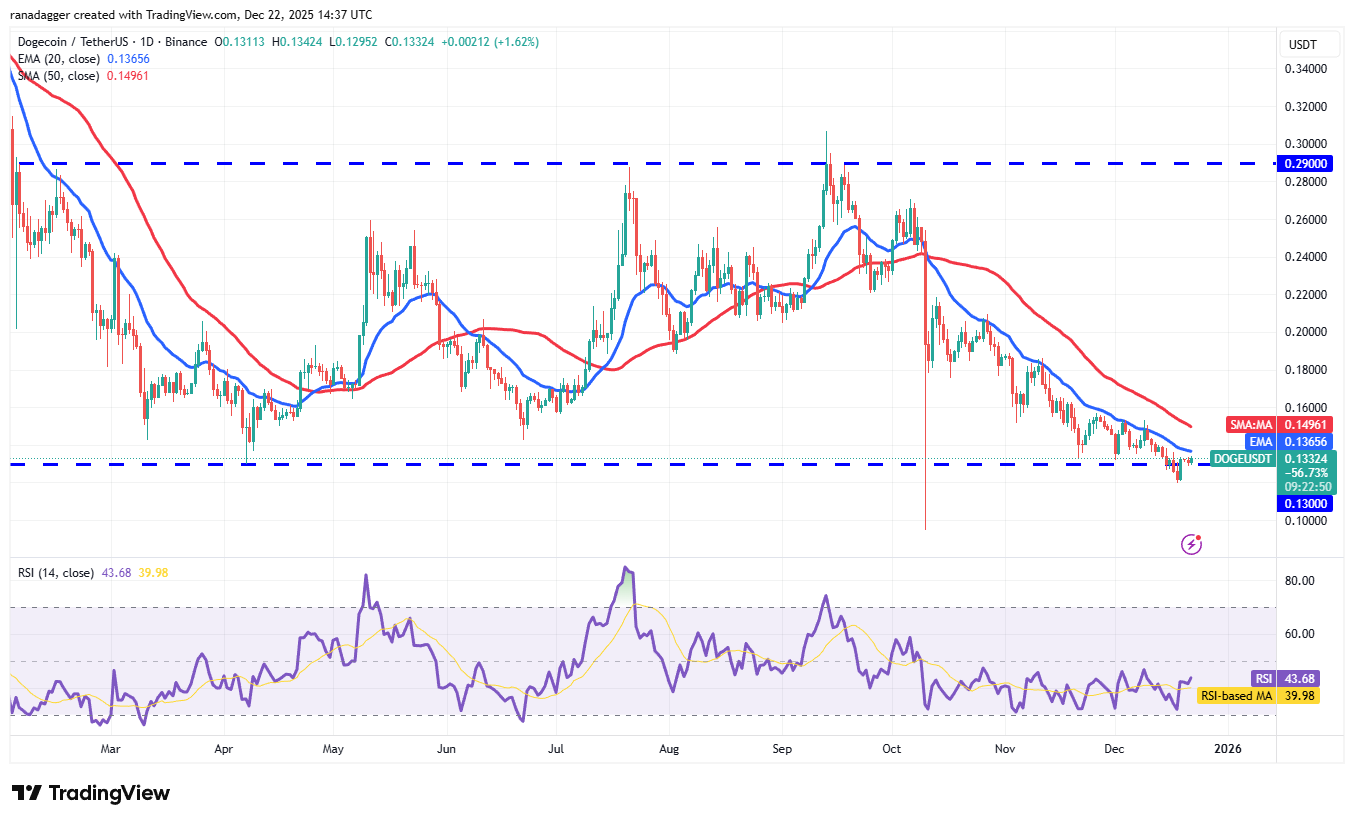
Sellers are unlikely to give up easily and will attempt to halt the recovery at the moving averages. If the Dogecoin price turns down from the moving averages and breaks below $0.12, it suggests that the bears remain in control. The DOGE/USDT pair may then plunge to the Oct. 10 low of $0.10.

Buyers will have to propel the price above the 50-day SMA ($0.15) to suggest that the markets have rejected the break below $0.13. The large range of $0.13 to $0.27 will come into play after the price maintains above $0.16.

Cardano price prediction

Cardano’s (ADA) recovery is facing resistance at the breakdown level of $0.37, indicating that the bears continue to exert pressure.

ADA/USDT daily chart. Source: Cointelegraph/TradingView

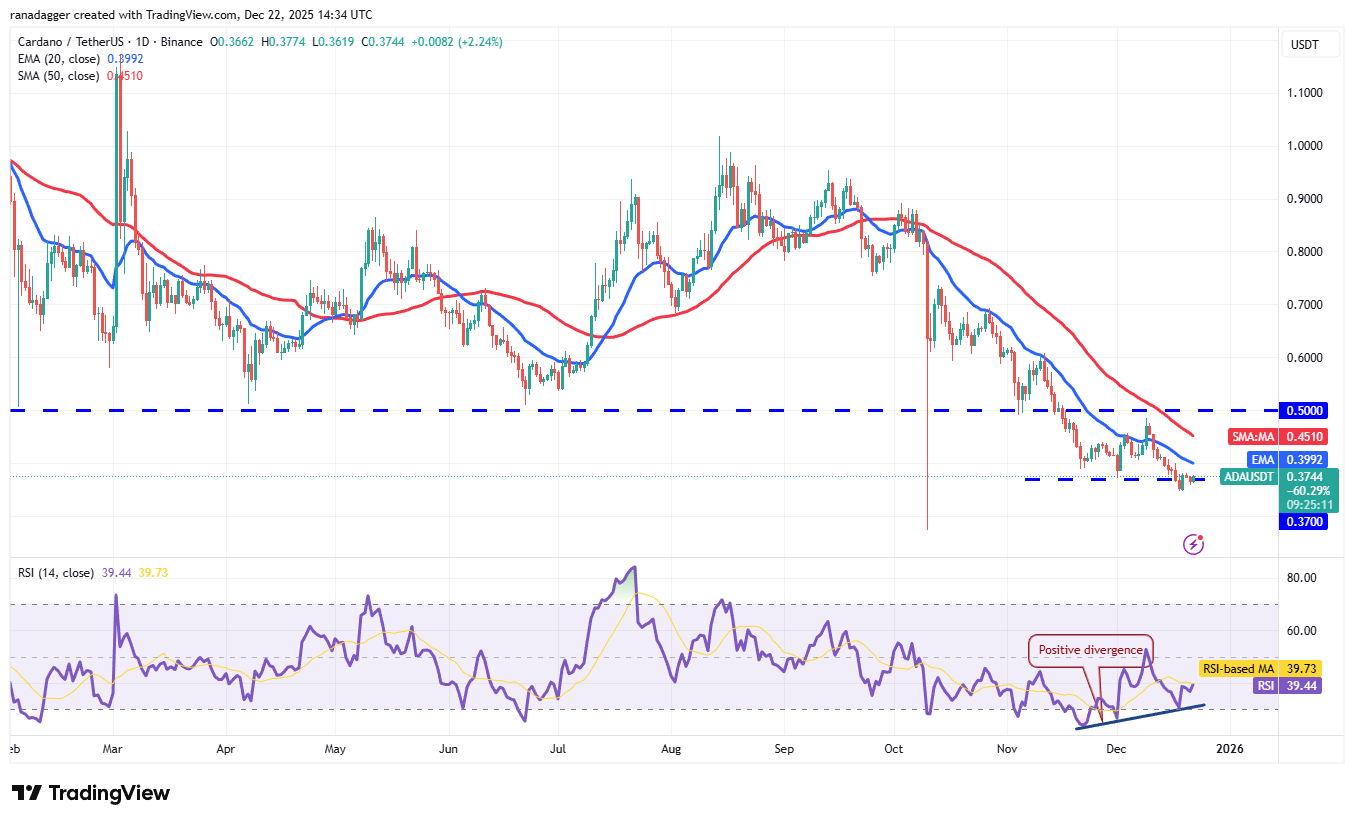
If the Cardano price turns down and breaks below $0.34, it signals that the bears have flipped the $0.37 level into resistance. The ADA/USDT pair may then extend the decline to the Oct. 10 low of $0.27.

A minor positive in favor of the bulls is that the RSI has formed a positive divergence. If buyers drive the price above the 20-day EMA ($0.40), the pair could rally toward the stiff overhead resistance at $0.50.

Bitcoin Cash price prediction

Bitcoin Cash (BCH) pierced the $615 resistance on Friday, but the bulls could not build upon the breakout.

BCH/USDT daily chart. Source: Cointelegraph/TradingView

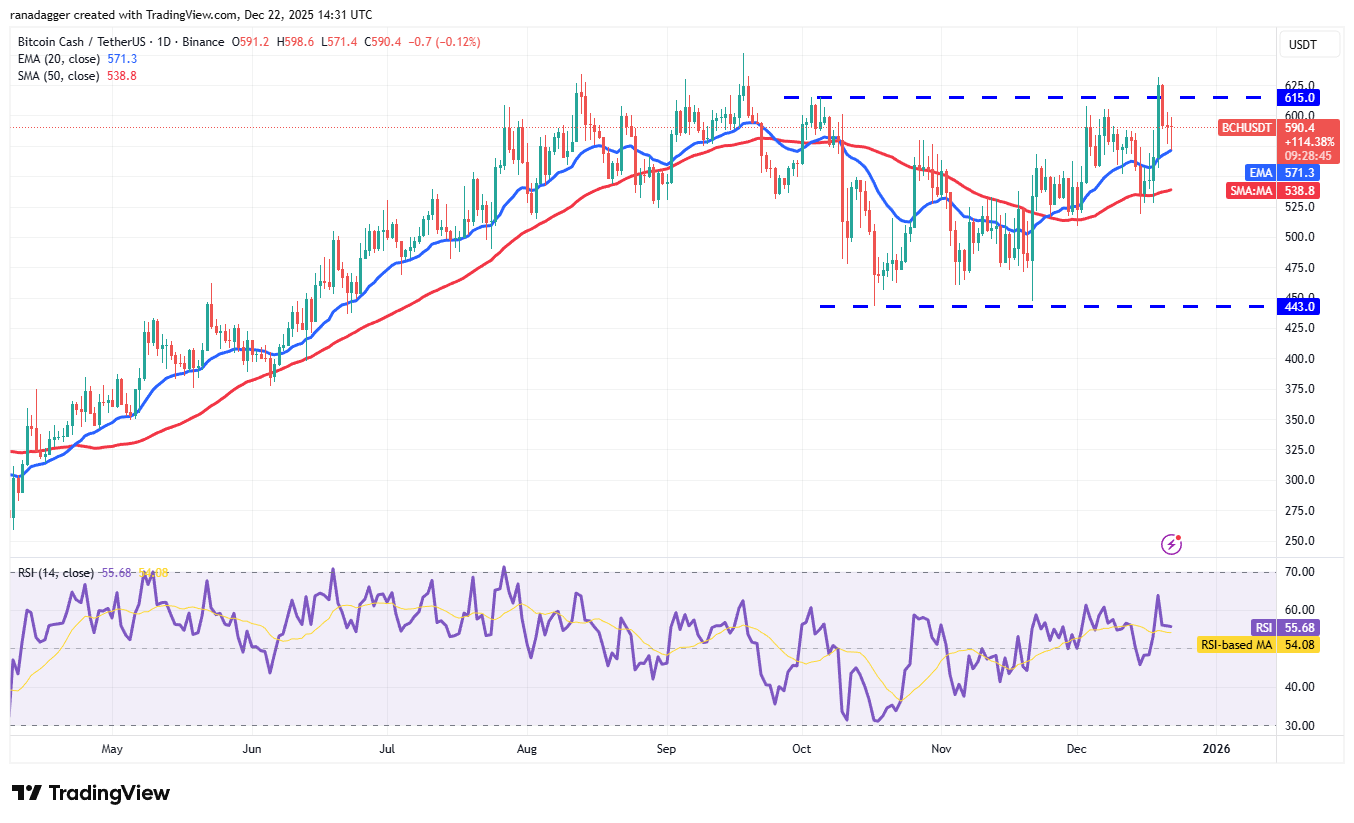
The bears pulled the Bitcoin Cash price to the 20-day EMA ($571), which is attracting buyers as seen from the long tail on the candlestick. If the rebound sustains, the bulls will again attempt to drive the BCH/USDT pair to $651 and then to $720.

Alternatively, if the price turns down from the overhead resistance and breaks below the 20-day EMA, it suggests that the traders are booking profits. The pair may then slump to the 50-day SMA ($538).

This article does not contain investment advice or recommendations. Every investment and trading move involves risk, and readers should conduct their own research when making a decision. While we strive to provide accurate and timely information, Cointelegraph does not guarantee the accuracy, completeness, or reliability of any information in this article. This article may contain forward-looking statements that are subject to risks and uncertainties. Cointelegraph will not be liable for any loss or damage arising from your reliance on this information.


Related Questions

QWhat is the current resistance level for Bitcoin (BTC) according to the article, and what could happen if it breaks above it?

AThe current resistance level for Bitcoin is $94,589. If it closes above this level, it suggests the corrective phase may be over, and the BTC/USDT pair could surge to $100,000 and later to $107,500.

QWhat pattern has Ether (ETH) formed, and what are the potential price targets if the pattern breaks to the upside?

AEther has formed a symmetrical triangle pattern. If the price breaks above the resistance line, it could surge to $4,000 and then to the pattern target of $4,386.

QAccording to Santiment founder Maksim Balashevich, what is a potential downside target for Bitcoin and why?

AMaksim Balashevich suggested Bitcoin could fall to $74,000 because there is still a lot of optimism online, and a drop to that level could provide 'a very good setup' for traders.

QWhat key level must Dogecoin (DOGE) break above to indicate that the markets have rejected the break below $0.13?

ADogecoin must break above the 50-day Simple Moving Average ($0.15) to suggest that the markets have rejected the break below $0.13.

QWhat is the significance of the $25 billion in year-to-date inflows into BlackRock's iShares Bitcoin Trust (IBIT) as mentioned by Bloomberg analyst Eric Balchunas?

AEric Balchunas highlighted that even with negative returns for the year, IBIT attracted $25 billion, suggesting significant long-term flow potential, especially in a good year.

Related Reads

Trading

Spot
Futures

Hot Articles

What is DOGE M

Doge Matrix ($doge m): The New Breed of Community-Driven Cryptocurrency Introduction In the ever-evolving landscape of cryptocurrency, new projects constantly emerge, each aiming to capture the interest of investors and enthusiasts alike. One of the latest entrants to this domain is Doge Matrix, represented by the ticker symbol $doge m. This project has attracted attention thanks to its roots in the popular meme culture surrounding Dogecoin, establishing its place within the web3 space. This article aims to provide a comprehensive analysis of Doge Matrix, covering its overview, creator, investors, functionality, timeline, and notable aspects. What is Doge Matrix ($doge m)? Doge Matrix is a community-driven cryptocurrency project that seemingly builds upon the widespread appeal of Dogecoin, a digital currency known for its Shiba Inu mascot and its meme origins. While the overarching objectives of Doge Matrix are not extensively defined, it is characterized by a commitment to harnessing community involvement and support. Unlike traditional cryptocurrencies that often emphasize utility or intrinsic value through underlying technologies, Doge Matrix positions itself within a space that embraces the cultural phenomenon of cryptocurrencies, particularly appealing to those who resonate with the ethos of meme-based assets. Drawing on the strengths of the Dogecoin community, Doge Matrix operates as part of a broader ecosystem, inviting participation and engagement from users who share an interest in cryptocurrency and the digital landscape. Who is the Creator of Doge Matrix ($doge m)? The identity of the creator of Doge Matrix remains unknown. This lack of transparency is not an uncommon occurrence in the cryptocurrency space, where some projects are launched without revealing the identities of their founders. The absence of information regarding the founding team can raise questions among potential investors about the project’s accountability and direction. Who are the Investors of Doge Matrix ($doge m)? As it stands, there is no publicly available information detailing the investors or investment foundations that back Doge Matrix. The project appears to rely primarily on community support rather than institutional investment. This model aligns with the community-driven nature of the initiative, fostering an environment where the direction of the project is shaped by its participants rather than being dictated by a select few financial backers. How Does Doge Matrix ($doge m) Work? The specifics regarding the operational mechanisms of Doge Matrix are somewhat vague, reflecting a broader trend of projects in the meme coin space where innovative functionalities are not always clearly articulated. Nonetheless, Doge Matrix seems designed to tap into the existing cryptocurrency ecosystem by encouraging user participation while tapping into the familiar cultural references associated with Dogecoin. Its potentially unique characteristics derive from community interactions rather than technological advancements, emphasizing shared experiences and collaboration among token holders. While the exact innovations have not been explicitly outlined, the project appears to create a space where community members can engage, share ideas, and propel the project's potential forward. Timeline of Doge Matrix ($doge m) Reflecting on the project’s timeline reveals notable events that have defined its journey thus far: November 25, 2024: Doge Matrix reached its all-time high value, marking a significant milestone in its early history. January 1, 2025: Conversely, Doge Matrix hit its all-time low value, illustrating the volatility often associated with cryptocurrencies, especially in the early stages of a project's lifecycle. Ongoing: The project continues to be actively traded and supported by its community, although specific future milestones or objectives have yet to be disclosed. Key Points About Doge Matrix ($doge m) Community Focus At the heart of Doge Matrix is a commitment to community engagement. The project thrives on the premise of collaboration and shared objectives among its members, emphasizing the importance of collective effort. Unlike centralized projects that often have a defined leadership structure, Doge Matrix at present showcases a more fluid approach to governance, where every community member's voice matters. Volatility The cryptocurrency market is notorious for its volatility, and Doge Matrix is no exception. Its price history reflects significant fluctuations between high and low values, which is typical of many new cryptocurrencies but underscores the risks associated with investment in emerging tokens. Lack of Detailed Information One of the most striking features about Doge Matrix is the scarcity of detailed information regarding its technological underpinnings and operational mechanisms. This ambiguity necessitates that potential investors conduct thorough due diligence before engaging with the project. Conclusion In summary, Doge Matrix ($doge m) illustrates a new wave of cryptocurrency projects that lean heavily on community engagement and cultural relevance. While lacking in certain specifics—such as clear leadership, defined objectives, and detailed functionality—the project has managed to generate interest within the crypto community, leveraging the established appeal of meme culture. As with any investment in the cryptocurrency space, understanding the inherent risks and conducting comprehensive research is essential for potential participants. Doge Matrix stands as a reminder of the dynamic, sometimes unpredictable nature of the crypto industry, marked by constant evolution and enthusiasm for community-driven initiatives.

3.2k Total ViewsPublished 2025.02.03Updated 2025.02.03

What is DOGE M

Discussions

Welcome to the HTX Community. Here, you can stay informed about the latest platform developments and gain access to professional market insights. Users' opinions on the price of DOGE (DOGE) are presented below.

活动图片