Keeta rallies 36% in a day – Should KTA holders take profits now?

ambcryptoPublished on 2026-04-01Last updated on 2026-04-01

Abstract

Keeta (KTA), an altcoin with a $109 million market cap, surged 36.7% in 24 hours, accompanied by a 400% increase in daily trading volume. This rally occurred amid broader market uncertainty, with Bitcoin facing rejection near $76k and retesting $66k as support. The 1-day chart showed KTA reclaiming the $0.20 resistance level, with the Chaikin Money Flow (CMF) indicating strong buying pressure and the RSI suggesting sustainable upward momentum. However, the 1-hour chart revealed a potential short-term pullback toward $0.176, supported by a bearish RSI divergence and a declining CMF. Traders are advised to consider taking profits, as the longer-term structure remains bearish, and further losses may follow.

The $109 million market cap altcoin Keeta [KTA] experienced a 36.7% rally in the past 24 hours, at press time. CoinMarketCap data showed that it had a 400% surge in daily trading volume as traders and investors raced to capture some gains the altcoin was posting.

These gains came at a time of wider market uncertainty and drawdown. Bitcoin [BTC] faced rejection from the $76k level in the past two weeks and retested the $66k level as support on Tuesday, the 31st of March.

Can KTA keep its rally going, or is this rally one for holders to sell?

Right time to take profits?
Source: KTA/USDT on TradingView

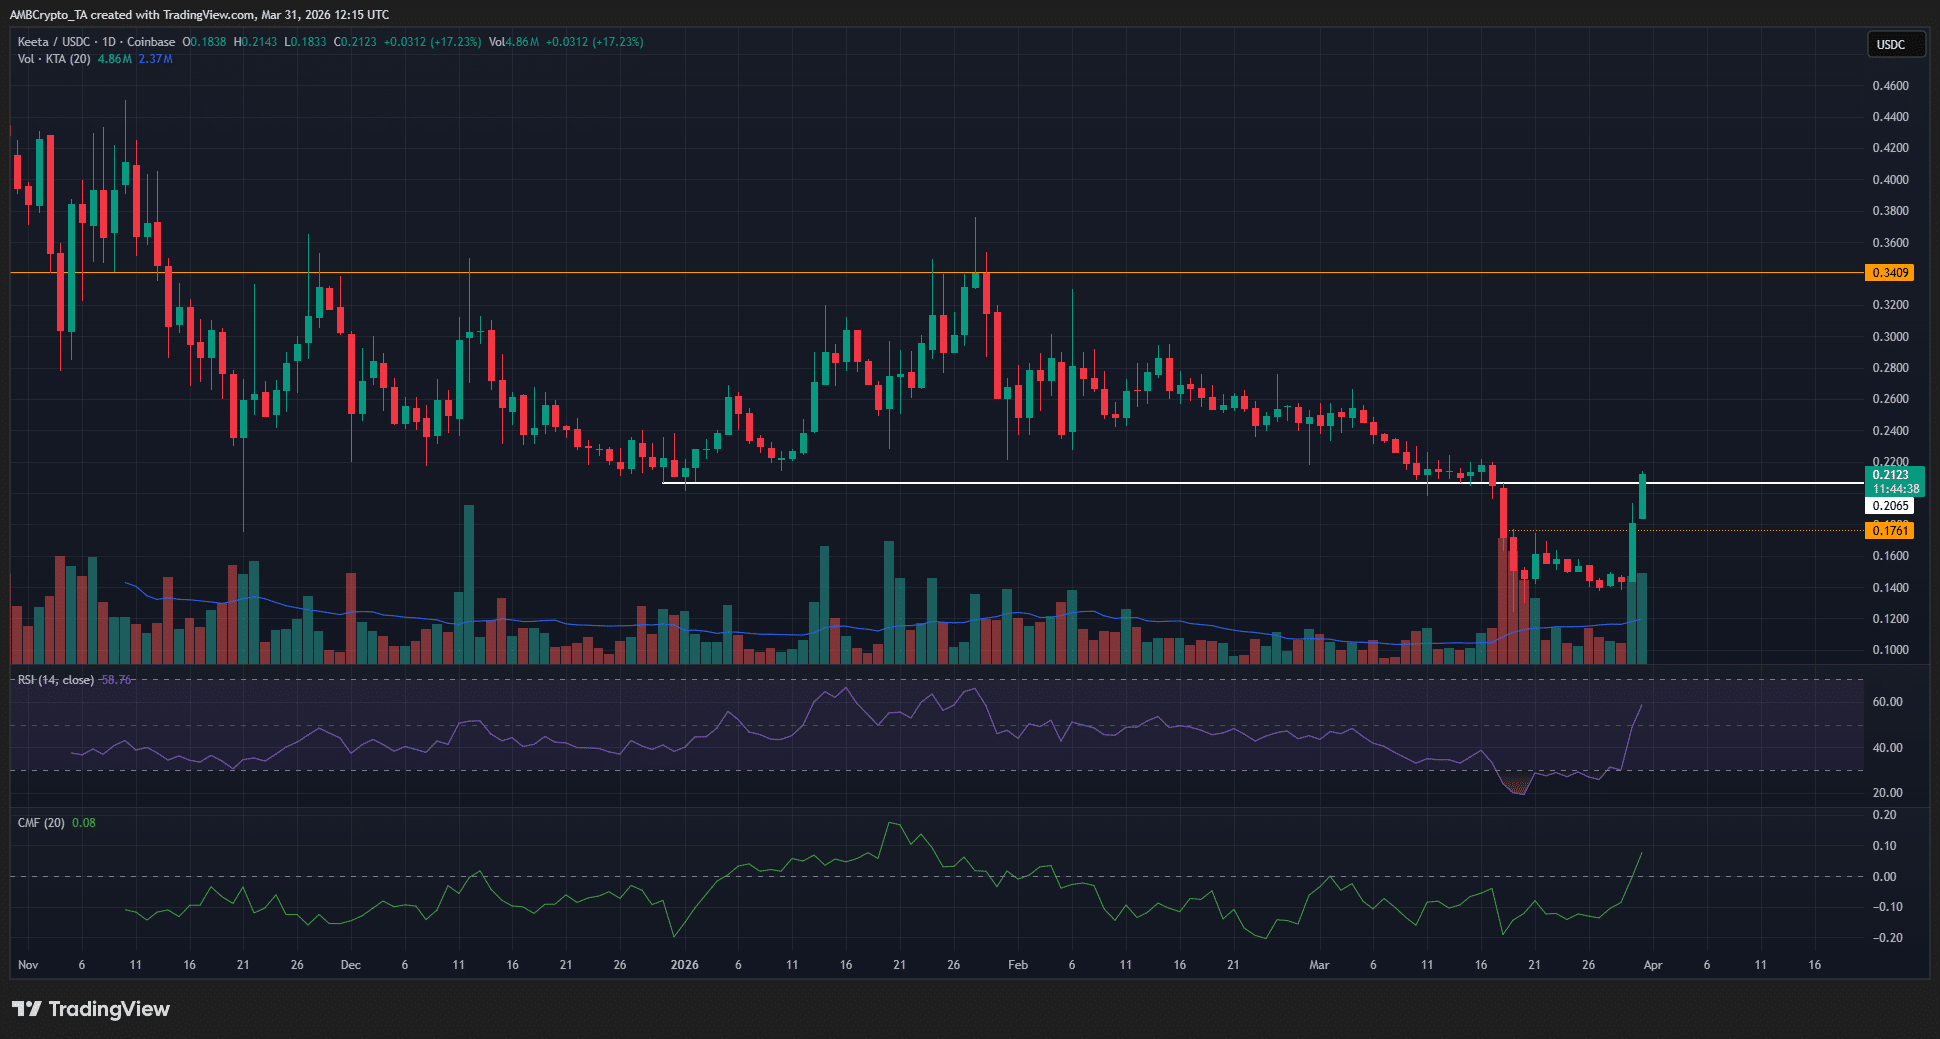
The 1-day chart of the altcoin showed the breakdown below the $0.2 support zone in mid-March. The trading volume on Wednesday, the 18th of March, was the highest single-day volume since Friday, the 12th of December 2025.

The high-volume breakdown below a support level that has held throughout 2026 was significant.

Yet, at the time of writing, KTA was poking its head back above the same resistance zone, which coincides with a psychological round number resistance.

The CMF climbed to +0.08 to indicate heavy buying pressure and sizeable capital inflows. It must be noted that the daily CMF has been negative since the market crash in the first week of February.

Meanwhile, the daily RSI has also recovered to push past neutral 50. This indicated sustainable upward momentum.

Traders’ call to action: Sell!
Source: KTA/USDT on TradingView

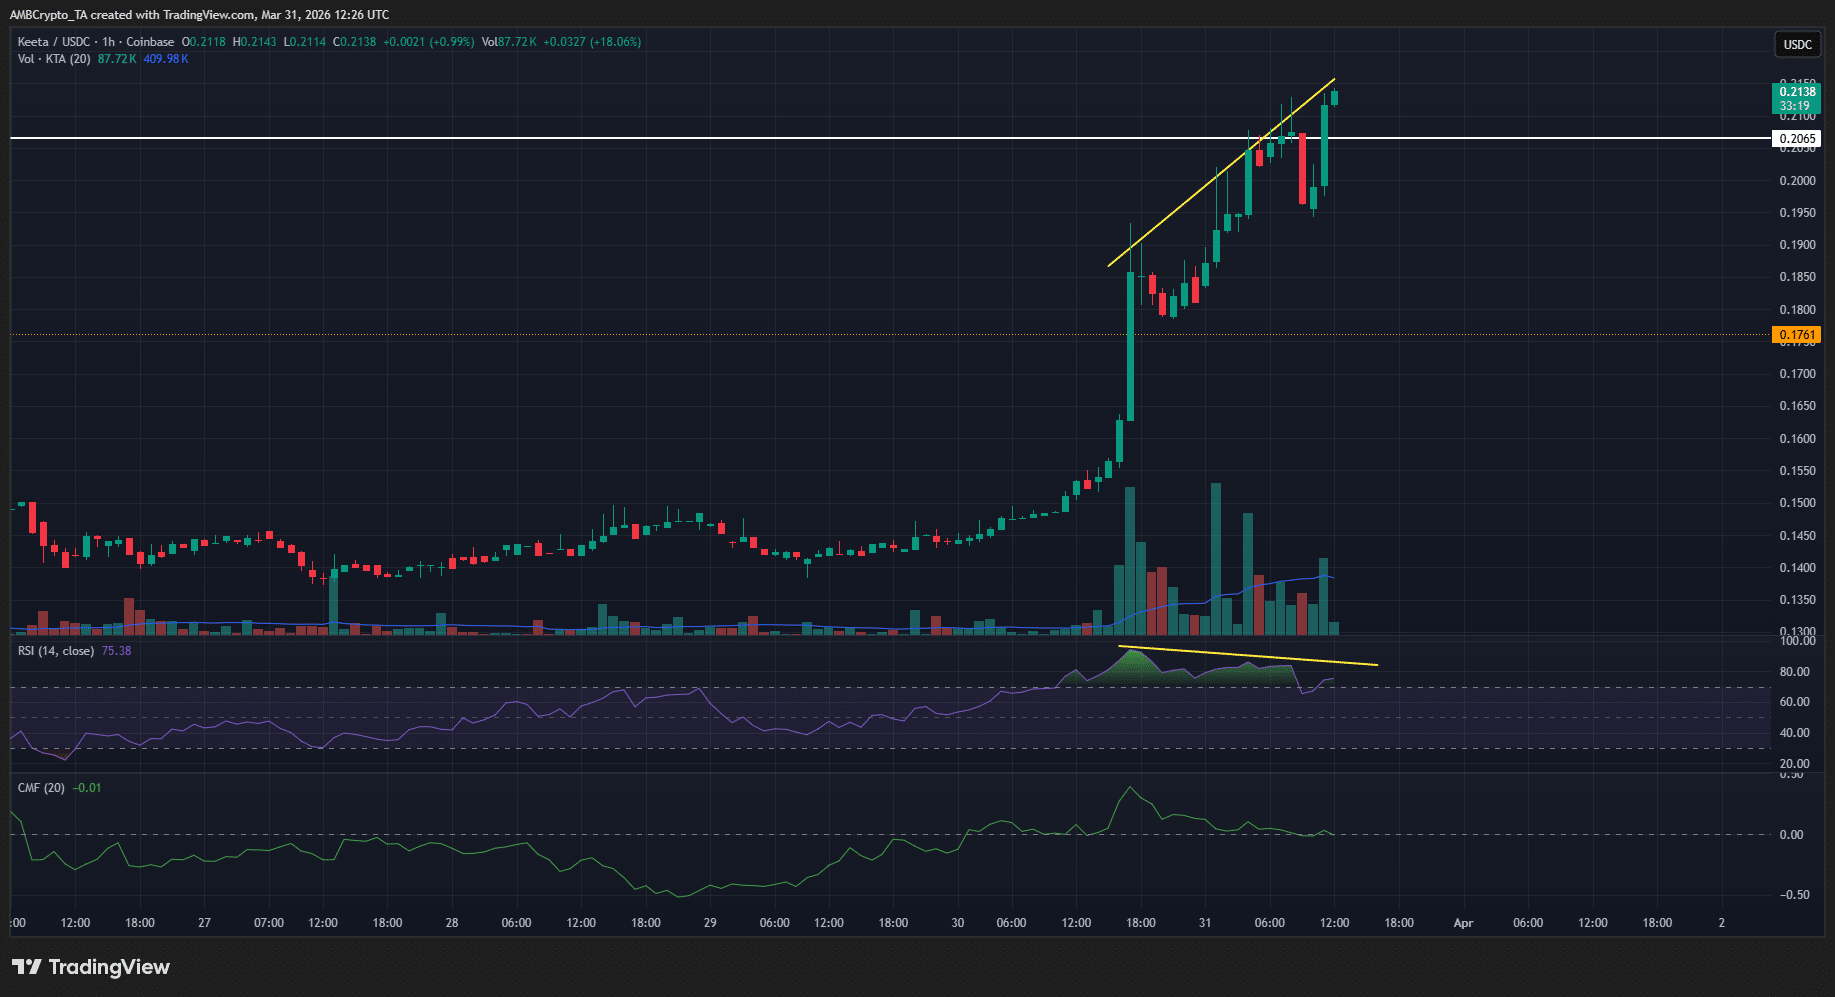
The 1-hour chart showed bullish volume and momentum indicators, but the run could be ending. While the 1-day chart stressed a bearish long-term structure, the 1-hour chart hinted at a pullback toward the $0.176 level, a support from earlier in March.

The CMF was back below +0.05 and, more importantly, the RSI was making a bearish divergence.

This was a clear sign that short-term holders should consider taking profits. As things stand, the longer-term bias means that they should be wary of buying a pullback and expect further losses instead.


Final Summary

  • Keeta saw a 36% rally in the past 24 hours and was back above a support level it lost to the bulls in mid-March.
  • The lower timeframe price chart showed that a pullback is likely, and there was a clear momentum divergence in progress.


Related Questions

QWhat was the percentage increase in Keeta's value in the past 24 hours?

AKeeta experienced a 36.7% rally in the past 24 hours.

QAccording to the article, what is a clear sign that short-term holders should consider taking profits?

AA clear sign is the bearish divergence on the RSI (Relative Strength Index) on the 1-hour chart.

QWhat key support level did KTA break down below in mid-March?

AKTA broke down below the $0.2 support zone in mid-March.

QWhat did the Chaikin Money Flow (CMF) indicator climbing to +0.08 signify?

AThe CMF climbing to +0.08 indicated heavy buying pressure and sizeable capital inflows into KTA.

QDespite the recent rally, what is the longer-term bias for KTA according to the analysis?

AThe longer-term bias is bearish, and the analysis suggests traders should be wary of buying a pullback and expect further losses instead.

Related Reads

Bitcoin Boom in Full Swing: Saylor's Latest Statement Fuels Buying Speculation

MicroStrategy's Executive Chairman Michael Saylor has fueled speculation about a new Bitcoin purchase by posting "Bitcoin Drive engaged" on August 2, accompanied by the company's customary purchase tracker. This aligns with his pattern of hinting at treasury changes ahead of weekly reports. The accompanying report showed MicroStrategy's Bitcoin holdings at 843,775 BTC, with an average cost of $75,653 per coin and an unrealized loss of -$10.58B. A similar signal preceded the company's July 27 announcement, strengthening expectations for a treasury update on Monday. However, MicroStrategy's real-time ledger reflects two recent Bitcoin sales totaling 3,588 BTC, reducing holdings from 847,363 BTC to the current 843,775 BTC. The company stated these sales funded preferred stock dividends and replenished its U.S. dollar reserve. Recent reports indicate the company made no Bitcoin purchases the week ending July 26 while increasing its dollar reserve to approximately $3.75B. The company faces financial headwinds after reporting an $8.33B operating loss for Q2 2026, including an $8.32B unrealized loss on its digital assets. Management may sell up to $1.25B more in Bitcoin to meet cash obligations. The expected Monday update will reveal if the "Bitcoin Drive" signal marks a return to accumulation as MicroStrategy balances its massive Bitcoin stash against growing cash commitments.

cryptonews.ru1h ago

Bitcoin Boom in Full Swing: Saylor's Latest Statement Fuels Buying Speculation

cryptonews.ru1h ago

Trading

Spot
活动图片