How to Use Premium Rate to See Through ETF Fund Flows 24 Hours in Advance?

比推Published on 2026-01-30Last updated on 2026-01-30

Abstract

This article explains how to use the ETF premium/discount rate as a leading indicator to predict fund flows into and out of Bitcoin and Ethereum ETFs up to 24 hours before official data is released. The premium rate reflects the difference between an ETF's market price and the net asset value (NAV) of its underlying assets. A positive premium indicates bullish sentiment and high demand, often leading to net inflows as authorized participants (APs) create new shares to arbitrage the price difference. Conversely, a negative premium (discount) signals bearish sentiment and selling pressure, typically resulting in net outflows as APs redeem shares. Historical data from 2025-2026 shows a strong correlation: a positive premium predicted net inflows with 84% accuracy, while a negative premium predicted net outflows with 81% accuracy. Key practical applications include: - Monitoring the persistence of premiums/discounts over multiple days, not just single readings. - Watching for extreme values beyond ±0.5%, which indicate strong sentiment shifts. - Combining the indicator with price action (e.g., sustained discounts at market tops can signal early distribution). The article cautions that this is not a standalone tool. For higher conviction, it should be combined with other metrics like changes in ETF holdings, futures basis and funding rates, options put/call ratios, and on-chain exchange flows to confirm trends and potential turning points.

Author: Umbrella, Deep Tide TechFlow

Original Title: Understanding Premium Rate Lets You Be 24 Hours Faster Than ETF Data


Since the approval of BTC and ETH spot ETFs, daily ETF fund inflows and outflows have become a core indicator for many traders' market analysis.

The logic is simple: net inflows indicate institutional buying and bullish sentiment; net outflows indicate institutional selling and bearish sentiment.

However, the problem is that the ETF data we see daily is always from the previous day.

By the time the data is released, the price has often already reflected it.

So, is there any way to predict whether today's ETF will have net inflows or net outflows in advance?

Yes, the answer is the ETF premium rate.

It's not difficult to verify this pattern; looking back at the recently concluded January 2026 is the best sample.

As of January 28, there were 18 trading days in the U.S. stock market.

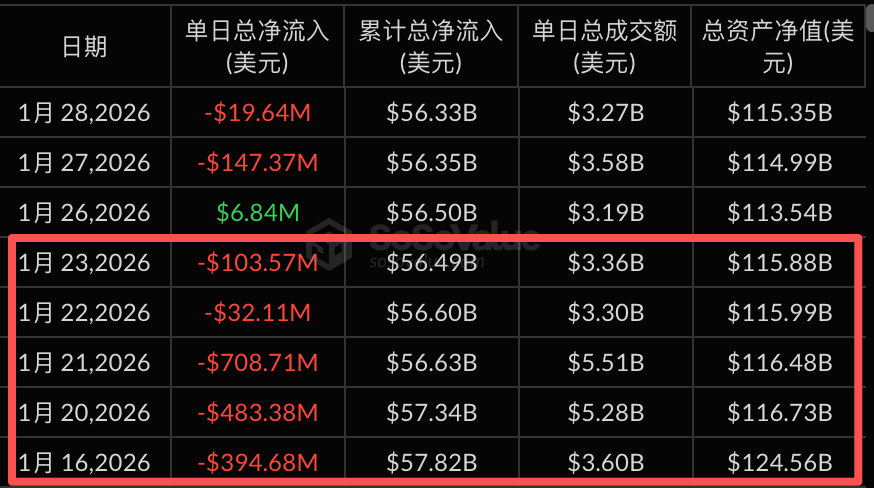
Statistics show that the premium index on Coinbase remained in positive territory for only two days, while the other 16 days were all in negative premium territory.

Corresponding ETF fund flows show that 11 of these 16 days ultimately recorded net outflows.

Particularly from January 16 to 23, the negative premium rate continuously fell below -0.15%, corresponding to a weekly net outflow of over $1.3 billion from the ETF market, with BTC's price dropping from a high of $97,000 to around $88,000.
Data source: sosovalue

Let's take a broader view.

From July 1, 2025, to January 28, 2026, there were a total of 146 trading days.

· Negative premium rate occurred for 48 days, corresponding to net outflows for 39 days, with an accuracy rate of 81%.

· Positive premium rate occurred for 98 days, corresponding to net inflows for 82 days, with an accuracy rate of 84%.

This is the value of the premium rate—it allows you to see where the funds are flowing earlier than most.

What Is Premium Rate?

We've been talking about the premium rate, but what exactly is it?

Here's an analogy.

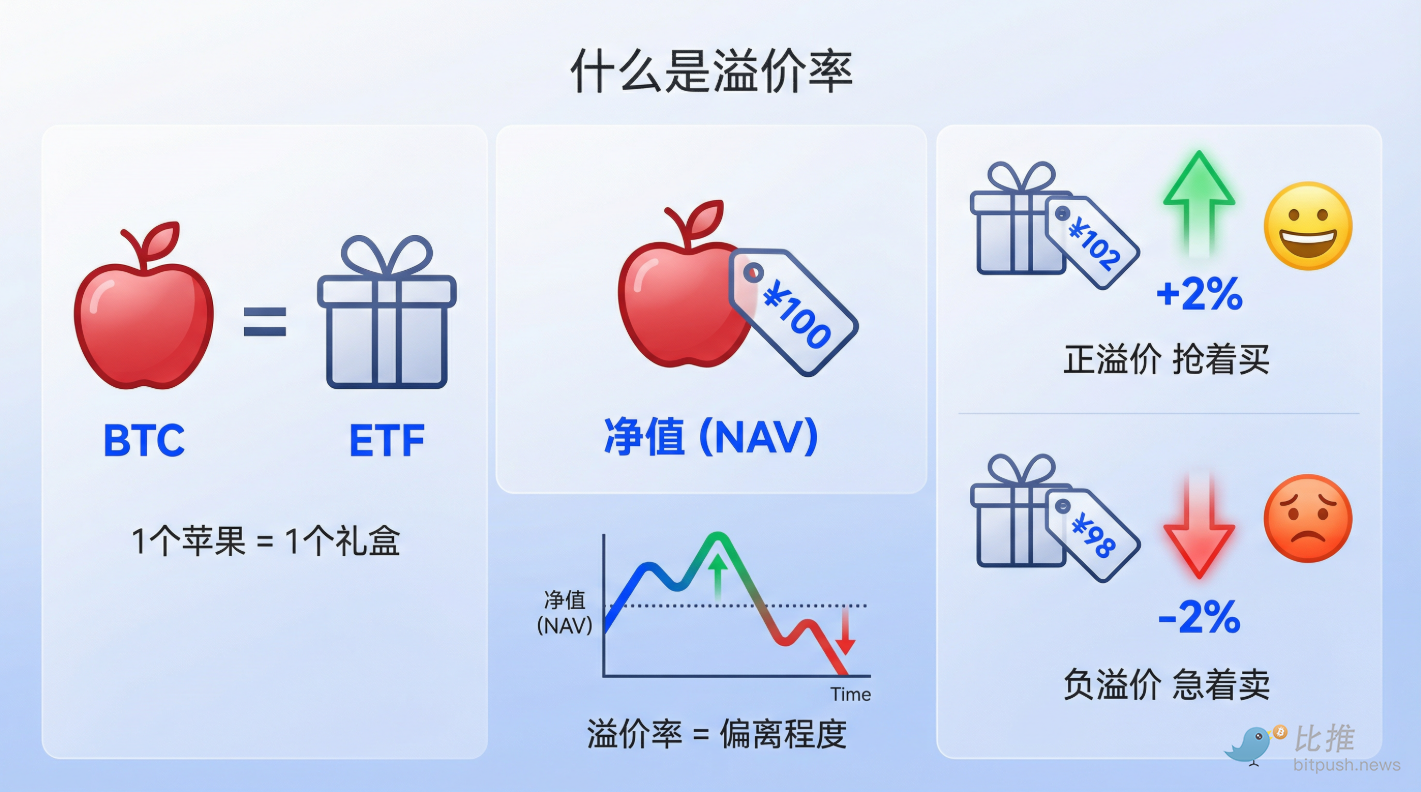
BTC is like loose apples in a grocery market, while BTC spot ETFs are like packaged apple gift boxes in a supermarket, each containing one apple.

An apple sells for $100 in the grocery market—this is the net asset value (NAV).

How much the apple gift box sells for in the supermarket depends on supply and demand.

If many people buy it, the box is bid up to $102—this is a positive premium rate, with a premium of +2%.

If many people sell it, the box drops to $98—this is a negative premium rate, with a premium of -2%.

The premium rate reflects the degree to which the ETF market price deviates from the real price of BTC.

A positive premium indicates optimistic market sentiment, with everyone rushing to buy.

A negative premium indicates pessimistic market sentiment, with everyone rushing to sell.
The Relationship Between Premium Rate and ETF Inflows/Outflows

The premium rate is not just a market sentiment indicator; it also becomes a key driver of fund flows.

The key players here are APs, or Authorized Participants, whom you can think of as privileged arbitrageurs.

The core logic for APs is risk-free arbitrage: they can subscribe to and redeem ETF shares in the primary market and also buy and sell in the secondary market.

As long as there is a price difference, they will arbitrage.

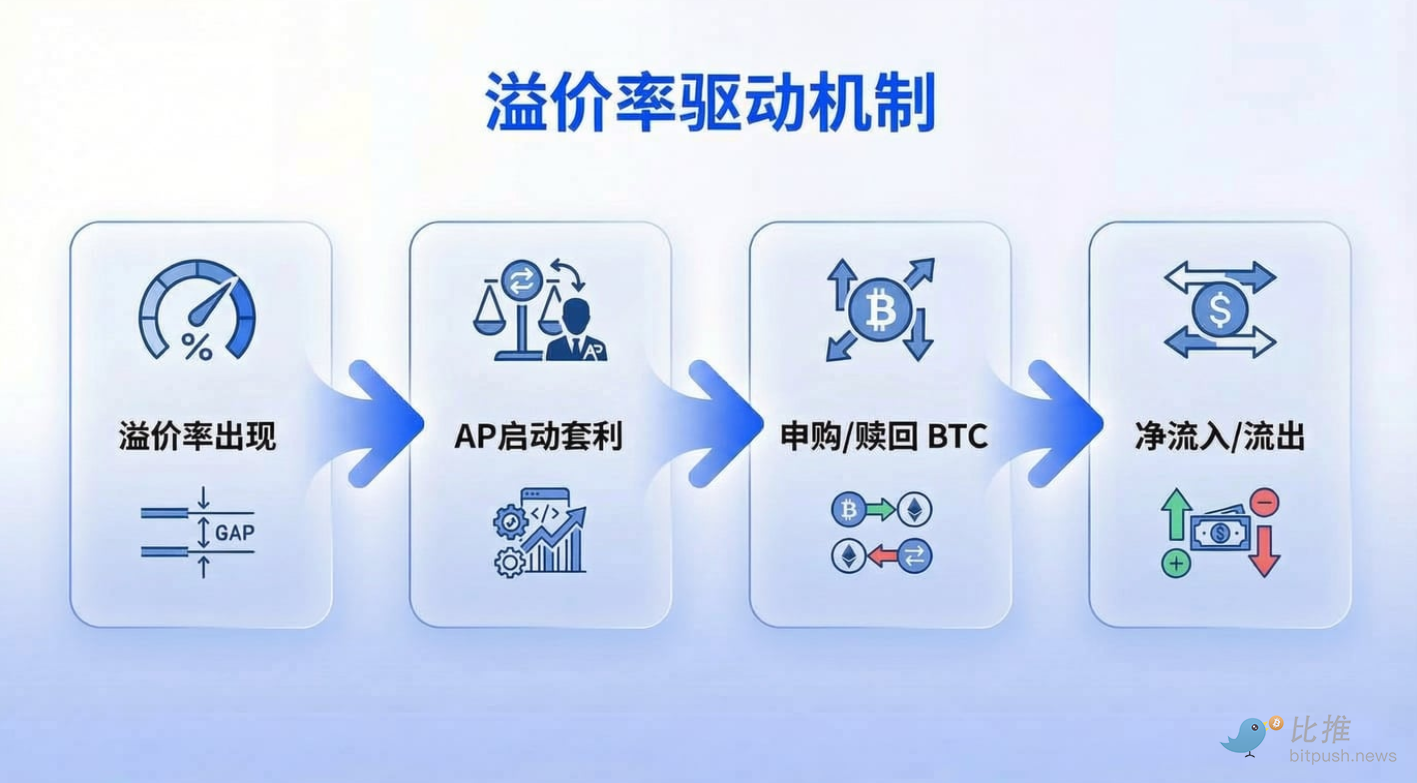
When a positive premium rate appears, the gift box is more expensive than the apple. APs will go to the primary market to buy BTC, package it into ETF shares, and then sell it in the secondary market to profit from the difference. In this process, BTC is bought, resulting in net inflows.

Conversely, when a negative premium rate appears, the gift box is cheaper than the apple. APs will buy ETFs in the secondary market, unbundle them to redeem BTC, and then sell the BTC to profit from the difference. In this process, BTC is sold, resulting in net outflows.

So the logical chain is as follows:

Premium rate appears → APs initiate arbitrage → Subscription or redemption occurs → Net inflows or outflows are generated.
And the ETF fund data we see daily is published the next day after settlement.

The premium rate is real-time; the fund data is lagging.

This is why the premium rate can give you an edge over the market.

How to Apply the Premium Rate

Now that we understand the principle of the premium rate and its relationship with ETF net inflows and outflows, how can we apply it to our trading plans?

First, the premium rate is not an indicator to be used in isolation.

It can tell us the direction of funds but not the magnitude or sustainability.

Here, I suggest combining it with the following dimensions.

1. The Sustainability of the Premium Rate Is More Important Than a Single-Day Value

A single day of negative premium rate may just be short-term volatility.

However, if negative premium rates occur for multiple consecutive days, it is highly likely to correspond to continuous net outflows, which is worth noting.

Looking back at the five consecutive trading days of negative premium rates from January 16 to 23 this year, they corresponded to five days of net outflows, with BTC falling nearly 10%.

2. Pay Attention to Extreme Values of the Premium Rate

Generally, premium rates fluctuate within ±0.5% as the norm.

Once it breaks through ±1%, it indicates a significant deviation in market sentiment, and AP arbitrage activity intensifies, accelerating fund flows.

3. Combine with Price Levels for Judgment

Sustained negative premium rates at high prices may be an early signal of capital flight.

Sustained positive premium rates at low prices may indicate bottom-fishing capital entering the market.

The premium rate itself does not constitute a basis for buying or selling, but it can help you confirm the current trend or detect turning points in advance.

Final Thoughts

Finally, a few reminders are necessary.

No indicator is a holy grail; the effectiveness of the premium rate is based on the normal operation of the AP arbitrage mechanism.

In extreme market conditions, such as the 10.11 crash, where market liquidity dries up, the arbitrage mechanism may fail, and the correlation between the premium rate and fund flows may decrease.

Additionally, the premium rate is just one window into observing ETF fund movements.

For mature investors, the premium rate is just one piece of the puzzle.

It is recommended to combine it with the following indicators for multi-dimensional cross-verification:

  1. ETF Holdings Changes: An increase in holdings indicates institutions are accumulating positions; a decrease indicates they are reducing positions. More direct than the premium rate, but data updates are delayed.

  2. Futures Basis and Funding Rate: A positive basis and continuously rising funding rate indicate overheated bullish sentiment and excessive market optimism. The opposite indicates bearish dominance.

  3. Put/Call Ratio in the Options Market: Puts are put options; Calls are call options. A rising ratio indicates increased market risk aversion; a falling ratio indicates dominant optimism.

  4. On-Chain Large Transfers and Exchange Net Inflows: Large BTC transfers into exchanges usually signal impending selling pressure. Large transfers out of exchanges indicate accumulation.

For example.

When you observe: a continuous negative premium rate, declining ETF holdings, and rising exchange net inflows.

Three signals point in the same direction: funds are withdrawing, and selling pressure is accumulating.

At this point, you should at least be alert and control your positions rather than buying the dip.

A single indicator cannot reveal the full picture; multi-dimensional cross-verification is needed to improve judgment accuracy.

In this market, the more dimensions you observe, the smaller the information gap, but the time gap will always exist.

Whoever sees the direction of funds first gains an extra edge.


Twitter:https://twitter.com/BitpushNewsCN

BitPush TG Discussion Group:https://t.me/BitPushCommunity

BitPush TG Subscription: https://t.me/bitpush

Original link:https://www.bitpush.news/articles/7607387

Related Questions

QWhat is the ETF premium rate and how can it be used to predict fund flows 24 hours in advance?

AThe ETF premium rate is the percentage difference between the market price of an ETF share and its net asset value (NAV). A positive premium rate indicates market optimism and potential net inflows, while a negative rate suggests pessimism and potential net outflows. By monitoring real-time premium rates, traders can anticipate the next day's official ETF flow data, as the rate reflects immediate market sentiment and authorized participants' (APs) arbitrage activities that drive fund flows.

QHow do authorized participants (APs) use the premium rate for arbitrage, and how does this affect ETF fund flows?

AAuthorized participants (APs) engage in arbitrage based on the ETF premium rate. When there is a positive premium (ETF price > NAV), APs buy the underlying assets (e.g., BTC), create ETF shares, and sell them on the secondary market for a profit, leading to net inflows. Conversely, during a negative premium (ETF price

QWhat was the accuracy of the premium rate in predicting ETF fund flows from July 1, 2025, to January 28, 2026, according to the article?

AFrom July 1, 2025, to January 28, 2026, covering 146 trading days, the premium rate had an 81% accuracy for predicting net outflows during negative premium days (48 days, with 39 days of net outflows) and an 84% accuracy for predicting net inflows during positive premium days (98 days, with 82 days of net inflows).

QWhat additional indicators does the article recommend combining with the premium rate for better validation of market trends?

AThe article recommends combining the premium rate with: 1) ETF holdings changes (indirect but delayed data), 2) futures basis and funding rates (indicate market sentiment), 3) Put/Call ratios in options markets (reflect risk sentiment), and 4) on-chain large transfers and exchange net flows (show accumulation or selling pressure). Multi-dimensional cross-verification improves judgment accuracy.

QWhy might the premium rate's effectiveness decrease in extreme market conditions, such as during a crash?

AIn extreme market conditions, like a severe crash (e.g., the referenced 10.11 crash), market liquidity can dry up, causing the arbitrage mechanism for authorized participants (APs) to fail. When APs cannot efficiently execute arbitrage due to illiquidity or high volatility, the correlation between the premium rate and ETF fund flows weakens, reducing the indicator's reliability.

Related Reads

The Verdict in Choi Tae-won's Divorce Case: Revealing the Inheritance Undercurrent Behind SK Hynix's Trillion-Won Empire

SK Group Chairman Chey Tae-won's high-profile divorce case, involving a record 1.38 trillion won settlement, has drawn attention to the succession plans for Korea's second-largest conglomerate, especially its crown jewel, SK hynix. Unlike traditional chaebol scripts centered on the eldest son, Chey's three children from his marriage to former President Roh Tae-woo's daughter, Roh Soh-yeong, are carving distinct, non-traditional paths. Eldest daughter Chey Yun-jung (b. 1989) is seen as the most evident successor. With a scientific and consulting background, she holds executive roles at SK bioscience and SK Inc.'s growth support department, focusing on future strategy and biopharma. Her marriage is to an AI infrastructure entrepreneur, not a traditional business alliance. Second daughter Chey Min-jung (b. 1991) took a unique route, voluntarily serving as a South Korean naval officer, including an anti-piracy deployment. She later worked on policy and strategy for SK hynix in Washington D.C. before co-founding an AI-driven healthcare startup. She married a former U.S. Marine Corps officer, connecting her to U.S. defense and policy circles—networks crucial for a global semiconductor giant. The only son, Chey In-geun (b. 1995), who studied physics like his father, worked briefly at SK E&S before joining McKinsey. Despite fitting the traditional "heir" profile as the eldest son, he remains silent and holds no public position or shares in SK, suggesting the old succession playbook is obsolete. As SK hynix's valuation soars, becoming a geopolitical asset in the AI era, the heirs' legitimacy is no longer automatic. They must prove themselves in fields like AI biotech, global policy, and strategic consulting. Their marriages also reflect new elite networks in tech and defense, not old political alliances. Their inheritance is the complex challenge of navigating a globalized, tech-driven world, not just a corporate throne.

marsbit5h ago

The Verdict in Choi Tae-won's Divorce Case: Revealing the Inheritance Undercurrent Behind SK Hynix's Trillion-Won Empire

marsbit5h ago

From OpenSea to OpenRouter: Is Alex Atallah Repeating His 'Exit at the Peak' Playbook?

From OpenSea to OpenRouter: Is Alex Atallah Repeating His "Exit at the Peak" Playbook? According to the Wall Street Journal, payments giant Stripe is in talks to acquire the AI model aggregation platform OpenRouter in a potential deal valuing the company near $100 billion. This would mark founder Alex Atallah's second creation of a company reaching a $100 billion valuation, following his co-founding of NFT marketplace OpenSea. OpenRouter, founded just over three years ago, has grown rapidly by acting as a unified gateway for developers to access over 400 AI models. It currently has about 10 million users and processes over 200 trillion tokens monthly. While the platform's annualized revenue is around $50 million, its valuation has skyrocketed from $1.3 billion in March 2026. The potential acquisition by Stripe, a company OpenRouter's founder once likened it to, represents a major expansion into AI infrastructure for the payments leader. This move echoes Atallah's previous timing with OpenSea, where he departed before the NFT market's significant downturn. For OpenRouter, selling now may be strategic. Despite its scale, its business model—charging a 5-5.5% fee on AI inference calls—faces pressure from competition, open-source models, and potential price wars among model providers, limiting its profitability narrative for an IPO. A key asset for potential acquirers like Stripe is OpenRouter's vast repository of real-world AI usage data, which offers unique insights into model performance and developer preferences that are difficult to replicate. Whether this potential deal signifies a new valuation benchmark for AI infrastructure or another market peak signal remains to be seen.

链捕手5h ago

From OpenSea to OpenRouter: Is Alex Atallah Repeating His 'Exit at the Peak' Playbook?

链捕手5h ago

Trading

Spot
活动图片