Author: Four Pillars
Compiled by: AididaoJP, Foresight News
Key Points
- Tokens ≠ Equity. Use Enterprise Value / Holder Revenue for valuation, not Enterprise Value / Protocol Revenue.
- The Accrual Ratio (the proportion of protocol revenue that holders ultimately receive) is a key diagnostic metric. Among the projects we compared, this ratio ranged from 25% to 100%.
- "Dilution" also varies. Team incentives are a real operating cost (should be included in valuation multiples), while investor unlock sell-offs are market events (should not be included in multiples).
- Treasury value depends on "extractability." The question isn't "how much money is in the treasury," but "can holders get it out?"
I often see a common mistake in cryptocurrency valuation: someone pulls up a protocol with $500 million in annualized fee revenue, divides the market cap by that number, gets a single-digit multiple, and concludes it's "cheap." This calculation is wrong for both the denominator and the numerator. Investors think they are buying at a 5x multiple, but considering the revenue they actually get, the multiple might be 20x.
The P/E ratio is a good starting point, but it ignores the balance sheet and capital structure—this is why Enterprise Value multiples (EV/EBITDA) are used in traditional finance. However, applying the EV/EBITDA concept to tokens encounters three fundamental problems:
- Treasury Assets: Holders have no legal claim.
- Protocol Revenue: Most of it may never reach holders.
- Major Costs: Not on the income statement, but manifested as new token issuance.
This article aims to build a valuation framework adapted to the characteristics of tokens. The core metric is Enterprise Value / Holder Revenue—the price you pay for every dollar of revenue that ultimately ends up in your pocket (as a token holder), while also considering the impact of the balance sheet and actual business costs. I will use five protocols (HYPE, PUMP, MAPLE, JUP, SKY) as examples for illustration. This is not investment advice, just a demonstration of the method.
1. How to Calculate the "Enterprise Value" of a Token?
The first mistake in many token valuations is the starting point—using market cap directly, but market cap is not equal to enterprise value.
In traditional finance, the logic is clear:
Enterprise Value = Market Cap + Debt - Cash
Because if you buy the entire company, you assume its debt and also get its cash. Subtracting cash makes sense because that money is legally yours.
But in the crypto world, things are more complicated. From automatic burns (USDC flows in, tokens are permanently destroyed, no one gets that USDC) to foundation wallets (sitting on hundreds of millions of dollars, but with no governance rights or distribution mechanism), situations vary. The key question is not "what's in the treasury," but "can holders get it out?" (Of course, if someone acquires the entire protocol, the discount disappears, just like in traditional finance. The "claim discount" discussed here mainly applies to us minority equity holders.)
I continue to use the term "Enterprise Value" because the logic is similar: you are calculating how much you need to pay to acquire the core business, while excluding parts of the balance sheet that don't belong to you. The formula is as follows:
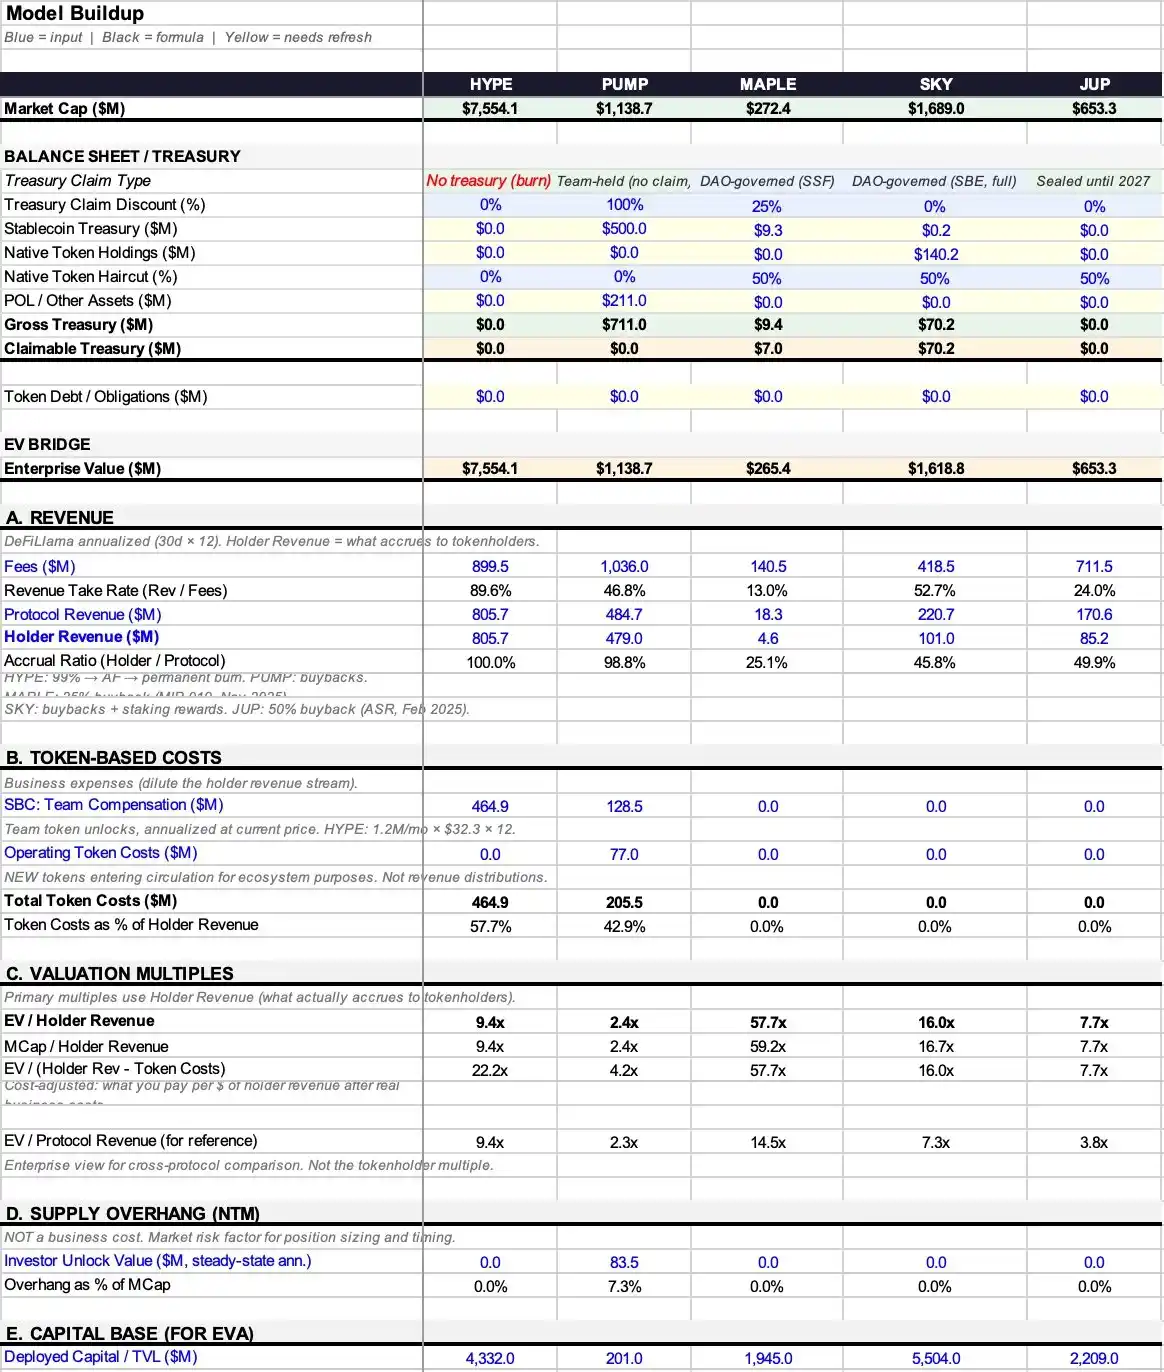
Token Enterprise Value = Market Cap + Token Debt - Extractable Treasury Assets
Currently, most protocols do not have "token debt," so the focus is usually on the treasury assets.
First, break down what's in the treasury. A protocol's treasury typically holds three types of assets:
- Stablecoins: Real cash,原则上 fully extractable.
- Native Tokens: Its own tokens. Subtracting this is like "subtracting itself," usually requiring a discount of at least 50%.
- Protocol-Owned Liquidity (POL) and other assets.
Total Treasury Assets = Stablecoins + Native Tokens × (1 - Appropriate Discount Rate) + POL
But total assets ≠ extractable assets, which is the core problem this framework aims to solve.
Some protocols don't even have a treasury to discount. For example, a pure burn mechanism (USDC inflows used to buy back and burn tokens) does not create balance sheet assets that anyone can access. In this case, extractable treasury assets = 0, and enterprise value = market cap. This is the clearest case, requiring no subjective judgment.
For treasuries that do hold real assets, I introduce a "Claim Discount" framework, assigning a value between 0% and 100% based on the degree to which holders can actually control them:
- 0% Discount: Automatic buyback and burn, no governance vote required; or fund usage is entirely at the discretion of token holders.
- 25% Discount: Active DAO and a history of actual distributions.
- 50% Discount: Governance rights exist but are only on paper, never actually exercised.
- 75% Discount: Treasury controlled by the team, weak governance.
- 100% Discount: Funds controlled by a foundation, holders have no claim.
These percentages are the most subjective and vulnerable part of the entire framework, I admit. But two analysts arguing whether it's 25% or 50% is far more meaningful than both ignoring the treasury and only talking about P/E ratios.
Let's look at actual cases:
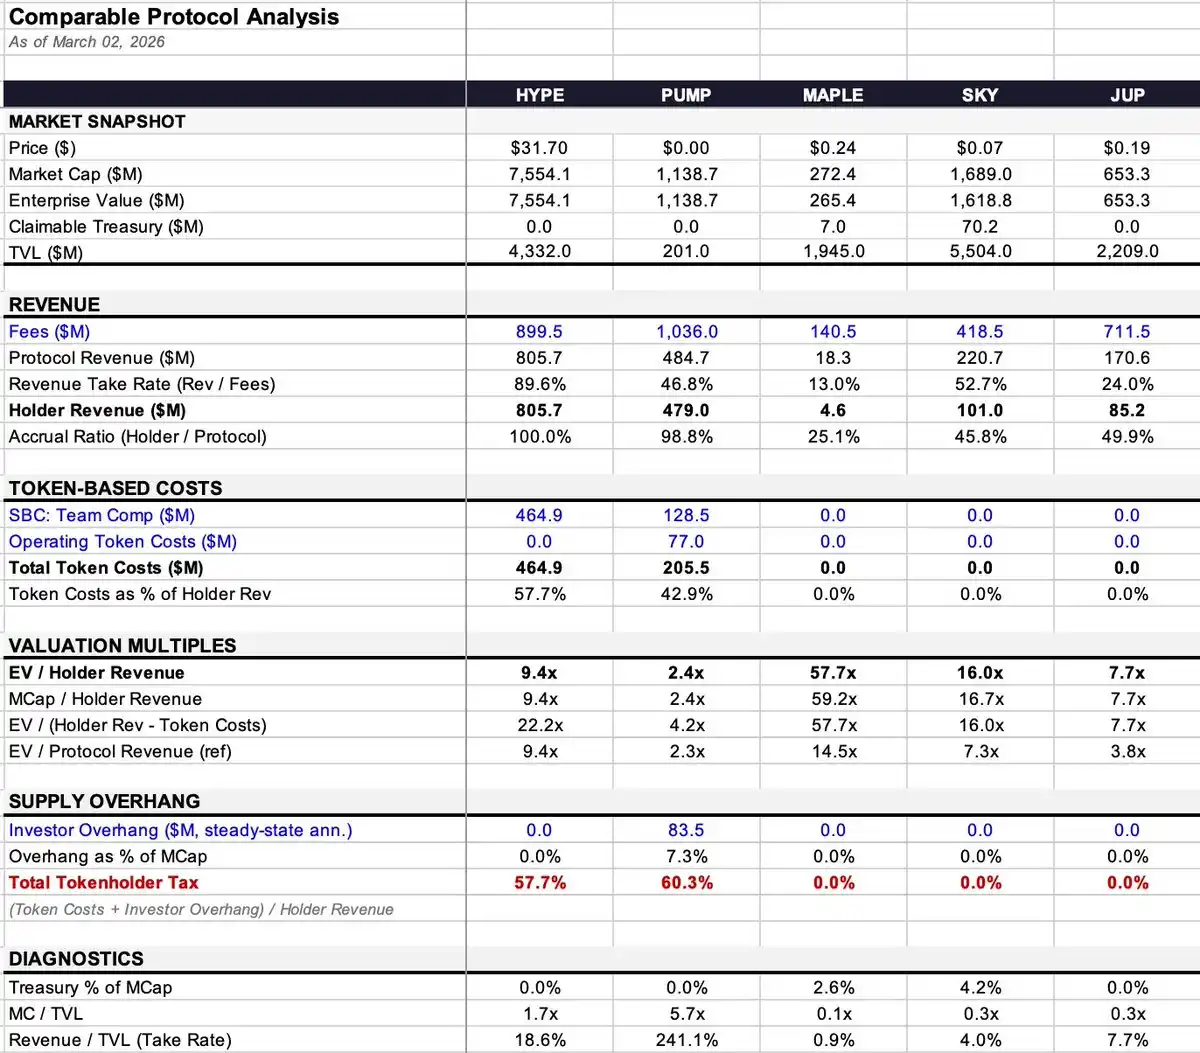
- Maple: Treasury has $9.36 million (99.7% stablecoins), a small amount. Enterprise value adjusted slightly from $272 million to $265 million, a minor impact.
- SKY: Treasury has $140.3 million, but 99.9% is its own tokens. After applying a 50% discount, I estimate the extractable value at $70.2 million, reducing enterprise value from $1.69 billion to $1.62 billion.
- PUMP: Reportedly holds about $700 million in stablecoins, but has no governance mechanism or distribution channel; holders simply cannot access it. Therefore, extractable assets = 0, enterprise value = market cap.
- HYPE and JUP: Similarly, pure burn or closed treasury, no judgment needed, enterprise value = market cap.
2. Revenue and Token Costs: How Much Actually Reaches My Pocket?
The gap between the money the protocol earns and the money holders actually receive is where most valuation frameworks fail, and it's key to the true valuation multiple.
Think of revenue as a three-tier waterfall:
- Fees: The total amount paid by users.
- Protocol Revenue: The portion the protocol keeps after paying LPs, validators, and other "supply-side" participants.
- Holder Revenue: The portion that ultimately reaches token holders through buybacks, burns, or direct distributions.
There are two key conversion rates in the middle:
- Retention Rate = Protocol Revenue ÷ Fees (How much the protocol can keep from total fees)
- Accrual Ratio = Holder Revenue ÷ Protocol Revenue (Of the portion kept, how much ultimately goes to holders)
The combined effect of these two ratios can vary dramatically:
- HYPE: Retention Rate 89.6%, Accrual Ratio 100%. Nearly $900 million in fees, $805.7 million ultimately flowed to holders.
- Maple: Retention Rate 13% ($140.5M fees → $18.3M protocol revenue), Accrual Ratio 25.1% ($18.3M protocol revenue → $4.6M holder revenue). The cumulative pass-through rate is only 3%, compared to HYPE's 90%.
Under the same framework, one is 3%, the other is 90%. If you directly compare these two protocols using "EV/Fees" or even "EV/Protocol Revenue," the difference is night and day.
Why use "Holder Revenue" as the denominator instead of "Protocol Revenue"?
In traditional finance, EV/Revenue works because equity holders have residual claim rights—legally, it all belongs to them. But token holders do not have this right; they only get the portion designed for them by the tokenomics. If revenue sits in a team-controlled treasury with no mechanism to distribute it to holders, then merely holding governance tokens does not make that revenue "yours."
Using "Protocol Revenue" as the denominator beautifies protocols with low accrual ratios, making them appear "cheaper" than they actually are. I call this gap the "Accrual Discount."
Take Maple as an example:
- EV/Protocol Revenue = 14.5x
- EV/Holder Revenue = 57.7x
A full 4x difference! With the same data, based on different denominators, your judgment of "what the market is asking" would be completely different.
3. Costs: Not All Dilution Is Created Equal
The term "dilution" is used too broadly in crypto. Misclassification leads to misvaluation.
Type 1: Team Incentives (Equity Incentives) — This is an Operating Cost
Warren Buffett said decades ago: If stock options aren't a cost, what are they? A gift? In traditional finance, it appears on the income statement, reducing profits. In crypto, it manifests as new tokens flowing into the market, but the economic essence is exactly the same—it's a real cost of operating the business.
- HYPE: Team incentives annualized $464.9 million, consuming 57.7% of holder revenue.
- PUMP: Team incentives annualized $128.5 million.
These should be included in the valuation multiple.
Type 2: Operational Token Costs (Ecosystem incentives, user acquisition, etc.) — This is also an Operating Cost
They function like user acquisition costs,同样是 real expenses, and should also be included in the multiple. PUMP has an additional $77 million in operational token costs besides team incentives, totaling $205.5 million in token costs.
The criterion is simple: Is it creating new token supply?
If the protocol merely distributes existing revenue to stakers without issuing new tokens, the cost is already reflected in the earlier cash flow (the difference between protocol revenue and holder revenue).
If the protocol mints or unlocks tokens that were not previously in circulation, that is real dilution, a business cost.
Type 3: Investor Lock-up Expiration Unlocks — This is a Market Event, not an Operating Cost
You wouldn't subtract VC sell-offs from Apple's profits to get an "adjusted profit." Similarly, this should not be included in the operating multiple.
PUMP has an annualized potential investor sell pressure of $83.5 million, 7.3% of market cap. This has a huge impact on price action and market dynamics, but is not an operating cost. I place it separately in a diagnostic metric called "Total Token Holder Tax" (Token Costs + Potential Investor Sell Pressure, as a percentage of Holder Revenue), but do not include it in the core valuation multiple.
4. Four Core Multiples and One Diagnostic Metric
Based on the above logic, we get the following metrics (defined here, referenced later):
- EV/Holder Revenue (Core Metric): The price you pay for every dollar of revenue that ultimately ends up in your pocket.
- Market Cap/Holder Revenue: Same as above, but without treasury adjustment. The difference reflects the impact of the balance sheet.
- EV/(Holder Revenue - Token Cost) (Cost-Adjusted Multiple): Deducts real business costs (team incentives, operational costs), but excludes investor sell pressure.
- EV/Protocol Revenue (For Reference Only): The gap with EV/Holder Revenue shows the size of the "Accrual Discount".
- Total Token Holder Tax (Diagnostic Metric): = (Token Cost + Investor Sell Pressure) ÷ Holder Revenue. It synthesizes the dual impact of business costs and supply pressure into one number. For example, PUMP at 60.3% means that for every $1 of revenue reaching holders, an additional $0.603 hits the market in the form of new supply. This number itself doesn't directly indicate valuation level but highlights the dynamic between cash flow and supply.
5. Data Snapshot and Case Highlights
- HYPE: Accrual Ratio 100%, 9.4x Holder Revenue. But high team incentive costs raise the cost-adjusted multiple to 22.2x. Clear revenue structure, complexity not on the revenue side.
- PUMP: Seems cheapest (2.4x), Accrual Ratio 98.8%. But treasury is inaccessible, and major unlock in August 2026. Cost-adjusted multiple rises to 4.2x, Total Token Holder Tax is a hefty 60.3% (highest in the sample).
- MAPLE: Largest Accrual Discount (4x). Protocol Revenue 14.5x vs. Holder Revenue 57.7x, a huge gap. No token costs, so cost-adjusted multiple remains the same.
- JUP: Cleanest balance sheet. Through "Net Zero Emissions" governance, no token costs, no investor sell pressure, no extractable treasury. All multiples converge around 7.7x.
- SKY: Accrual Ratio 45.8%, best case to show "how denominator choice affects valuation." Protocol Revenue multiple is 7.3x (seems cheap), while Holder Revenue multiple is 16.0x (not so cheap anymore). Treasury is mostly (99.9%) its own tokens, value needs discounting.
6. Conclusion
This framework certainly has flaws:
- Treasury Claim Discount is subjective: I use 25%, you might use 50%, and neither can convince the other.
- The judgment of "whether new tokens are issued" can be complicated: Some protocols have minting functions active but distribution channels dead, tokens accumulate in unallocated pools, making the situation ambiguous.
- Data sources are noisy: DeFiLlama's 30-day annualized data can make the same protocol look twice as cheap or expensive depending on the snapshot month.
But this is at least an actionable starting point. EV/Holder Revenue, adjusted for the balance sheet and real business costs, gives you a clearer idea: For every dollar you pay, how much revenue are you actually buying that will end up in your pocket?
The gap between the money the protocol earns and the money holders receive is the biggest fundamental mismatch in the current market. Many protocols generate hundreds of millions in fees, but holders only get a fraction, and most valuation frameworks don't even distinguish between the two.
Fortunately, the industry is starting to focus on value capture: Fee switches are being turned on, buybacks are replacing inflationary staking, governance layers are voting to pause incentives. We are building tools to measure what's really happening more accurately.
7. Data Sources and Methodology Notes
Revenue Data: DeFiLlama annualized data (last 30 days × 12). Advantage is sensitivity compared to half-year data, disadvantage is noise from single-month volatility.
Holder Revenue: Directly used DeFiLlama's "Holder Revenue" field, which includes only buybacks, burns, direct distributions.
Treasury Data:
MAPLE: $9.36M (DeFiLlama, 99.7% stablecoins)
SKY: $140.3M (DeFiLlama, 99.9% own tokens)
JUP: $0 (Closed)
PUMP: Stablecoins estimated median $500M (actual range $286M - $800M)
Token Costs:
MAPLE: $0. MIP-019 proposal (Oct 2025) ended staking distributions. Although a 5% inflation smart contract might still be minting, there is no distribution channel. (Source: docs.maple.finance, The Defiant 2025/10/31)
SKY: $0. Savings Module (STR) now distributes SPK and Chronicle Points, not SKY tokens. (Verified Mar 2026 at app.sky.money/rewards). Rune's mention of "600M SKY annually" in Aug 2024 is outdated, but governance can restart it anytime. (Source: sky.money FAQ, vote.sky.money)
JUP: $0. "Net Zero Emissions" proposal passed Feb 22, 2026 (75% in favor). DAO treasury closed until 2027.
Investor Sell Pressure:
PUMP: Steady-state annualized $83.5M. Actual unlock cliff starts Aug 2026, actual sell pressure over next 12 months approx. $48.7M (calculated over 7/12 months).
Lending Protocol Metrics:
MAPLE: Used actual Assets Under Management (AUM) ($3.79B, Q1 2026 report), not DeFiLlama TVL ($1.945B). Net Interest Margin (NIM) = Protocol Revenue / AUM. Detailed metrics in Excel appendix.
Cash Operating Expenses: Not estimated. Not disclosed by protocols, guessing would create false precision.
Equity Incentive Valuation: Calculated at current token price. Sensitive to price changes.