Expanding Glassnode: Macro and Traditional Finance Data

insights.glassnodePublished on 2026-04-16Last updated on 2026-04-16

Abstract

Glassnode is expanding its product offering to include macroeconomic and traditional finance (TradFi) data, recognizing that digital assets like Bitcoin are now a mainstream asset class increasingly influenced by global financial forces. As institutional participation grows—evidenced by Bitcoin ETFs surpassing $100 billion in AUM by early 2026—Bitcoin's price is more affected by monetary policy, geopolitical risks, and macroeconomic trends. Key metrics now integrated include central bank balance sheets, money supply (M2), interest rates, and government bond yields, which help contextualize Bitcoin within global liquidity cycles. The platform also tracks equity indices, fear gauges, forex rates, and commodities to assess risk appetite and market stress. This shift reflects a structural change: Bitcoin's correlation with traditional risk assets like the S&P 500 has strengthened, driven by institutional capital, post-COVID liquidity cycles, and ETF adoption. Glassnode aims to provide a unified platform for analyzing both on-chain and TradFi data, enabling users to better interpret market moves and regime shifts in a maturing digital asset ecosystem.

Our guiding principle in developing Glassnode's product offering has always been about enabling a comprehensive view of digital asset markets. This has meant delivering industry-leading on-chain and derivatives analytics, while also helping investors interpret the broader forces shaping market behavior.

As digital assets mature, these forces increasingly extend beyond on-chain data. Today, we are further expanding our product to reflect this ongoing shift. Glassnode now integrates macroeconomic and traditional finance (TradFi) data, bringing everything you need to understand Bitcoin and digital assets into a single platform.

Why Macro Now Matters More Than Ever

Digital assets are no longer a niche experiment. They are a mainstream asset class, with growing participation from institutions, ETFs, and traditional finance players. The recent approval and rapid growth of Bitcoin ETFs – now exceeding $100 billion in assets under management as of early 2026 – is a clear signal of this shift.

But with this integration comes a new dynamic: Bitcoin’s price is increasingly influenced by traditional financial forces. Geopolitical risks, monetary policy, and broader macroeconomic trends now play a critical role in shaping Bitcoin’s trajectory. For investors, traders, and institutions, this makes access to a broader set of actionable data more important than ever.

That is why Glassnode is expanding its data coverage to include TradFi and macro metrics. The goal is not to move beyond on-chain analysis, but to extend it — enabling users to connect the dots between digital asset markets, traditional financial data and the global economy.

From Digital Gold to Liquidity-Sensitive Asset

Bitcoin was created in the immediate aftermath of the Global Financial Crisis in 2009, as a direct response to what its creator saw as a fundamental flaw of modern finance: the ability of central banks and governments to create money at will. Bitcoin's fixed supply of 21 million coins is not just a technical detail; it is a political statement.

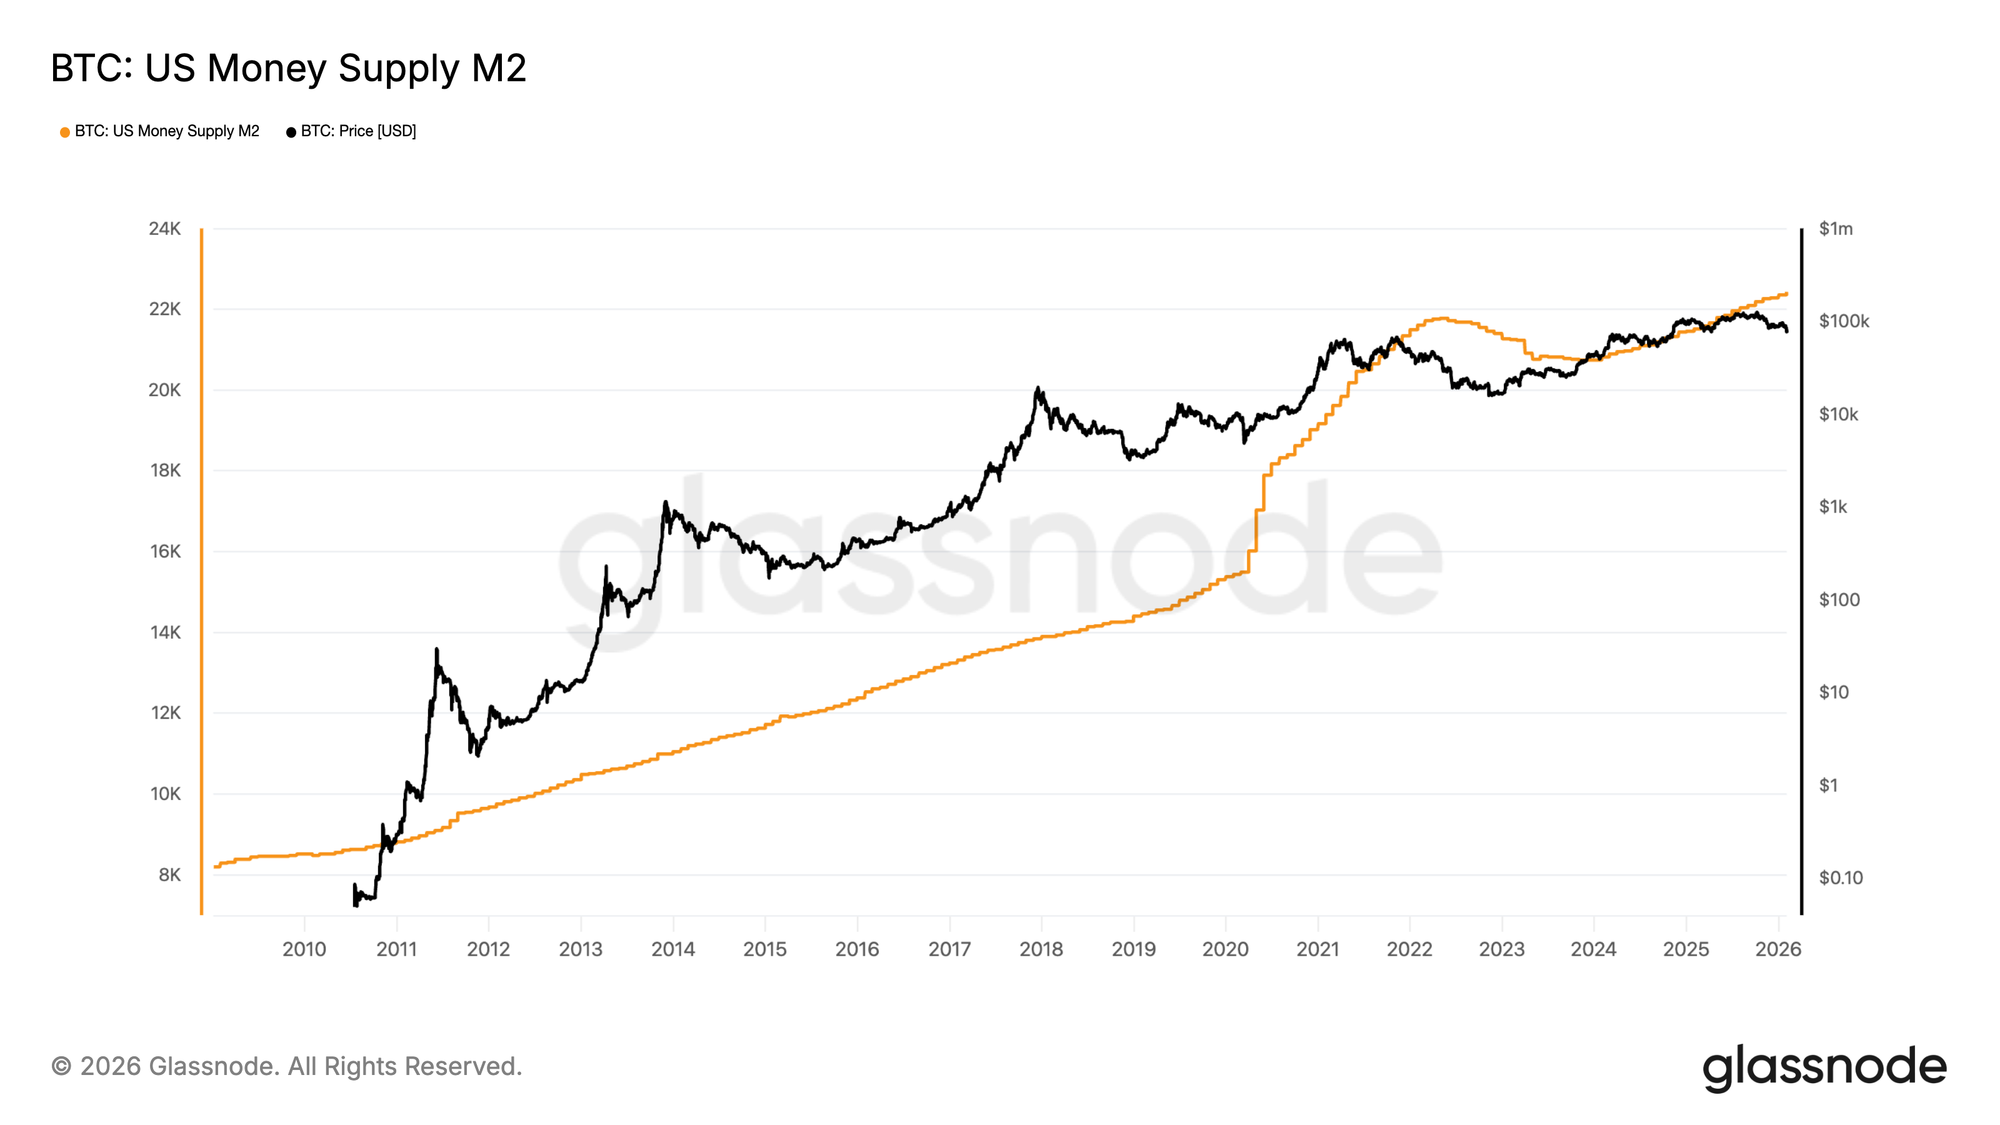
This aspect becomes most relevant when central banks are most active. When central banks expand their balance sheets, money supply grows, financial conditions become more supportive, and investors generally have more capital available to allocate across risk assets. In that environment, Bitcoin has often benefited alongside other liquidity-sensitive assets.

By contrast, periods of monetary tightening tend to create a more difficult backdrop. Higher rates, shrinking central bank balance sheets, and weaker liquidity conditions typically reduce risk appetite and can weigh on digital asset markets.

This is why it is useful to monitor metrics such as:

  • US Money Supply (M2)
  • US Central Bank Balance Sheet
  • Euro Area Money Supply (M2)
  • Euro Area Central Bank Balance Sheet

They help place Bitcoin price action in the broader context of global liquidity cycles and provide a clearer macro framework for interpreting market moves.

View live chart

From Dovish to Hawkish: How Interest Rate Shifts Impact Bitcoin

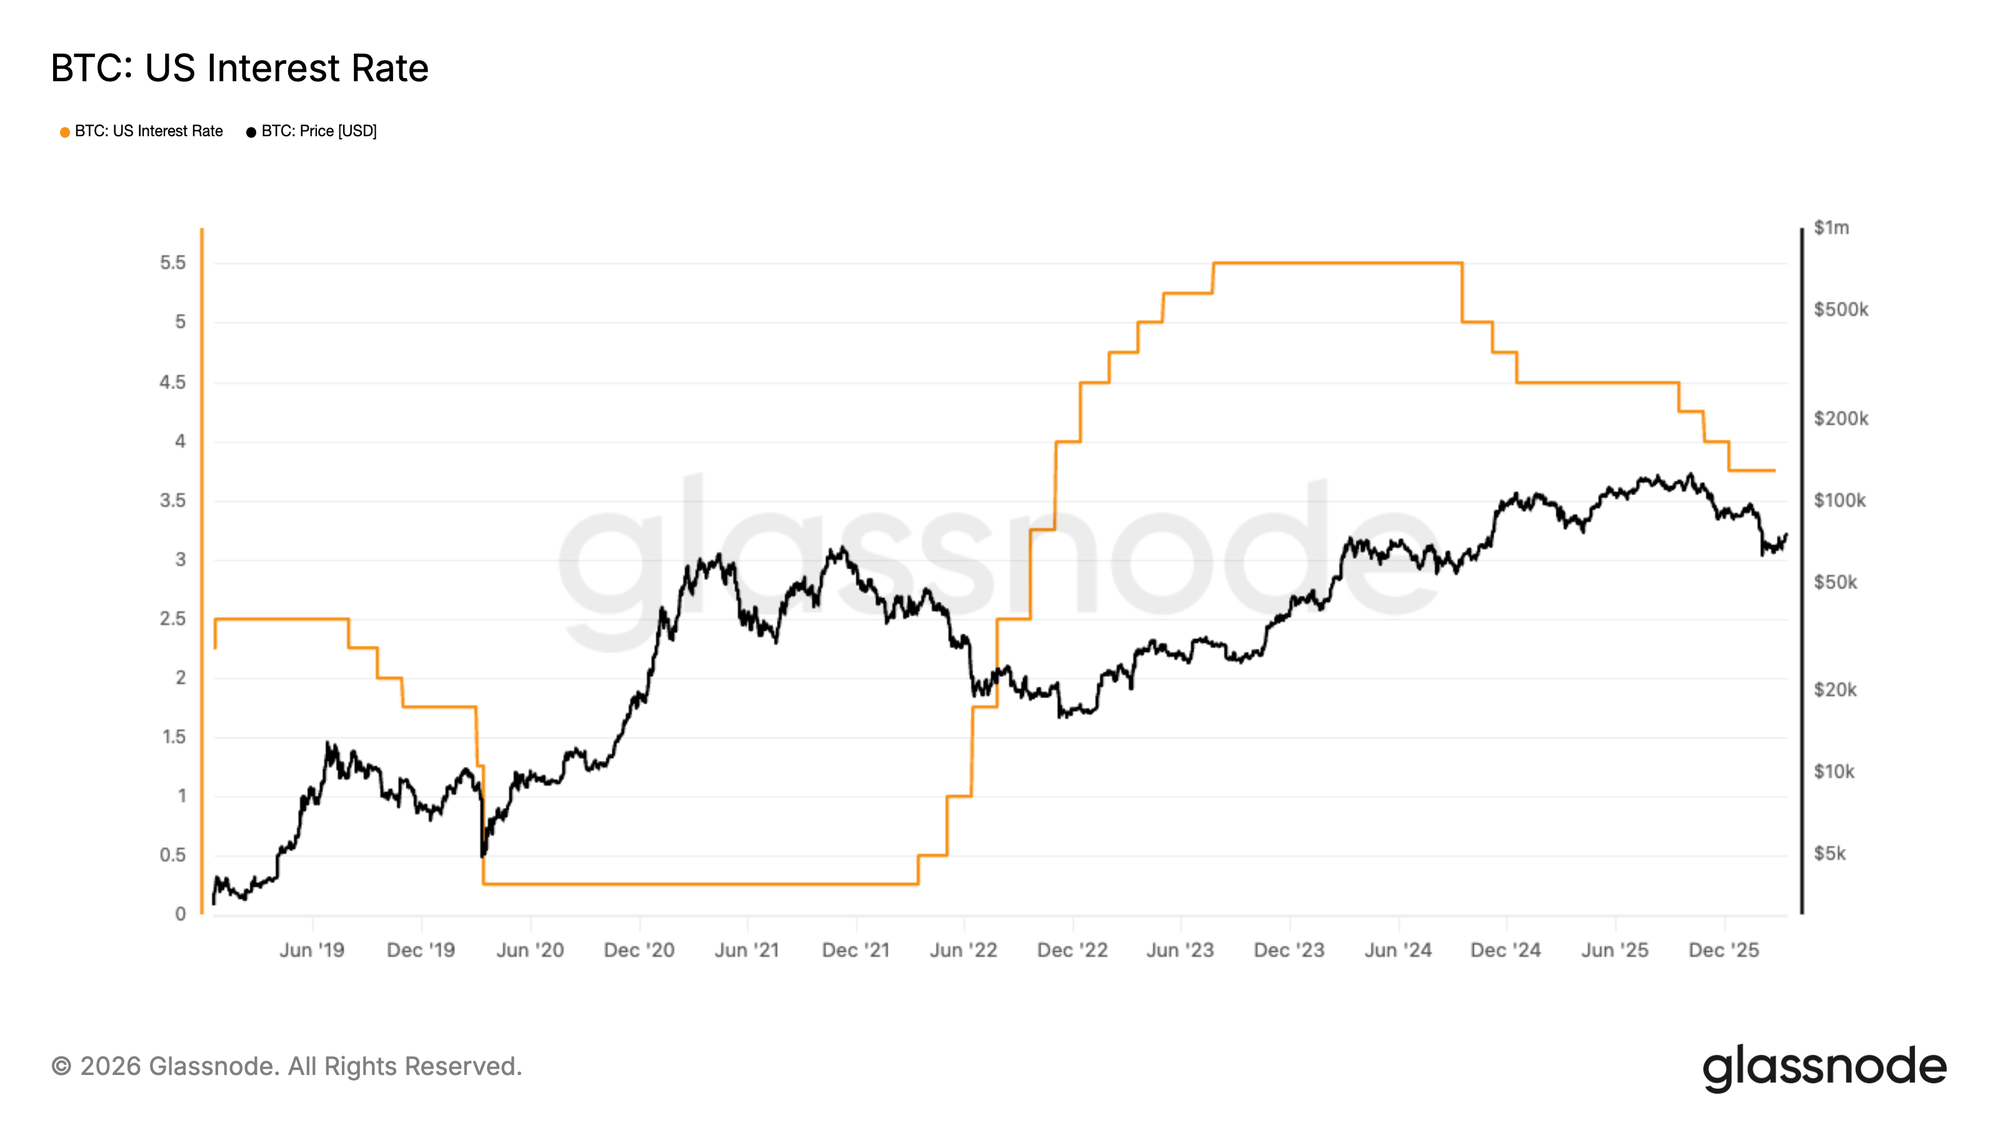
Interest rates are another key transmission channel. Bitcoin does not generate cash flow, so the opportunity cost of holding it changes meaningfully with monetary policy. In tighter regimes, higher rates tend to support the dollar, raise real yields, and reduce appetite for speculative assets. In looser regimes, easier financial conditions can support broader risk-taking. This is why metrics such as US Interest Rate, Euro Area Interest Rate, US 10Y Yield, and Germany 10Y Yield are relevant to digital asset investors, not just bond traders.

As illustrated above, periods of low interest rates tend to support Bitcoin and other risk assets, as cheaper capital and looser financial conditions encourage risk-taking. Conversely, rising interest rates increase the cost of capital and typically reduce investor appetite for risk, creating a more challenging environment for Bitcoin price performance.

View live chart

Traditional Finance Data in Digital Assets

As digital asset markets mature, they are becoming increasingly connected to the same macro forces that move equities, bonds, FX, and commodities. Bitcoin now trades in an environment shaped by interest rates, liquidity conditions, dollar strength, inflation expectations, and risk sentiment.

As a result, understanding digital asset markets requires more than on-chain data alone. By adding TradFi metrics, Glassnode gives users the context needed to interpret market moves, identify regime shifts, and assess whether a move is digital asset-specific or part of a broader cross-asset trend.

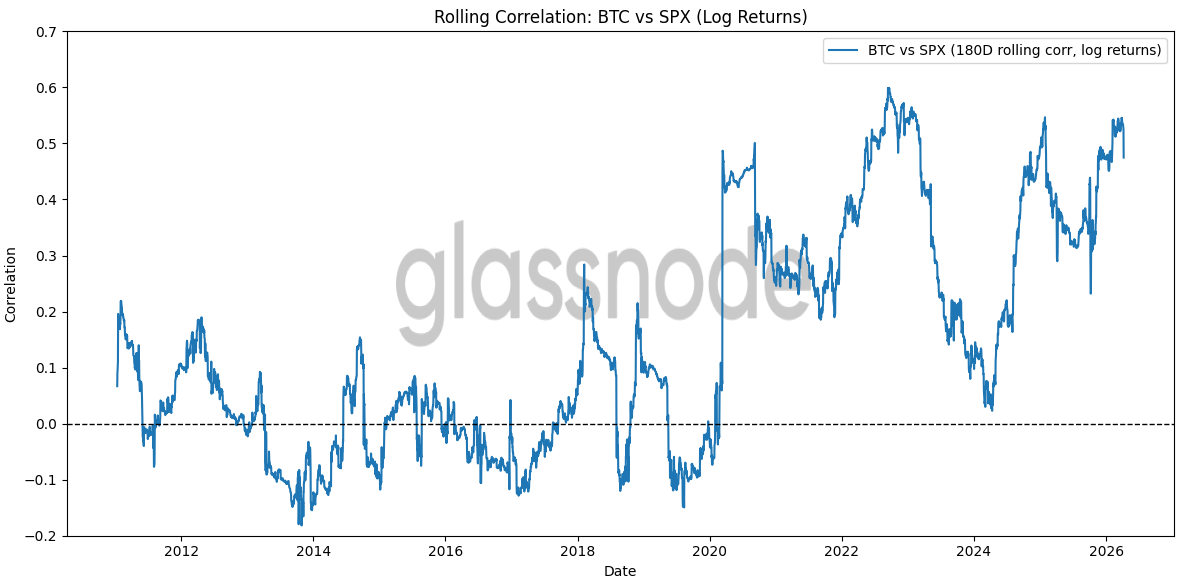
The chart above plots the 180-day rolling correlation between Bitcoin and the S&P 500 using log returns. The main signal is that BTC appears to have become more sensitive to macro and broader risk-asset dynamics over time. In earlier years, the correlation hovered around zero or was occasionally negative, while in recent years it has often been meaningfully positive.

This does not appear to be a temporary dislocation, but a structural shift, driven by three forces:

  • the entry of institutional capital that allocates across asset classes;
  • the post-COVID liquidity cycle, which inflated and then deflated risk assets simultaneously;
  • and the launch of spot Bitcoin ETFs, which embed BTC more directly into traditional portfolio flows.

This supports the view that Bitcoin is no longer solely a standalone, crypto-native asset; it now trades alongside broader liquidity and risk conditions more frequently than in the past.

View live chart

Using TradFi Metrics to Contextualize Digital Asset Markets

Glassnode's TradFi market metrics suite helps users understand the external forces that increasingly influence digital asset markets.

Rate and yield curve indicators provide insight into monetary policy, growth expectations, and recession risk. Relevant metrics: The US 10Y-2Y Spread, Germany 10Y-2Y Spread, US 2Y Yield, US 10Y Yield, Germany 2Y Yield, and Germany 10Y Yield.
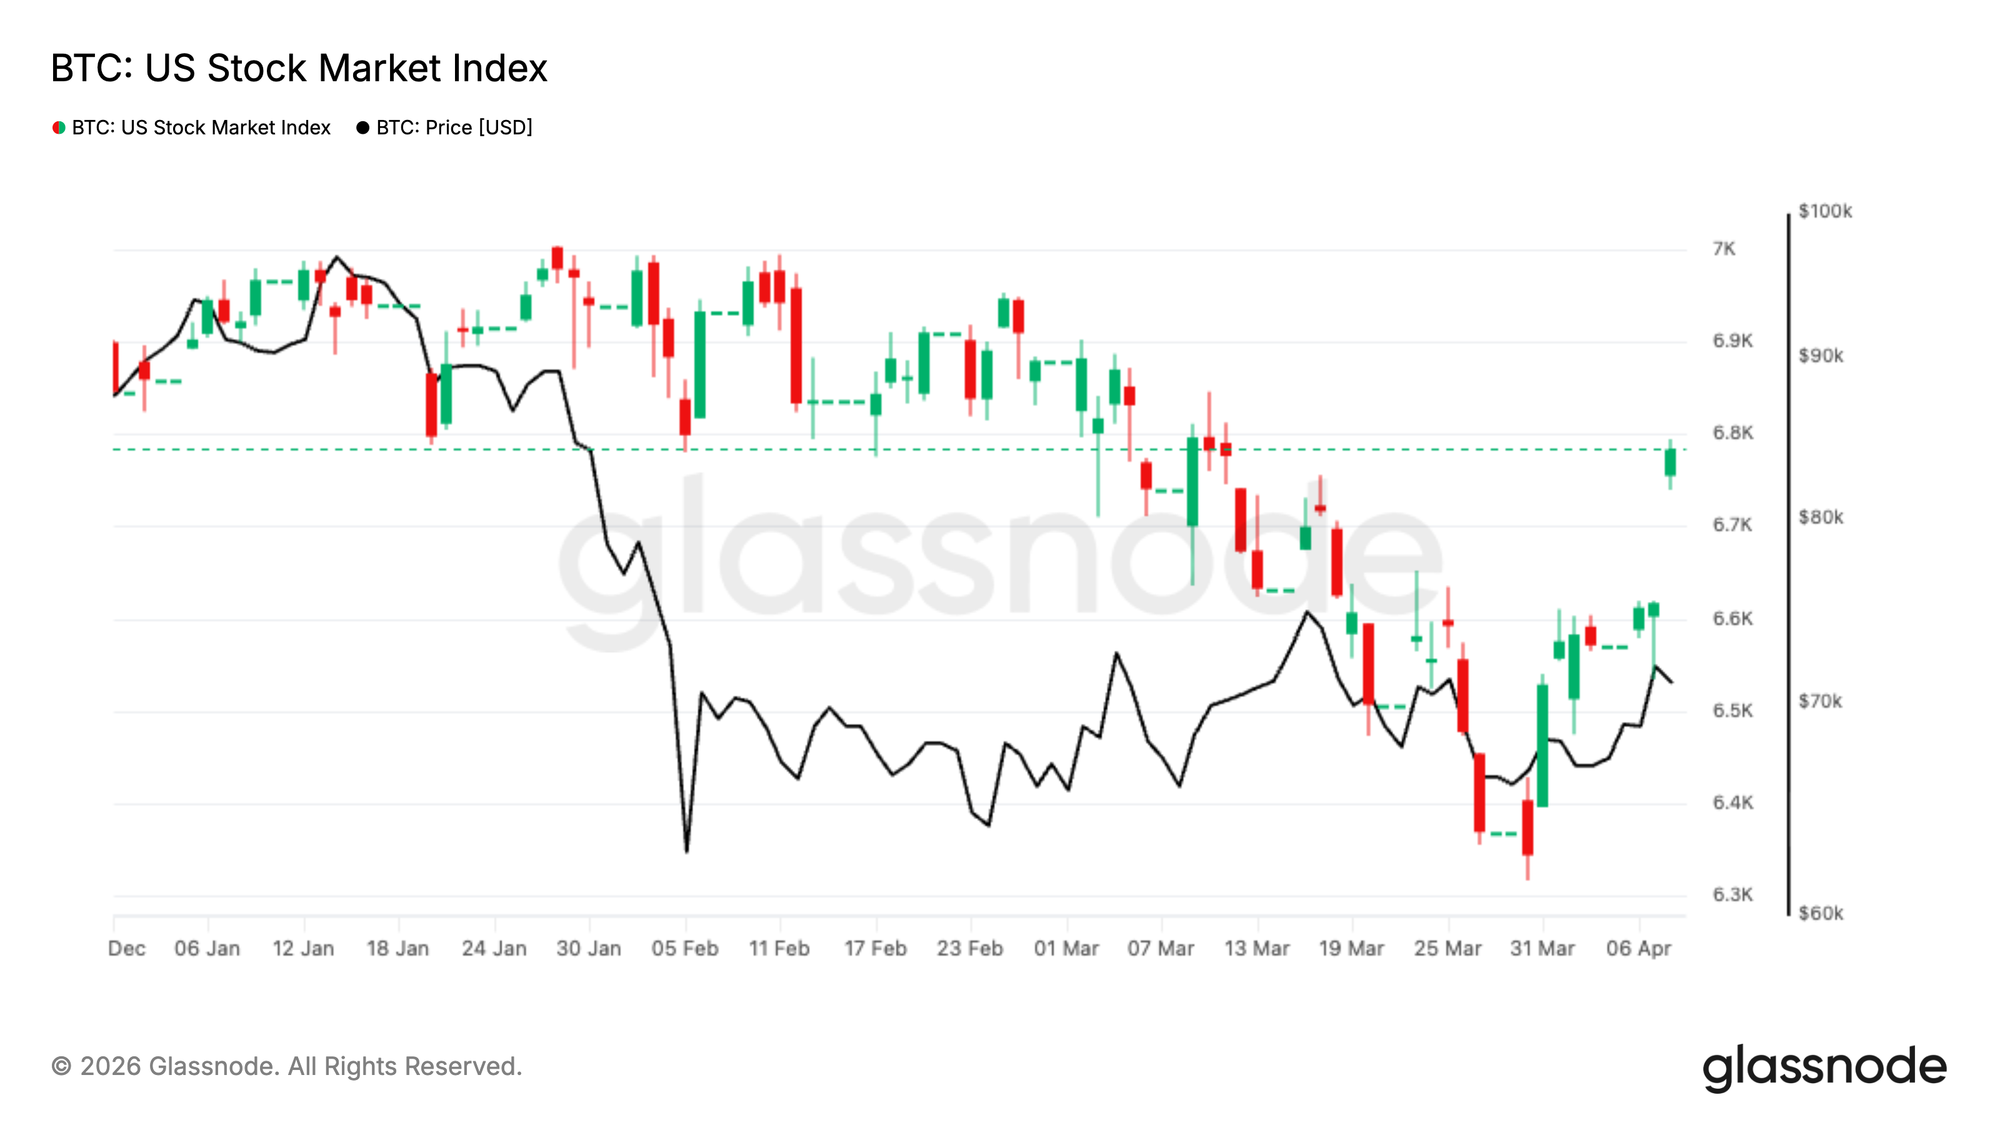
Equity benchmarks help gauge global risk appetite and market stress. Relevant metrics: The US 500 Stock Market Index and EU50 Stock Market Index, along with the US Fear Index and EU Fear Index

FX measures provide context on dollar strength and liquidity conditions, both of which can materially affect digital asset performance. Relevant metrics: EUR/USD and the U.S. Dollar Index

Commodity prices, including Gold, Silver, and WTI Crude Oil, add another layer by reflecting inflation expectations, safe-haven demand, and geopolitical risk.

One Platform, Full Market Context

The broader point is that digital asset markets are maturing. The arrival of spot ETFs, growing institutional participation, and stronger links to policy and geopolitics mean that digital assets increasingly sit within the same information ecosystem as equities, bonds, FX, and commodities. Glassnode’s Macro and TradFi metric categories are built for this environment.

Glassnode remains the home for deep digital asset-native intelligence. At the same time, delivering a comprehensive analytical view of the markets now requires tools to understand the macro and traditional financial forces that shape them.

Explore the new Macro and TradFi metrics in Glassnode Studio or compare pricing plans to gain access.

Compare plans

  • Follow us on X for timely market updates and analysis
  • Join our Telegram channel for regular market insights
  • For on-chain metrics, dashboards, and alerts, visit Glassnode Studio

Disclaimer: This report is for informational and educational purposes only. The analysis represents a limited case study with significant constraints and should not be interpreted as investment advice or definitive trading signals. Past performance patterns do not guarantee future results. Always conduct thorough due diligence and consider multiple factors before making investment decisions.

Related Questions

QWhat is the main reason Glassnode is expanding its product to include macroeconomic and traditional finance (TradFi) data?

ABecause digital assets have matured into a mainstream asset class and Bitcoin's price is increasingly influenced by traditional financial forces like geopolitical risks, monetary policy, and macroeconomic trends, making access to a broader set of actionable data more important than ever.

QAccording to the article, how do periods of monetary tightening by central banks typically affect Bitcoin?

APeriods of monetary tightening, characterized by higher interest rates, shrinking central bank balance sheets, and weaker liquidity conditions, tend to reduce risk appetite and create a more difficult backdrop that can weigh on digital asset markets like Bitcoin.

QWhat are two specific examples of macroeconomic metrics mentioned that help contextualize Bitcoin's price action within global liquidity cycles?

ATwo examples are the US Money Supply (M2) and the US Central Bank Balance Sheet. The article also mentions Euro Area equivalents of these metrics.

QThe article states that Bitcoin's correlation with the S&P 500 has changed over time. What is the described trend and what are the three driving forces behind this structural shift?

AThe trend is that Bitcoin's correlation with the S&P 500 has shifted from hovering around zero or being negative in earlier years to being meaningfully positive in recent years. The three driving forces are: 1) the entry of institutional capital that allocates across asset classes, 2) the post-COVID liquidity cycle, and 3) the launch of spot Bitcoin ETFs.

QBesides on-chain data, what four categories of TradFi metrics does Glassnode now provide to help users understand the external forces influencing digital asset markets?

AThe four categories are: 1) Rate and yield curve indicators, 2) Equity benchmarks, 3) FX measures, and 4) Commodity prices.

Related Reads

Where the AI Bubble Really Is: Which Layer of Players Are Naked

AI Bubble: Where It Really Is and Who's Swimming Naked This analysis dissects the AI industry not as a single entity but as a five-layer pyramid, arguing that bubbles are concentrated in specific tiers, not uniformly distributed. **Key Distinction from the 2000 Dot-com Bubble:** Unlike 2000, where companies had stock prices before revenue, today's leading AI players have massive, contract-backed revenue driving their valuations. Core infrastructure demand is real, with every GPU running at full capacity for paying customers. **The Five-Layer Pyramid & Bubble Assessment:** * **L0 (Fab/Manufacturing) & Top L4 (Leading AI Apps): NO BUBBLE.** Companies like TSMC, NVIDIA, major cloud providers (Microsoft, Google, Meta, Amazon), and top AI labs have real revenues and orders. Supply is tightly constrained by TSMC's disciplined capacity control and physical limits like power/land for data centers, preventing a supply glut. * **L1 (Memory): BATTLEGROUND.** Sky-high HBM margins could signal a new structural cycle or a classic "boom before bust." The oligopoly of three major players may enforce supply discipline, making this a high-stakes bet. * **L2 (Interconnect/Optical Modules): BUBBLE TERRITORY.** Companies like Lumentum and AAOI have seen stock surges (4-10x) far outpacing revenue growth. This hardware segment has lower physical barriers to expansion than fabs, allowing speculation. It mirrors the 2000 bubble's epicenter—optics. * **L3 (Infrastructure/"GPU Landlords"): VULNERABLE.** GPU leasing companies profit from the current compute shortage but own no long-term moat. Their business model relies on a temporary bottleneck that will ease as big tech expands and new tech (e.g., potential space-based data centers) emerges. * **L4 Long Tail (VC-backed Startups): STRONG BUBBLE SIGNALS.** VC funding concentration in AI is twice that of the 1999 peak. Many startups with little revenue use the valuation logic of successful giants to justify their own, creating high risk of a "valuation crunch" when funding dries up. **Critical Risks to Monitor:** 1. **GPU Depreciation & Accounting:** Companies extending the assumed useful life of GPUs artificially boost profits. The true economic life depends on future generational leaps from NVIDIA. 2. **"GPU Credit" & Off-Balance-Sheet Leverage:** Emerging structures where shell companies borrow to buy GPUs and lease them out (with chipmakers sometimes investing) move debt off major balance sheets. This echoes the "vendor financing" of 2000 and the securitization risks of 2008, though currently small-scale. 3. **TSMC Abandoning Caution:** If the primary supply bottleneck (TSMC's conservative capacity planning) breaks, runaway supply could trigger a bust. 4. **Algorithmic Efficiency Breakthrough:** A major leap in software efficiency could drastically reduce the need for raw compute hardware, undermining the investment thesis. **Conclusion:** The AI boom is expensive and has frothy areas, but its core is underpinned by real demand and physical supply constraints. The bubble risk is layered: most present in optical components, GPU leasing, and the long-tail startup ecosystem, while the foundational chip manufacturing and leading application layers remain relatively solid—for now.

marsbit5m ago

Where the AI Bubble Really Is: Which Layer of Players Are Naked

marsbit5m ago

Standing in the Light: A Comprehensive Guide to the Optical Module and CPO Supply Chain

"Standing in the Light: Understanding the Optical Module and CPO Industry Chain" This article analyzes the critical role of optical communication technology, specifically optical modules and Co-Packaged Optics (CPO), as the "nervous system" for modern AI data centers. With exponential growth in AI computational demands (e.g., NVIDIA's Vera Rubin architecture), traditional electrical interconnects using copper cables face severe bottlenecks in bandwidth, power consumption, and signal integrity over distance. The core function of an optical module is to act as a "translator," converting electrical signals from chips into optical signals for transmission over fiber (and vice-versa). Key internal components include lasers, modulators, photodetectors, drivers, and DSP chips. The industry is currently transitioning from 800G to 1.6T modules. However, the future lies in CPO. This next-generation technology integrates the optical engine directly with the switch ASIC/XPU on the same package substrate, drastically reducing power consumption (by ~3.5x according to NVIDIA), overcoming bandwidth density limits, and minimizing signal attenuation compared to traditional pluggable modules. Key challenges for CPO include advanced packaging capacity (dominated by TSMC), thermal management, repairability, and standardization. The article details the broader technology landscape, including Near-Packaged Optics (NPO, a pragmatic intermediate step), Linear-drive Pluggable Optics (LPO), Optical I/O (OIO for chip-level integration), and Optical Circuit Switches (OCS). A comprehensive CPO industry chain is mapped, highlighting shifting power dynamics: * **Architecture Definers:** NVIDIA, Broadcom, and Marvell now hold greater influence. * **Advanced Packaging & Manufacturing:** TSMC is central; Fabrinet is a key EMS player. * **Lasers ("The Heart"):** A strategic bottleneck. EML lasers are led by Lumentum and Coherent (both receiving major NVIDIA investments). CW lasers, favored for CPO/silicon photonics, see strong Chinese players like Source Photonics and Sicoya. * **Silicon Photonics Chips:** The mainstream path for CPO engines, with key players like Broadcom, Intel, Marvell, and China's Accelink. * **Fiber Connectivity Components:** A major new, high-growth market created by CPO, including Fiber Array Units (FAU), Polarization-Maintaining Fiber (PMF), and MPO connectors. Companies like Tianfu Communication and US Conec are leaders. * **Fiber & Cable:** Experiencing a super-cycle (e.g., Corning, Yangtze Optical Fiber). * **PCB/Substrates:** Requiring advanced materials (e.g., Shengyi Tech). * **DSP & SerDes:** Functions are integrated into switch ASICs in the CPO era (e.g., Broadcom, Astera Labs). * **Optical Module Makers:** Transitioning from standalone module suppliers to providers of optical engines and NPO/LPO solutions while riding the current pluggable boom (e.g., Zhongji Innolight, Eoptolink). The investment timeline is segmented: Short-term (2026-2027) features the "last feast" for pluggable modules and CPO's initial rollout. Medium-term (2027-2029) will see CPO expand and NPO peak. Long-term (2029-2032+) involves CPO/OIO penetration into intra-rack scaling. In conclusion, optical interconnects are fundamental to AI infrastructure. The competitive landscape sees US firms leading in architecture and high-end chips, TSMC in advanced packaging, and Chinese firms holding strong positions in modules, connectivity components, CW lasers, and fiber/cable. The future belongs to companies that can navigate the technological shift from "selling shovels" (modules) to "building highways" (CPO/OIO infrastructure).

marsbit15m ago

Standing in the Light: A Comprehensive Guide to the Optical Module and CPO Supply Chain

marsbit15m ago

Trading

Spot
Futures
活动图片