How Far is the Current U.S. Stock Bull Market from Historical Bubble Peaks?

marsbitPublished on 2026-06-09Last updated on 2026-06-09

Abstract

Title: How Far Is the Current U.S. Stock Bull Market from Historical Bubble Peaks? Summary: According to Goldman Sachs' chief U.S. equity strategist, current market exuberance ranks at the 86th historical percentile. While approaching, this level remains notably below the extremes seen at the peaks of the 2000 dot-com bubble (100th percentile) and the 2021 bull market (95th percentile). The recent 15% surge in the S&P 500 over two months represents one of the strongest volatility-adjusted rallies in over 50 years, primarily fueled by AI-related enthusiasm and backed by significant upward revisions to earnings estimates, providing a more fundamental basis than past momentum-driven peaks. Key risk signals—speculative frenzy, deteriorating growth, heavy equity issuance, and Federal Reserve tightening—are all closer to their historical triggers than a few months ago but are not yet fully activated. For instance, IPO activity is recovering, and market breadth remains narrow, though not at dot-com bubble extremes. The strategist cautions that while the current cycle may not replicate past peaks exactly and a downturn does not require extreme euphoria, risks are accumulating. The overall assessment is that the bull market still has room to run, but the window of opportunity is gradually narrowing.

Original Author: Zhao Ying

Original Source: Wall Street News

The latest assessment from Goldman Sachs' chief U.S. stock strategist shows that the current market euphoria has climbed to the 86th historical percentile, approaching but not yet reaching the extreme levels seen at the peaks of the 2000 dot-com bubble and the 2021 bull market.

Over the past two months, the S&P 500 index surged 15% before Friday's pullback, a gain ranking in the 99th percentile of historical data since 1980. In his latest report, Goldman Sachs' chief U.S. stock strategist Ben Snider pointed out that, although the four historical signals of a bull market peak — speculative frenzy, deteriorating growth, massive equity issuance, and Fed tightening — are not fully in place yet, each is closer to its trigger threshold than it was a few months ago.

For the market, this judgment means there is still room for the current bull market, but risks are accumulating. Snider explicitly stated "we're not there yet," while also warning that markets don't need investors to be extremely euphoric to decline, and historical patterns may not repeat themselves in this cycle.

The Strength of the Rally: The Strongest Volatility-Adjusted Rebound in 50 Years

The speed of this rebound has already left its mark in history. According to Goldman Sachs data, the S&P 500's roughly 15% gain over about two months, relative to realized volatility, yields a return/volatility ratio near 4, the highest level in over 50 years.

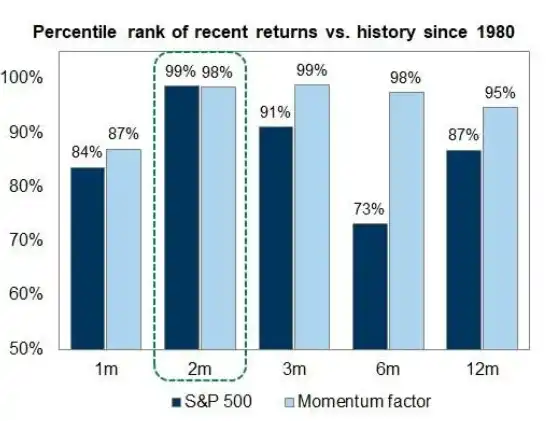
Artificial intelligence is the core theme driving this market phase. AI concept stocks, the momentum factor, and major indices are rising in sync, forming a high level of resonance.

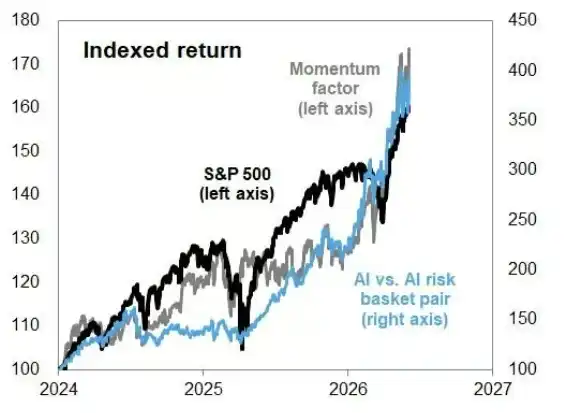
Snider notes that unlike similar momentum-driven rallies in the past (such as late 1999 and late 2021), the main support for this round of gains comes from substantial recent upward revisions to earnings expectations, rather than a pure sentiment bubble. This provides a somewhat more solid fundamental backing for the current upswing.

Euphoria Indicator: 86th Percentile, Below Two Historical Peaks

To quantify current market sentiment, Snider constructed a comprehensive evaluation framework covering four categories and nine indicators. Historical data shows that at the peak of the 2000 dot-com bubble, the median ranking of these indicators reached the 100th historical percentile; at the 2021 bull market high, it was the 95th percentile. The current reading is the 86th percentile — above the historical average, but still significantly short of the previous two extreme peaks.

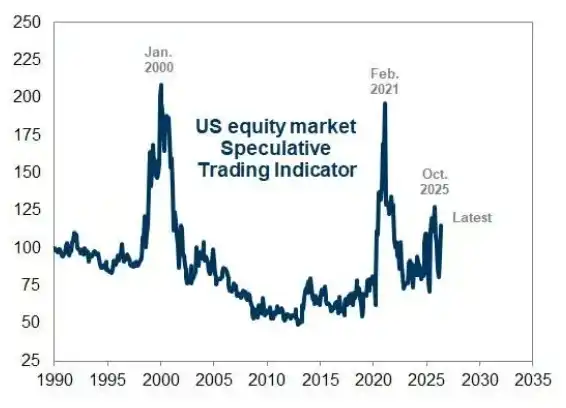
Specifically, Goldman Sachs' speculative trading indicator has risen in recent months but remains below levels at the end of 2025 and far below the peaks of 2000 and 2021. Among various speculative trading activities, the trading volume of high-valuation stocks has increased significantly recently, while the trading activity of unprofitable stocks is relatively mild. In addition, both equity call option volume and retail margin balances are trending upward, indicating investor sentiment is heating up.

Notably, the market breadth of this rally is extremely narrow, but it has not yet reached the extreme concentration seen during the dot-com bubble.

Four Risk Signals: Not Triggered Yet, but Distance is Shortening

Goldman Sachs' analytical framework attributes the end of historically high-valuation, high-concentration bull markets to four types of factors: speculative frenzy, deteriorating growth prospects, extremely bloated equity issuance, and Federal Reserve policy tightening. Snider points out that none of these four conditions fully matches the current environment, but each is closer to its warning line than at the beginning of the year.

IPO activity is reviving, with pressure beginning to show on the equity issuance side; rising input costs are compressing corporate profit margins, posing a potential threat to growth prospects; interest rate market pricing has started to reflect an increased probability of Fed rate hikes, although Goldman Sachs economists believe actual hikes are unlikely.

Snider also emphasizes that market declines do not require investors to be extremely euphoric as a precondition, and the euphoric characteristics seen at past bull market peaks may not reappear in identical form in this cycle. This means that even though current indicators have not yet reached historical extremes, investors should not view this as a sufficient guarantee of a safety margin.

Overall, Goldman Sachs' assessment offers a cautious but not pessimistic judgment: the euphoria level of this bull market is "getting closer and closer" to the historical peak range, but has not arrived yet. The key support for this judgment is that the current gains still have improving earnings expectations as fundamental backing, rather than being purely sentiment-driven. However, with the momentum factor remaining strong, market concentration high, and some risk signals quietly intensifying, Snider's report essentially serves as a reminder to investors: the window is still open, but it is slowly narrowing.

Related Questions

QAccording to the Goldman Sachs report, how does the current market euphoria level compare to historical bubble peaks like 2000 and 2021?

AThe current market euphoria level is at the 86th percentile historically. This is above the historical average but still significantly below the peaks of the 2000 dot-com bubble (100th percentile) and the 2021 bull market (95th percentile).

QWhat is unique about the recent rally in the S&P 500 compared to historical momentum-driven rallies?

AUnlike previous momentum-driven rallies (e.g., late 1999 and 2021), the recent surge is primarily supported by significant upward revisions to near-term earnings expectations, providing a more solid fundamental foundation rather than being driven purely by sentiment.

QWhat are the four classic risk signals that historically signaled the end of high-valuation, concentrated bull markets, according to Goldman Sachs?

AThe four classic risk signals are: 1) Speculative fervor, 2) Deteriorating growth prospects, 3) Extremely high levels of equity issuance, and 4) Federal Reserve policy tightening.

QWhat is the status of these four risk signals in the current market environment?

ANone of the four risk signals are fully met in the current environment. However, Goldman Sachs notes that each one is closer to its triggering threshold than it was several months ago.

QWhat is Goldman Sachs' overall assessment of the current bull market's stage?

AGoldman Sachs' assessment is cautiously optimistic. They believe the bull market still has room to run as it is not yet at an extreme peak, but they warn that risks are accumulating, the window of opportunity is still open but is gradually narrowing.

Related Reads

AI Agent Completely Transforms Web3 Gaming: From the Rugpull Bakery Bot Controversy to the New 2026 Agent Paradigm

This article explores how the AI Agent paradigm is fundamentally transforming Web3 gaming, moving from a disruptive force to a core, legitimized element. It begins with the controversy in the competitive baking game Rugpull Bakery, where automated scripts caused fairness issues. Instead of banning them, the developers integrated AI Agents into the official gameplay by providing technical documentation (skill.md, agent.json), marking a shift towards "Agentic Gaming." The piece outlines three primary implementation models for AI Agents in Web3 games by 2026: 1. **Autonomous Competitors & Economic Entities:** AI Agents act as independent players with unique strategies. Examples include TEN Protocol's poker agents, AI Arena's trainable NFT fighters, and Satoshi Strike Force's "Digital Athletes" trained on player data. The Somnia blockchain is highlighted as a dedicated "Agentic L1" infrastructure supporting this model at scale. 2. **Modular Infrastructure & Programmable Environments:** This model, exemplified by EVE Frontier, allows AI Agents to program game world logic itself. Using "Smart Assemblies" (e.g., Smart Turrets, Smart Gates), Agents can modify shared economic and physical rules on-chain, creating dynamic, player/AI-built worlds. The ERC-8183 standard further enables these automated entities to hire other AI services for complex tasks. 3. **Hybrid Companions & Dynamic Adaptation:** Here, AI serves as a collaborative partner. In Parallel Colony, highly autonomous AI Avatars work alongside human players who provide high-level guidance. Illuvium plans to use AI to make NPCs dynamic and responsive, creating personalized, emergent narratives for each player. The conclusion posits that Web3 gaming has reached a "post-human" inflection point. Blockchains' transparency and programmability, combined with new standards and infrastructure like Somnia, make integrating and governing AI Agents not just viable but essential. The future lies in a symbiotic digital order where players transition from manual laborers to commanders and partners of algorithmic intelligence.

marsbit15m ago

AI Agent Completely Transforms Web3 Gaming: From the Rugpull Bakery Bot Controversy to the New 2026 Agent Paradigm

marsbit15m ago

Saylor's Purchase of 1550 Bitcoin Is a Bad Trade

**Title: Saylor's Purchase of 1,550 Bitcoins Was a Bad Trade** The article critically analyzes Strategy's recent move of selling 32 bitcoins followed by a much larger purchase of 1,550 bitcoins. While appearing bullish, the author argues this trade is detrimental to MSTR shareholders. The core argument revolves around the concept of "breakeven modified Net Asset Value (mNAV)," a key metric for Strategy. To increase Bitcoin per share (BPS) for MSTR holders, Strategy must issue new shares at a premium high enough that the funds raised can buy more bitcoin than the bitcoin backing each existing share. Currently, this breakeven mNAV is estimated at 1.30. The recent trade failed on two counts: 1. The shares for the $181 million raise were issued at an mNAV *below* the 1.30 breakeven point. Selling "cheap" shares to buy bitcoin actually *reduces* BPS. 2. Only $101.3 million of the raised funds were used to buy bitcoin; the rest went to boost the company's dollar reserves. The breakeven mNAV calculation assumes *100%* of proceeds are used for bitcoin purchases. Diverting funds, even if mNAV were high, dilutes BPS. The result is an estimated 0.19% decrease in Bitcoin per share for MSTR holders. In exchange, Strategy merely extended its operational runway for its dollar reserves from ~6.3 months to 7 months. The author interprets this as Strategy prioritizing the survival and development of its STRC business over its stated core goal of increasing MSTR's BPS. This constitutes a gamble: if sacrificing MSTR value leads to improved market sentiment and a recovery in STRC's price (and thus mNAV), the whole system could work. If not, Strategy may be forced into a cycle of further diluting MSTR to stay afloat, potentially leading to deferred STRC dividends or corporate decline. The article concludes with a hope for price recovery for Bitcoin, MSTR, and STRC.

Foresight News25m ago

Saylor's Purchase of 1550 Bitcoin Is a Bad Trade

Foresight News25m ago

The AI Bear Market Lasting Two Days Is Over; Why Did Funds Buy Back Storage Stocks First?

After a severe two-day selloff in early June that erased over $1 trillion from U.S. chip stock market value, capital is flowing back first to the memory sector. The correction was not driven by a collapse in AI demand but rather a market reassessment of high expectations. Stocks like Broadcom faced selling pressure despite strong AI revenue guidance, signaling a shift in focus from who has an "AI story" to who can most rapidly translate AI demand into verifiable profits and earnings per share (EPS). Memory companies, such as Micron and SK Hynix, are leading the recovery because their EPS growth is more immediately verifiable. The AI server boom directly increases demand for high-bandwidth memory (HBM) and high-capacity server DRAM, tightening supply and driving up contract prices for conventional DRAM and NAND Flash. This price increase, coupled with a shift to higher-margin products, flows directly into near-term revenue and profitability, as evidenced in recent earnings reports. In contrast, other AI semiconductor segments like GPUs, ASICs, and optical modules, while central to the long-term AI infrastructure story, face longer and less certain paths to EPS validation. Their growth depends more on future product cycles, customer adoption timelines, and capital expenditure plans. The rebound in memory stocks highlights a market preference for assets with shorter, more transparent EPS conversion cycles following the recent de-risking phase. However, this does not negate the potential of other AI hardware segments should they provide clearer near-term order visibility. The episode has raised the validation bar for all AI-related investments.

marsbit26m ago

The AI Bear Market Lasting Two Days Is Over; Why Did Funds Buy Back Storage Stocks First?

marsbit26m ago

Trading

Spot
Futures
活动图片