GPUs Have No 'Price': Four Indices Clash, the Compute Market Is More Chaotic Than You Think

marsbitPublished on 2026-04-08Last updated on 2026-04-08

Abstract

The GPU compute market lacks a clear price benchmark, with four major indices on Bloomberg Terminal showing significant divergence—differing by over $2 and moving inconsistently. This reveals a fragmented and inefficient market for AI compute power, particularly for H100 and B200 GPUs. While demand surges and supply constraints are real, pricing is highly opaque and varies by contract type, provider, and location. The absence of standardized contracts, reliable benchmarks, and liquid secondary markets leads to hoarding and informal subleasing. Key issues include inconsistent pricing methodologies, unstandardized agreements, quality assurance gaps, and no forward pricing mechanism. Without coordinated improvements in infrastructure and market design, establishing a true price for GPU compute remains impossible.

Author: David Lopez Mateos

Compiled by: Deep Tide TechFlow

Deep Tide Guide: The media likes to summarize the rise and fall of GPU compute prices with a single number, but the reality is: the quotes from four index providers on the Bloomberg terminal diverge by more than $2, with inconsistent directions and rhythms. The author of this article is David Lopez Mateos, founder of the GPU compute trading platform Compute Desk. Using first-hand transaction data, he breaks down the real pricing structure of H100 and B200, revealing a primitive market with no consensus benchmark, no standard contracts, and no forward curve—compute power is being hoarded and sublet like short-term rental apartments.

Media headlines would make you think GPU compute prices are soaring. This narrative is comfortable, perfectly fitting into the macro framework of "supply crunch + bottomless AI demand," and it implies something reassuring: we have a well-functioning market with clear and readable price signals.

But we don't. This narrative is almost entirely built on a single index, and it implies something that shouldn't be implied: the GPU rental market has become efficient enough to be represented by a single number.

The supply crunch is real, but the crunch felt by different people is completely different—depending on who you are, where you are, what contract you're trading, and what compute asset. Faced with this opacity, the market's natural reaction is not orderly price discovery but hoarding: locking in GPU time you might not even need yet, because you're not sure if you can get it at any price next month. Where there is hoarding and no transparent benchmark, fragmented secondary markets emerge. At Compute Desk, we have already facilitated tenants subletting their clusters like apartments during major events. This is not a hypothesis; it is happening.

Indices Do Not Converge

In mature commodity markets, indices built on different methodologies tend to converge. Brent crude and WTI have a few dollars of spread due to geographic location and crude quality, but they move in sync directionally (Figure 1). This convergence is a hallmark of an efficient market.
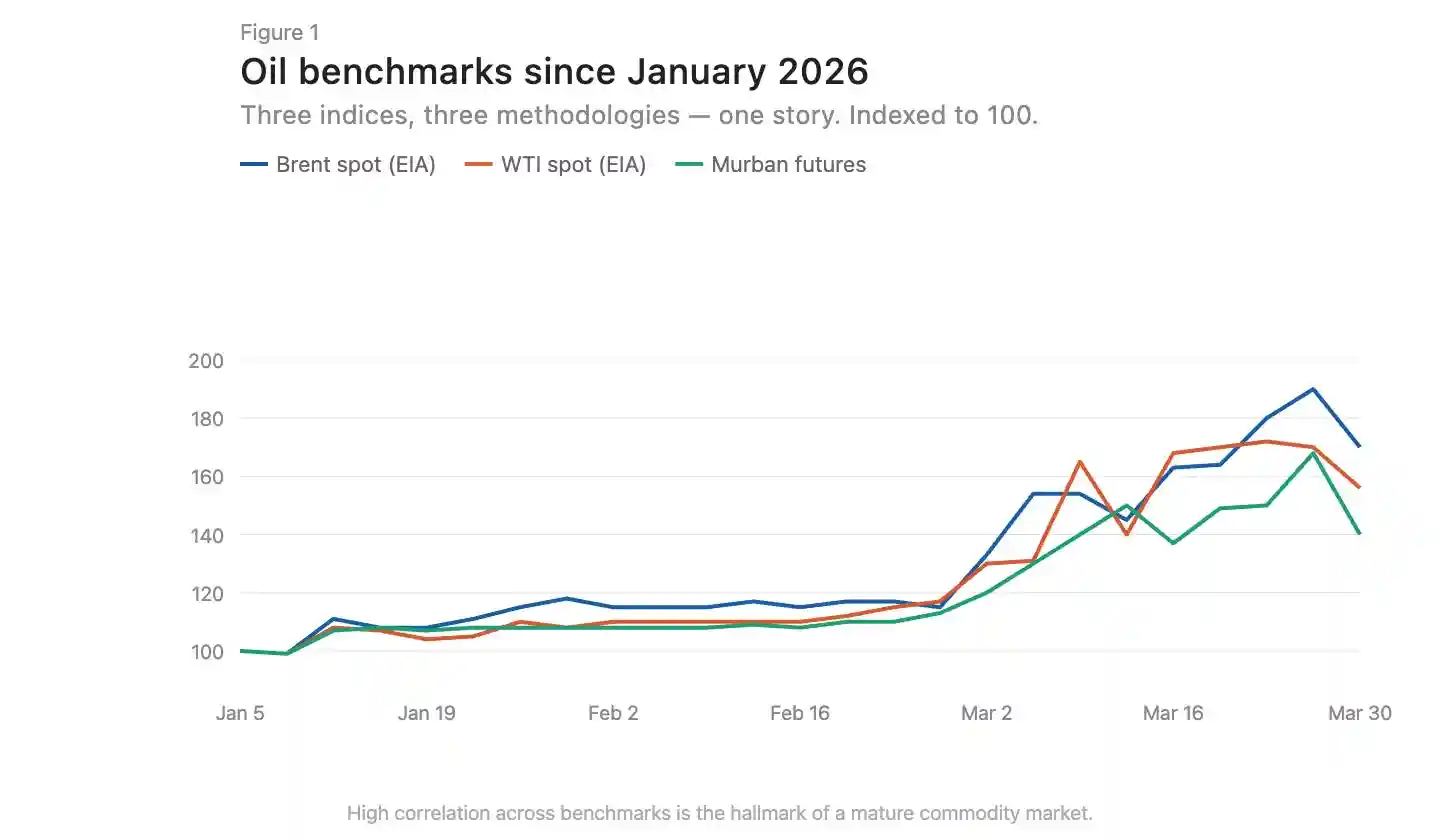
Caption: Comparison of Brent and WTI crude oil price trends, showing high directional alignment

There are now three GPU pricing index providers on the Bloomberg terminal: Silicon Data, Ornn AI, and Compute Desk. SemiAnalysis just released a fourth—a monthly H100 one-year contract price index based on survey data from over 100 market participants. Silicon Data and Ornn publish daily H100 rental indices, Compute Desk aggregates data at the Hopper architecture level, and SemiAnalysis captures negotiated contract prices rather than listed or crawled prices. Different methodologies, different frequencies, different angles of insight into the same market. Overlaying them reveals clear divergence (Figure 2).
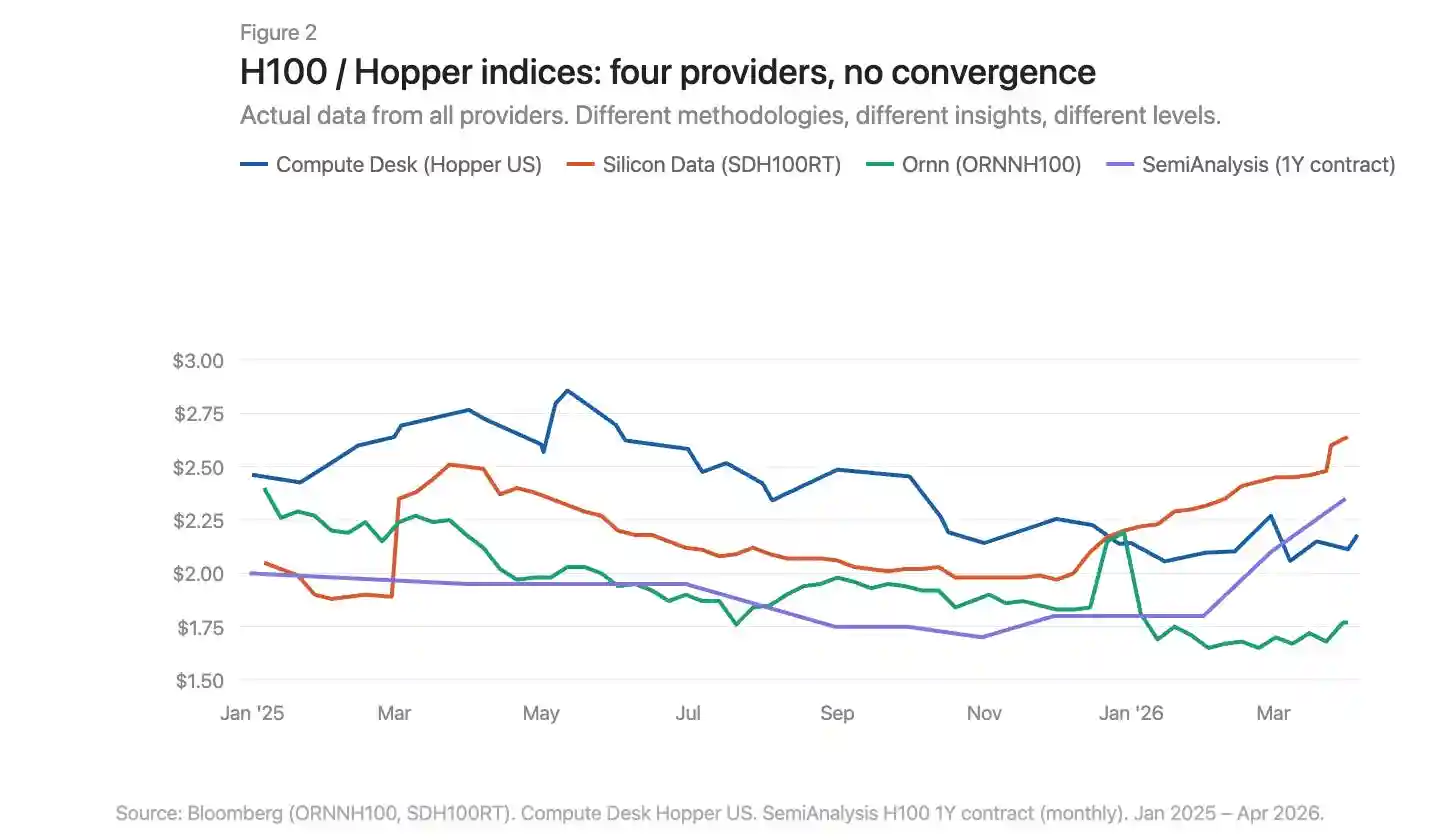
Caption: Overlay comparison of four GPU indices, showing significant divergence in price levels and trends

Where Exactly Is the Price Increase Happening

Using Compute Desk data, we can break down H100 price changes by supplier type and contract structure, and overlay Silicon Data's SDH100RT index (Figure 3). All indicators show prices rising, but the starting points and magnitudes vary greatly depending on the index and contract type.
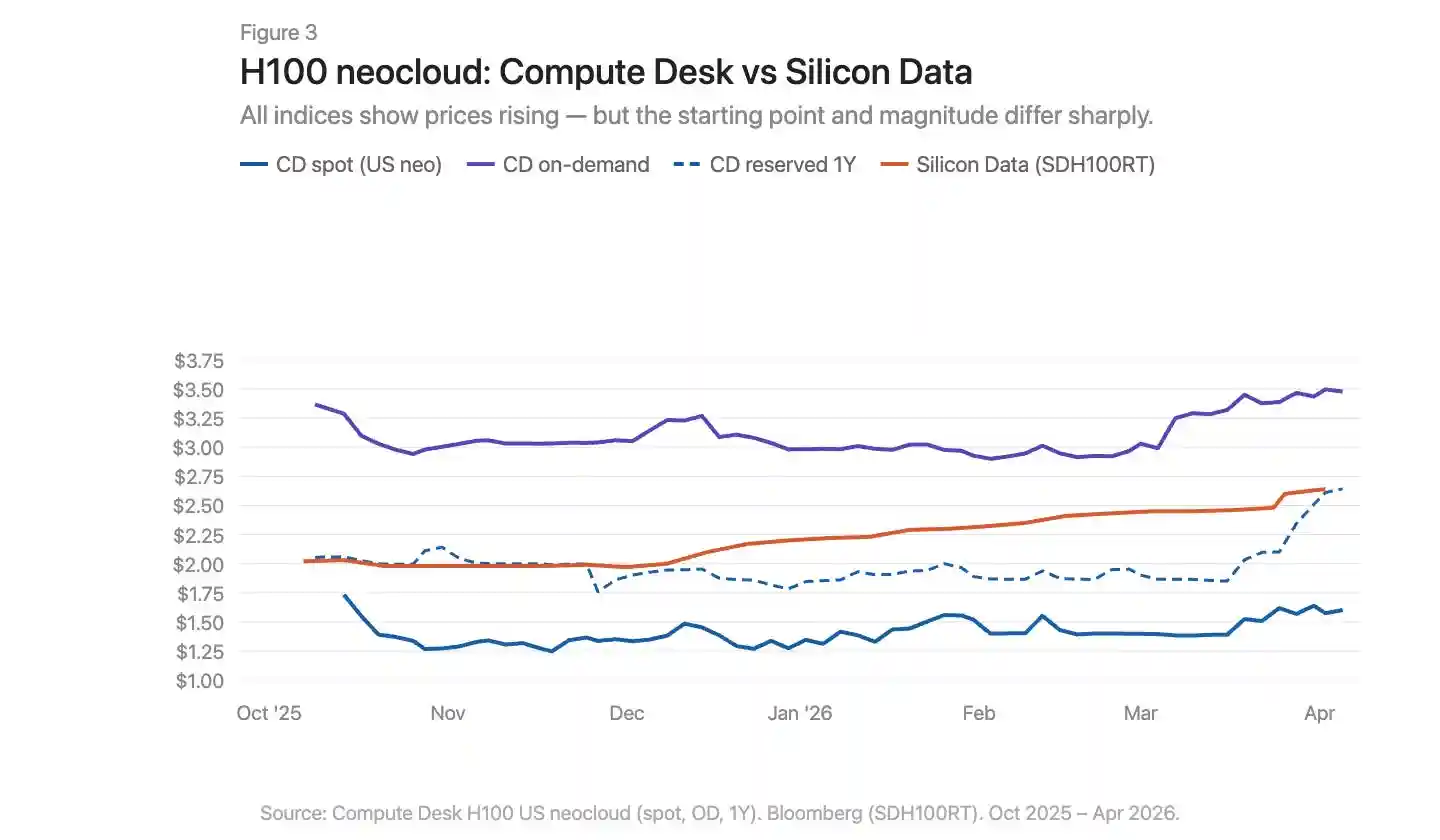
Caption: H100 price trends by contract type overlaid with the SDH100RT index

Compute Desk's H100 neocloud data tells a more specific story than the aggregate index. On-demand pricing was relatively stable throughout the winter, around $3.00/hour, then surged sharply to $3.50 in March. Spot pricing was noisier and lower, with only a slight upward trend until March. Silicon Data's SDH100RT shows a smoother, steady rise, increasing from $2.00 to $2.64 over the same period. The two indices remain at different price levels and describe different time rhythms: Compute Desk shows a March spike, Silicon Data shows a slow climb.

One-year reserved pricing was largely flat until February, then jumped sharply from $1.90 to $2.64 at the end of March—not a gradual catch-up, but a sudden repricing. This looks more like suppliers collectively adjusting contract rates after the on-demand market tightened, rather than a continuous structural demand driver.

The March story for B200 is even more dramatic (Figure 4). Compute Desk's on-demand index exploded from $5.70 to over $8.00 within weeks. Silicon Data's SDB200RT surged from $4.40 to $6.11 before falling back to $5.47. Both indices recorded this move, but the starting points differed by over $2, and the shapes of the rise and fall were different. B200 has less than five months of data, fewer suppliers, and larger spreads; the two indices are viewing the same event through very different lenses.
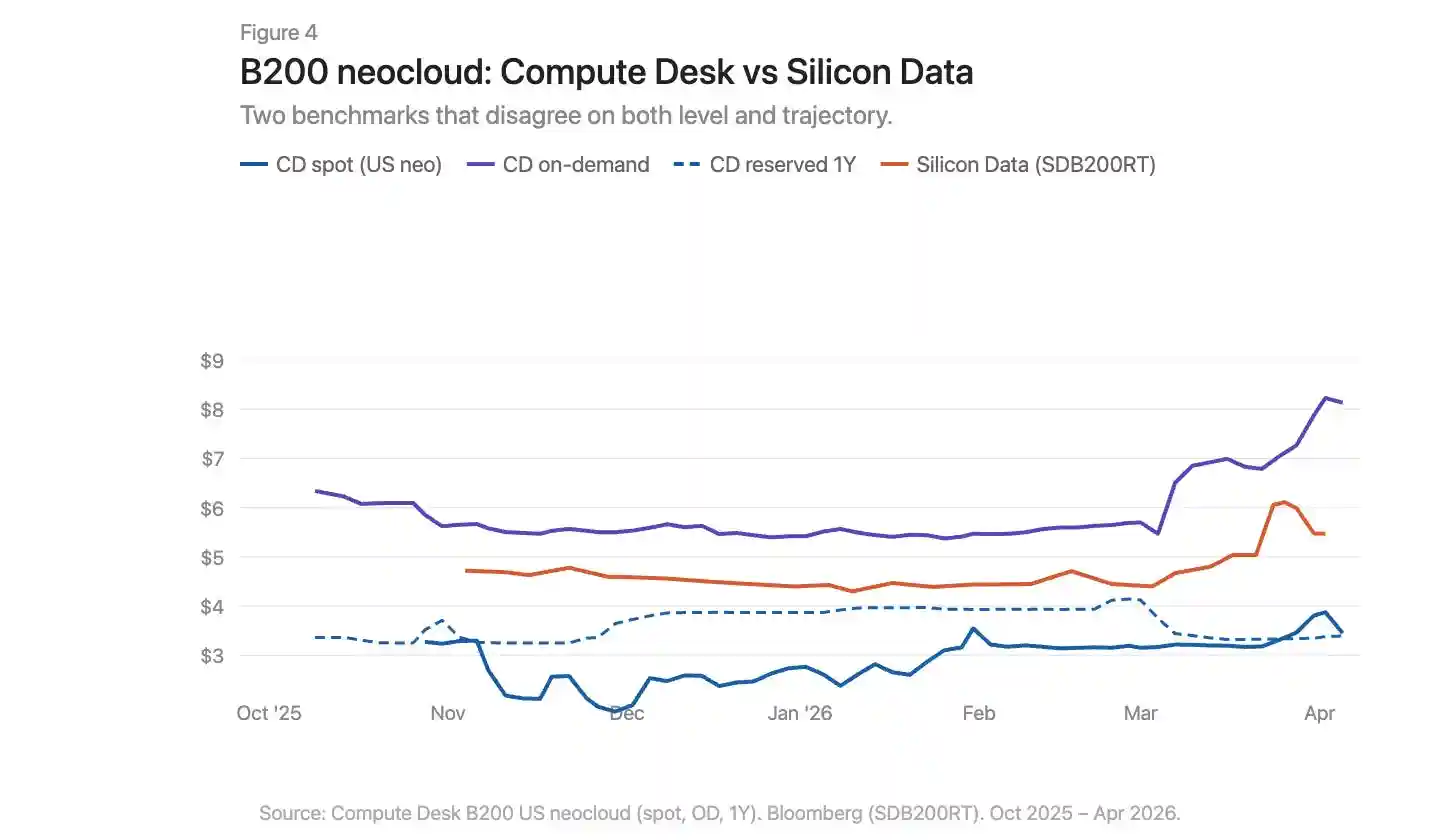
Caption: B200 on-demand and reserved price trends, overlaid with Compute Desk and Silicon Data data

Infrastructure Issues, Not Just Geographic Differences

Commodity markets have basis differentials. Appalachian natural gas is a textbook case: massive reserves sit atop structurally constrained pipeline capacity, with utilization rates in the Pennsylvania-Ohio corridor often exceeding 100%, and new projects like the Borealis Pipeline not coming online until the late 2020s.

The GPU market has a similar situation: an H100 in Virginia and an H100 in Frankfurt are not the same economic good. But geographic differences alone cannot explain why indices measuring the same market diverge so much. The dislocation in the GPU market is deeper than in Appalachian natural gas. The problem with natural gas is a single missing link: pipeline capacity connecting supply and demand. The infrastructure gap in the compute market exists on both the supply and demand sides. Physical infrastructure—the consistent networks, predictable configurations, and predictable availability needed for reliable compute distribution—is not yet mature and sometimes simply doesn't work. Financial infrastructure—standardized contracts that compress spreads despite physical differences, transparent benchmarks, arbitrage mechanisms—also doesn't exist yet.

The data tells one story. The real, painful experience of trying to procure compute in early 2026 tells another. On-demand capacity for all GPU types is virtually sold out. Finding 64 H100s is difficult: Compute Desk shows 90% of suppliers have zero on-demand cluster availability, and the reserved market isn't much better. In a well-functioning market, this level of scarcity would have pushed prices to a new equilibrium. But it hasn't. This suggests suppliers themselves lack real-time pricing intelligence to adjust. Prices are rising, but too slowly to clear the market. The gap between listed prices and true willingness to pay is being filled by hoarding, subletting, and informal secondary market transactions.

What Needs to Change

The current GPU compute market has seven core problems:

No consensus benchmark. Multiple indices coexist with different methodologies and contradictory conclusions.

Aggregate narratives mask structure. A single "H100 price" number masks huge differences between supplier types and contract terms.

Lack of transaction-level data. In bilateral markets, the deviation between listed prices and actual transaction prices is very large.

No contract standardization. Most GPU rentals are bilaterally negotiated with varying terms. Shorter, more standardized contract terms would improve liquidity and price discovery.

No delivery quality guarantee. Interconnect topology, CPU pairing, network stack, and uptime vary enormously. Buyers need to know the quality of the compute they are purchasing before committing.

Contracts lack liquidity. If demand changes during a reservation, options are limited: either eat the cost or sublet informally. The market needs infrastructure to transfer or resell committed compute, allowing capacity to flow to those who need it most.

No forward curve. Without the ability to price forwards, there is no hedging. This is why lenders discount GPU collateral by 40%-50%, keeping financing costs high.

Building a properly functioning market for the most important commodity of the century cannot advance on just one front. Measurement, standardization, contract structure, delivery quality, liquidity—these must advance in sync. Until then, no one can truly say what a GPU hour is worth.


Related Questions

QWhy do the four GPU pricing indices on the Bloomberg terminal show significant discrepancies?

AThe indices differ because they use different methodologies, frequencies, and data sources. Some track daily H100 rental rates, others aggregate data at the Hopper architecture level, and one uses survey-based monthly contract prices. This lack of standardization leads to inconsistent price levels and trends.

QWhat does the divergence between GPU indices indicate about the current state of the compute market?

AThe divergence indicates an inefficient and immature market. Unlike mature commodity markets where indices converge, the GPU market lacks a consensus benchmark, standardized contracts, and transparent pricing, leading to fragmented and unreliable price signals.

QHow did H100 pricing behave across different contract types according to Compute Desk data?

AOn-demand pricing was stable at around $3.00/hour until March, then spiked to $3.50. Spot pricing was lower and noisier, with a slight uptrend in March. One-year reserved pricing was flat until late March, then jumped sharply from $1.90 to $2.64, indicating a sudden repricing rather than gradual demand growth.

QWhat infrastructure gaps are exacerbating the fragmentation in the GPU compute market?

ABoth physical and financial infrastructure are underdeveloped. Physically, inconsistent network reliability, configuration, and availability hinder uniform delivery. Financially, there are no standardized contracts, transparent benchmarks, or arbitrage mechanisms to compress price differences across regions and providers.

QWhat are the core problems preventing the GPU compute market from functioning efficiently?

AKey issues include: no consensus benchmark, aggregated narratives masking structural differences, lack of transaction-level data, absence of contract standardization, unguaranteed delivery quality, illiquid contracts with no resale mechanisms, and no forward curve for hedging or financing.

Related Reads

In Conversation with Ray Dalio: We Are Currently in an AI Bubble, with 1% of My Portfolio in Bitcoin

Ray Dalio, founder of Bridgewater Associates, warns in an interview that the current AI boom shows classic bubble characteristics, which could lead to significant economic downturns as seen in past cycles like 1929 or 2000. He explains that speculative enthusiasm, fueled by debt and overvaluation, often precedes a crash when rising rates or taxation force asset sales, causing widespread losses and recession. Dalio also outlines his "Big Cycle" theory, describing an approximate 80-year pattern where widening wealth gaps, massive government deficits, and shifting geopolitical power (like China's rise) create internal conflict and global instability. He emphasizes that we are in a late-cycle, transitional phase where traditional powers like the US and UK face decline. For personal wealth protection, Dalio advises diversification beyond cash into assets like stocks, bonds, real estate, and particularly gold, which he prefers over Bitcoin. While he holds about 1% of his portfolio in Bitcoin as a non-printable hard asset, he views gold as more secure from technological or governmental threats. Regarding AI's impact, Dalio believes it will disproportionately benefit capital owners, worsening inequality by replacing both physical and cognitive labor. He suggests that human intuition and emotional intelligence, combined with AI, will be key for future workers. On taxation, Dalio argues that wealth taxes are impractical and risk triggering asset sell-offs, reducing productive investment. He points to the UK as a cautionary example of debt, low productivity, and political strife. Geopolitically, Dalio foresees a more regionalized world, with the US showing weakness in prolonged conflicts like with Iran, akin to past imperial declines. The ideal outcome, he suggests, is coexisting powerful blocs (e.g., Americas, China-Asia Pacific) without major war.

marsbit1h ago

In Conversation with Ray Dalio: We Are Currently in an AI Bubble, with 1% of My Portfolio in Bitcoin

marsbit1h ago

Daily 7.2 Trillion KRW: Foreign Capital's Record Net Buying on Friday! Wall Street Says Headwinds for Korean Stock Fund Flows Have Subsided

South Korean stock market sees a dramatic shift in fund flows. On July 31, foreign investors made a record net purchase of approximately KRW 7.2 trillion in KOSPI stocks, marking a fundamental reversal from the persistent large-scale net outflows seen in previous months. This contributed to a significant narrowing of foreign net selling in July to KRW 9.8 trillion, down sharply from KRW 48.4 trillion in June and KRW 44.5 trillion in May. Simultaneously, domestic institutional pressure eased. South Korean pension funds and asset managers turned to a net buying position in July, purchasing KRW 1.0 trillion worth of KOSPI shares, contrasting with net sales in May and June. Market volatility is expected to be dampened by new financial regulations. Effective July 31, the Financial Services Commission tightened access for retail investors to single-stock leveraged ETFs by raising the minimum cash deposit requirement. Trading volumes for these products subsequently dropped to about 50% of their monthly average. Citigroup Research maintains its year-end KOSPI target of 10,000 points. The firm cites several supportive factors: the substantial easing of headwinds from capital outflows, a robust fundamental outlook for the semiconductor sector, historically low market valuations, strong economic fundamentals, and the potential for policy support from financial authorities if needed.

marsbit1h ago

Daily 7.2 Trillion KRW: Foreign Capital's Record Net Buying on Friday! Wall Street Says Headwinds for Korean Stock Fund Flows Have Subsided

marsbit1h ago

Thanks to Dice Rolls, Bitcoin Keys Are Stored Offline, But Not Everyone Will Do It

The article discusses using dice rolls to generate secure Bitcoin wallet seeds, providing entropy independent of potentially flawed hardware random number generators. It explains that each fair dice roll offers about 2.585 bits of entropy, with around 50 rolls needed for a standard 12-word seed phrase and 99+ recommended for higher security. This method gained attention after a vulnerability was revealed in some Coldcard hardware wallets, where a faulty firmware RNG (dating back to 2021) compromised generated keys. The analysis notes that while a dice-generated main seed was safe from this specific flaw, other Coldcard functions (like creating paper wallets, backup keys, or passwords) could still be vulnerable if they used the defective RNG. The piece argues that while dice-based entropy is technically robust, the manual process is error-prone, tedious, and unrealistic for most new users, who might make mistakes in recording or inputting rolls. It concludes that while manual entropy generation should remain an option for advanced users, the long-term goal is to develop reliable, user-friendly hardware and software that securely generates randomness without requiring specialized knowledge. Coldcard users are advised to check their firmware version and replace any secondary secrets (like paper wallet keys) created with vulnerable devices, while also considering multi-signature setups with devices from different manufacturers for added security.

cryptonews.ru6h ago

Thanks to Dice Rolls, Bitcoin Keys Are Stored Offline, But Not Everyone Will Do It

cryptonews.ru6h ago

Trading

Spot
活动图片




