Goldman Sachs Research Report Analysis: 135% Profit Growth in Q2, APAC Valuations Fall to a Decade Low

marsbitPublished on 2026-08-24Last updated on 2026-08-24

Abstract

Goldman Sachs Asia Pacific Market Report Summary (Aug 21, 2026) Earnings soared 135% YoY in Q2 for the MXAPJ index, with 46% of companies beating expectations, led by the Information Technology sector (+390% YoY). Despite this robust profit growth, the index's forward P/E of 11x sits 2 standard deviations below its 10-year average, indicating deep valuation discount. Market sentiment remains cautious, as seen in hedge fund leverage for Asian long/short funds dropping to a one-year low. While China saw net buying in August, its allocation remains near five-year lows, and foreign investors withdrew $1.5bn from EM Asia ex-China markets. The valuation gap is attributed to market pessimism on future growth, not aligning with consensus EPS growth forecasts of 71% for 2026 and 24% for 2027. The upcoming MSCI index rebalancing is expected to trigger approximately $42bn in total two-way passive fund flows. Leveraged ETF flows in Korea and Taiwan show signs of cooling, suggesting a reduction in crowded long positions. Goldman Sachs' core trades include long positions in stocks with strong earnings revisions and AI infrastructure/semiconductors. Key downside risks are rising long-term US bond yields, heightened geopolitical tensions, and a slower-than-expected Chinese economic recovery. The firm maintains a 12-month target of 1080 for MXAPJ, implying 21% upside.

Written by: Rita

On August 21, Goldman Sachs released its weekly report on the APAC markets. The MXAPJ index rose 1% for the week, Hong Kong stocks gained 4%, offshore China equities were up 3%, while Taiwan's market fell 2%. Foreign capital outflows from EM Asia ex-China markets totaled $1.5 billion, and the yield on the 30-year U.S. Treasury bond rose to its highest level since 2007. The MXAPJ index currently stands at 891 points. Goldman Sachs sets a 12-month target price of 1080 points, implying 21% upside, with total return expectations including dividends around 24%.

Earnings growth is the fundamental support for valuation recovery. For Q2, 84% of MXAPJ constituent companies have disclosed earnings, showing net profit growth of 135% year-on-year and 52% quarter-on-quarter. 46% exceeded expectations, with a median earnings surprise of 4.3%. The Information Technology sector led the gains, with profits up 390% year-on-year. On the valuation front, the MXAPJ forward P/E ratio is 11x, which is 2 standard deviations below its 10-year average.

Hedge Fund Leverage Falls to One-Year Low

Data from Goldman Sachs Prime Brokerage shows that since August, the total leverage ratio for Asian fundamental long/short funds has plunged by 14.5 percentage points to 181%, the lowest in over a year, placing it at the 43rd percentile of its five-year history. The net leverage ratio remains at 59.3%, at the 59th percentile of its one-year range and the 82nd percentile of its five-year range.

In terms of regional allocation, Asia's net allocation ratio remained flat this month at 28.5%, representing an 11.7 percentage point overweight relative to the MSCI World Index. South Korea and Japan were the markets with the highest net selling, followed by Taiwan, while China saw net buying. Year-to-date, Japan is the only market with net buying, while South Korea has seen the most net selling.

Buying intensity in the Chinese market strengthened in August. A-shares and H-shares were the main drivers of purchases, with A-shares also contributing significantly to deleveraging. Despite recent sustained buying, the net allocation ratio for Chinese stocks remains near its lowest levels of the past five years.

Earnings Surge and Capital Outflow Proceed in Parallel

MXAPJ's Q2 net profit grew 135% year-on-year and 52% quarter-on-quarter. The Information Technology sector contributed the most, with a 390% year-on-year and 68% quarter-on-quarter increase, and net margins expanding by 21 percentage points. Healthcare, Materials, and Energy sectors also showed strong performance.

In the Taiwan market, 99% of companies have reported earnings, with net profit up 131% year-on-year and 54% quarter-on-quarter, boasting the highest proportion of beats. Singapore and Taiwan had the highest number of companies beating estimates, while Australia and India had the fewest. By sector, beats were most concentrated in Energy, Materials, and Information Technology, and least frequent in Real Estate, Communication Services, and Healthcare.

Capital flows moved in the opposite direction. EPFR data shows that in July, Asian funds reduced allocations to Taiwan, Hong Kong, China, and India, while increasing positions in South Korea and ASEAN. Foreign capital outflows from EM Asia ex-China markets amounted to $1.5 billion, with South Korea seeing $1.6 billion in outflows.

Valuation Discount Implies Recovery Potential

The MXAPJ forward P/E ratio is 11x, 2 standard deviations below its 10-year average. South Korea is only at 5.2x, 2.7 standard deviations below; China is at 10.8x, 0.5 standard deviations below; Taiwan is at 18.8x, 1.6 standard deviations above.

The root of the discount lies in earnings expectations not being fully priced in. Market consensus expects MXAPJ EPS growth of 71% in 2026 and 24% in 2027, yet current valuations only price in a pessimistic scenario of slowing growth. Once the earnings season confirms the resilience of profits, a valuation recovery is only a matter of time.

MSCI Rebalancing to Trigger $42 Billion in Fund Flows
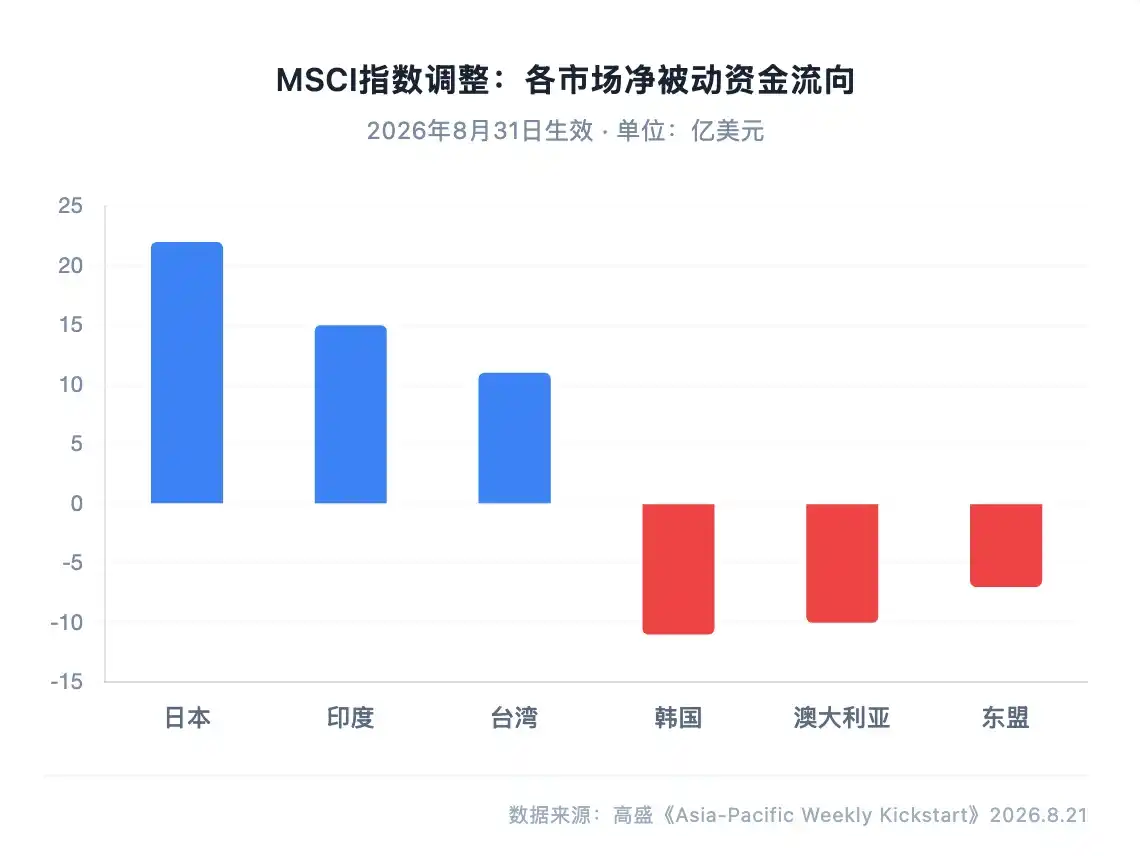
MSCI will adjust its index benchmarks after the close on August 31. The rebalancing of core APAC indices is expected to trigger $34 billion in two-way passive fund flows. Combined with $8 billion from non-core indices (Factor, ESG, Custom indices), total two-way flows are estimated at approximately $42 billion.

Regarding net inflows, Japan is expected to see $2.2 billion, India $1.5 billion, and Taiwan $1.1 billion. For net outflows, South Korea is expected to see $1.1 billion, Australia $1 billion, and ASEAN $700 million. Goldman Sachs has calculated the potential impact of passive funds at the individual stock level, listing the top 20 stocks likely to see the largest net buying and net selling. The adjustment window may amplify volatility towards the month-end.

Leveraged Capital is Retreating

The assets under management (AUM) of leveraged ETFs in South Korea have rebounded from a low of $16 billion to $25 billion, primarily driven by asset returns, with no new inflows. Since late July, these ETFs have seen persistent, modest outflows. Current leveraged positions equate to 1.8% of the market's free-float market capitalization.

The AUM of leveraged ETFs in Taiwan remains near its historical high of around $13 billion, equivalent to 0.7% of the free-float market cap. Since August, profit-taking has led to outflows of approximately $1 billion. The retreat of leveraged capital suggests that previously crowded long positions are being unwound, reducing structural downside risks for the markets.

Goldman Sachs Issues Overweight and Underweight Lists

Sector Allocation: Overweight Capital Goods, Australian and Chinese Banks, Healthcare, Energy, Tech Hardware & Semiconductors, Insurance. Underweight Automobiles, Chemicals & Other Materials, Software & Services, Transportation, Internet, Utilities, Metals & Mining, Real Estate, Retail Durables, Telecom Services.

Core Trade Recommendations: Go long on the basket with Strong Earnings Revisions (launched July 2021, cumulative return 334%). Go long on AI Infrastructure Hardware & Semiconductors (launched June 2023, cumulative return 63%).

Downside Risks encompass three areas: Sustained rise in long-term U.S. Treasury yields putting pressure on valuations, escalation of geopolitical risks, and China's economic recovery falling short of expectations. Goldman Sachs' Geopolitical Risk Index and the GSSRUSCN indicator for U.S.-China relations have both risen recently and require continued monitoring.

Disclaimer

This article is a translation and interpretation by Chaoxiang Research of a third-party brokerage research report (Goldman Sachs, August 21, 2026), combined with a synthesis of publicly available market information. The ratings, target prices, earnings forecasts, and related judgments cited in the text are the views of the report's analysts, representing only the stance of their respective institutions. They do not represent the views of Chaoxiang Research and do not constitute any investment advice.

The market carries risks, and investment decisions must be made independently. This article should not be used as the basis for trading any securities.


Related Questions

QAccording to Goldman Sachs, what was the year-over-year profit growth for MXAPJ in Q2, and which sector contributed the most?

AThe MSCI Asia Pacific ex-Japan (MXAPJ) index reported a year-over-year profit growth of 135% in Q2. The Information Technology sector was the largest contributor, with a profit increase of 390%.

QWhat does Goldman Sachs report about the current valuation of the MXAPJ index compared to its 10-year average?

AThe forward P/E of the MXAPJ index is 11 times, which is 2 standard deviations below its 10-year average, indicating a significant valuation discount to historical levels.

QWhat trend did Goldman Sachs' prime brokerage data show regarding the leverage of hedge funds in Asia in August?

AIn August, the total leverage of fundamental long/short funds in Asia plunged by 14.5 percentage points to 181%, the lowest level in over a year, according to Goldman Sachs' prime brokerage data.

QWhich region is expected to see the largest net inflow and net outflow of passive funds triggered by the MSCI index rebalancing on August 31st, according to Goldman Sachs?

AAccording to Goldman Sachs, Japan is expected to see the largest net inflow of approximately $2.2 billion, while Korea is expected to see the largest net outflow of approximately $1.1 billion due to the MSCI index rebalancing.

QWhat are the three key downside risks mentioned in the Goldman Sachs report for the Asia Pacific market?

AThe three key downside risks mentioned are: 1) Sustained rise in US long-term bond yields putting pressure on valuations, 2) Escalation of geopolitical risks, and 3) China's economic recovery falling short of expectations.

Related Reads

Mass Production Timelines Shift Collectively, Is Glass Substrate Facing Its First Major Test?

The article discusses the shift in the glass substrate industry from initial announcements to practical delivery and reliability testing. In mid-to-late 2026, key developments include Intel and Lens Technology advancing AI-era glass substrate packaging cooperation, Avaco launching a TGV pilot line in South Korea, and reports that Samsung Electro-Mechanics is facing delays, potentially pushing mass production beyond 2028. The core challenge has moved from material comparisons to rigorous customer reliability certifications, focusing on thermal cycling, humidity resistance, and stable electrical performance post-processing. Samsung Electro-Mechanics' reported delay, linked to client sample reliability bottlenecks, reflects a broader industry trend where timelines are being adjusted. Other players like SKC/Absolics, LG Innotek, and DNP are also targeting initial supply systems or pilot lines between 2027-2028, with mainstream adoption potentially post-2030. The delays highlight that the current hurdle is supply-side technical maturity—particularly achieving stable yields and passing client certifications—rather than a lack of demand driven by AI and HPC. The collaboration between Intel and Lens Technology focuses on establishing design and verification standards. Meanwhile, Japanese firms like Shinko Electric and DNP are progressing with multi-layer wiring and stress control. Chinese panel makers, led by BOE, are rapidly entering with automated pilot lines and customer testing. On the material side, companies like Corning are exploring glass substrates for co-packaged optics (CPO), potentially offering an earlier application path than core substrates. Ultimately, the central barrier is TGV (Through Glass Via) yield, currently around 60-70%, lower than organic substrates, with higher costs due to glass brittleness and process complexity. The industry's current phase represents its first major test in transitioning from lab R&D to volume manufacturing, with success hinging on overcoming these yield and certification challenges.

marsbit8m ago

Mass Production Timelines Shift Collectively, Is Glass Substrate Facing Its First Major Test?

marsbit8m ago

Crypto Bull Is Back, Which Assets Bounced the Hardest?

The cryptocurrency market experienced a significant surge last week, with Bitcoin rallying over 26% to nearly $79,500, its strongest weekly gain since March 2023, fueling discussions of a renewed bull market. This rebound highlighted several key market dynamics. First, short-term directional shifts are increasingly tied to U.S. policy cycles. The rally was driven by two major catalysts: the U.S. Treasury's announcement to increase long-term bond buybacks, easing macro liquidity pressures, and former President Trump's push for clearer crypto legislation, boosting regulatory certainty and risk appetite. Second, Bitcoin spot ETFs solidified their role as a leading market indicator. In the week ending August 21, U.S. Bitcoin and Ethereum spot ETFs saw a combined net inflow of $2.6 billion, the highest since October 2025, signaling strong institutional re-entry. Third, the rally followed a clear capital rotation pattern: Bitcoin's breakout ignited broader gains, with Ethereum (up nearly 30%), major altcoins, and meme coins sequentially posting larger percentage increases. Analysis of the top performers among the top 50 altcoins by market cap revealed the week's biggest gainers: ENA (Ethena) led with a 100.75% surge, fueled by a Coinbase partnership. It was followed by PUMP (Pump.fun, up 88-99%), STX (Stacks, up 82-94%), TRUMP (Official Trump, up 79-91%), and ZEC (Zcash, up 75.15%), which uniquely reached a new all-time high. Meme coins like BOME on Solana also saw explosive gains, exemplifying the high-risk, high-reward sentiment. The rally illustrated a clear path: Bitcoin set the stage, major coins like Ethereum led the charge, and altcoins/meme coins delivered the most explosive returns, mapping the gradient of returning market enthusiasm.

marsbit20m ago

Crypto Bull Is Back, Which Assets Bounced the Hardest?

marsbit20m ago

Wuhan is About to Witness Its Largest IPO in History

Wuhan is poised for its largest-ever IPO as Yangtze Memory Technologies Co., Ltd. (YMTC) has officially applied for a listing on the Shanghai Stock Exchange's STAR Market, seeking to raise 33 billion yuan. The domestic leader in 3D NAND flash memory chips completed its IPO辅导 (tutoring) process in a record three months, with market expectations valuing the company at 300 billion yuan or higher. YMTC's roots trace back to 2006 with the founding of Wuhan Xinxin. After surviving the global financial crisis and periods of operational difficulty, the company was formally established in 2016 through a joint investment involving Tsinghua Unigroup, the National Integrated Circuit Industry Investment Fund (the "Big Fund"), and local Hubei government funds. With a distinct "national team" background, its major shareholders include provincial and municipal state-owned assets committees and the Big Fund. Based in Wuhan's Optics Valley (East Lake High-tech Development Zone), YMTC's potential listing highlights the region's rise as a tech hub. Optics Valley is already home to 72 listed companies and has ambitious plans to exceed 100 by 2030. The zone recently established four industry-focused母基金 (mother funds) totaling 18 billion yuan to further boost sectors like integrated circuits and optoelectronics. YMTC's IPO would complete the "Optics Valley Seven Stars," a group of leading local optoelectronic and communication giants.

marsbit20m ago

Wuhan is About to Witness Its Largest IPO in History

marsbit20m ago

Banks and Regulators Join Pilot Project to Test Quantum-Resistant Crypto Transfers

Banks and financial regulators from Europe, the Middle East, and Asia have joined a pilot project to test quantum-resistant crypto infrastructure for digital asset wallets and on-chain transactions. The initiative, announced by the Responsible Fintech Institute and infrastructure provider Safeheron, will use NEAR's quantum-resistant testnet. It will employ the ML-DSA-65 post-quantum digital signature standard, recently finalized by the U.S. National Institute of Standards and Technology (NIST). Participating regulators include the Abu Dhabi Global Market, Bhutan's Gelphu Financial Services Authority, and Malta's Financial Services Authority. Financial institutions involved are Bison Bank and DK Bank. In the pilot, banks will test wallet creation and transactions in a unified application environment, while regulators will initially observe and later contribute to governance mechanisms. The organizers plan to publish a technical paper detailing the research, protocol design, and test results, eventually open-sourcing the core technology. This effort comes as financial authorities prepare for the advent of quantum computers, which threaten current public-key cryptography. For instance, the Hong Kong Monetary Authority aims for the territory's banking sector to be fully prepared for quantum-related security risks by 2030. The Bank for International Settlements (BIS) also recommended in a 2025 document that financial institutions begin a coordinated, phased transition to post-quantum systems.

cryptonews.ru22m ago

Banks and Regulators Join Pilot Project to Test Quantum-Resistant Crypto Transfers

cryptonews.ru22m ago

Trading

Spot
活动图片