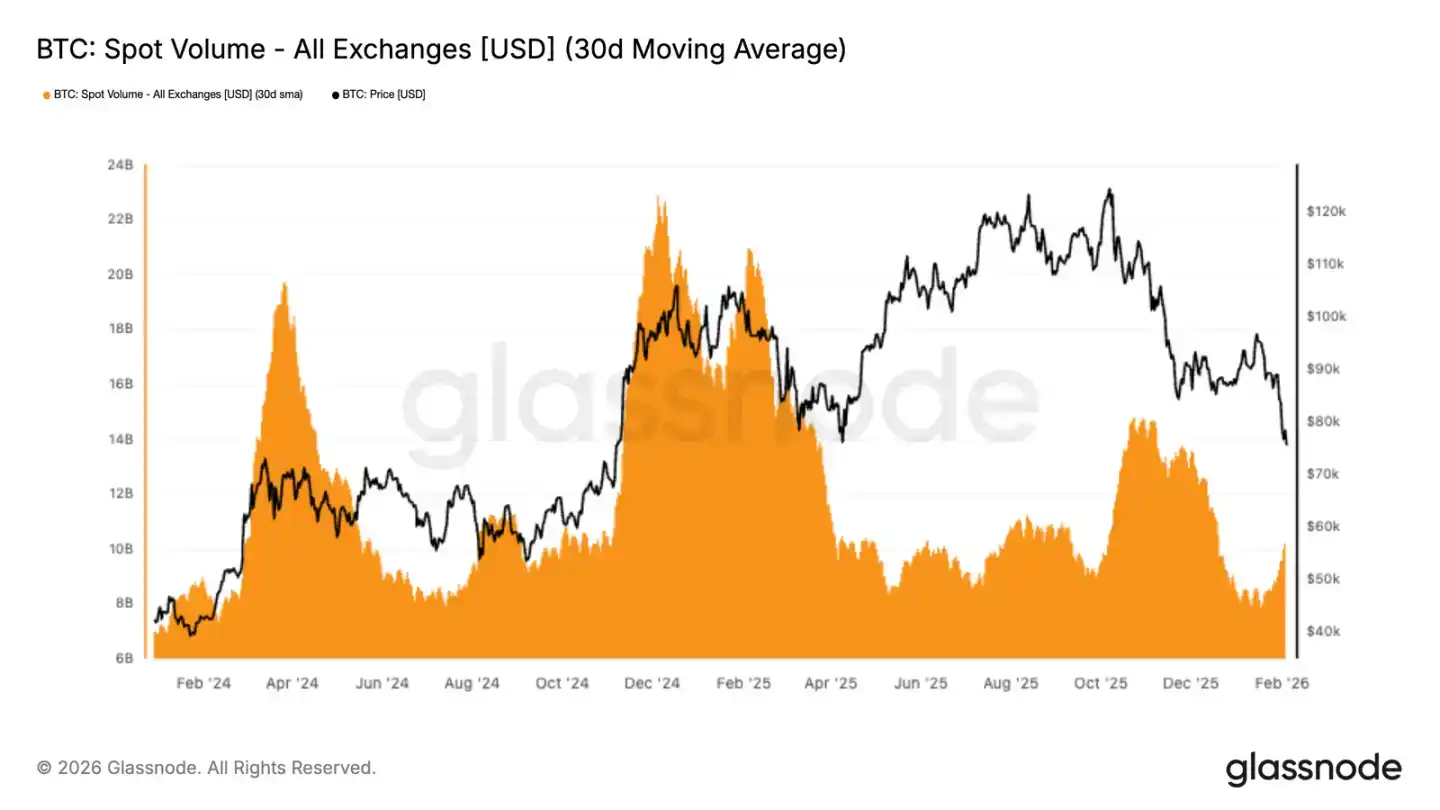
Bitcoin spot trading volume remains sluggish. Despite the price dropping from $98,000 to $72,000, the 30-day average trading volume is still weak. This reflects insufficient market demand and a failure to effectively absorb selling pressure.
Core Views
· Bitcoin has confirmed a breakdown, with the price falling below the true market mean, shifting market sentiment to cautious defense.
· On-chain data shows initial accumulation signs in the $70,000 to $80,000 range, while a dense cost-basis concentration zone has formed between $66,900 and $70,600, which could act as a short-term buffer against selling pressure.
· Investor loss-selling has intensified. As the price continues to decline, more holders are being forced to liquidate their positions to stop losses.
· Spot trading volume remains persistently weak, further indicating insufficient market absorption and a lack of effective digestion of sell orders.
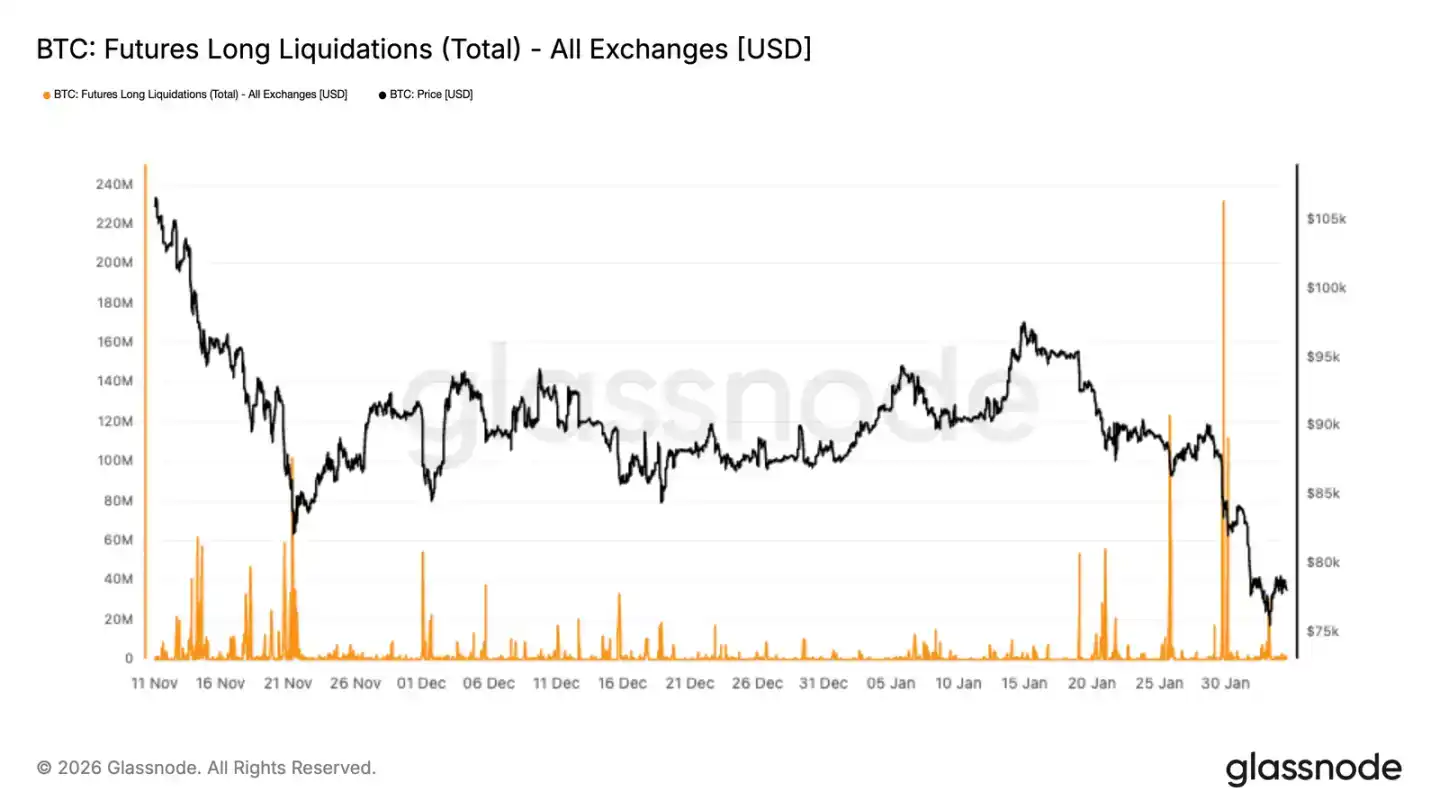
· The futures market has entered a forced deleveraging phase, with large-scale long liquidations exacerbating market volatility and downward pressure.
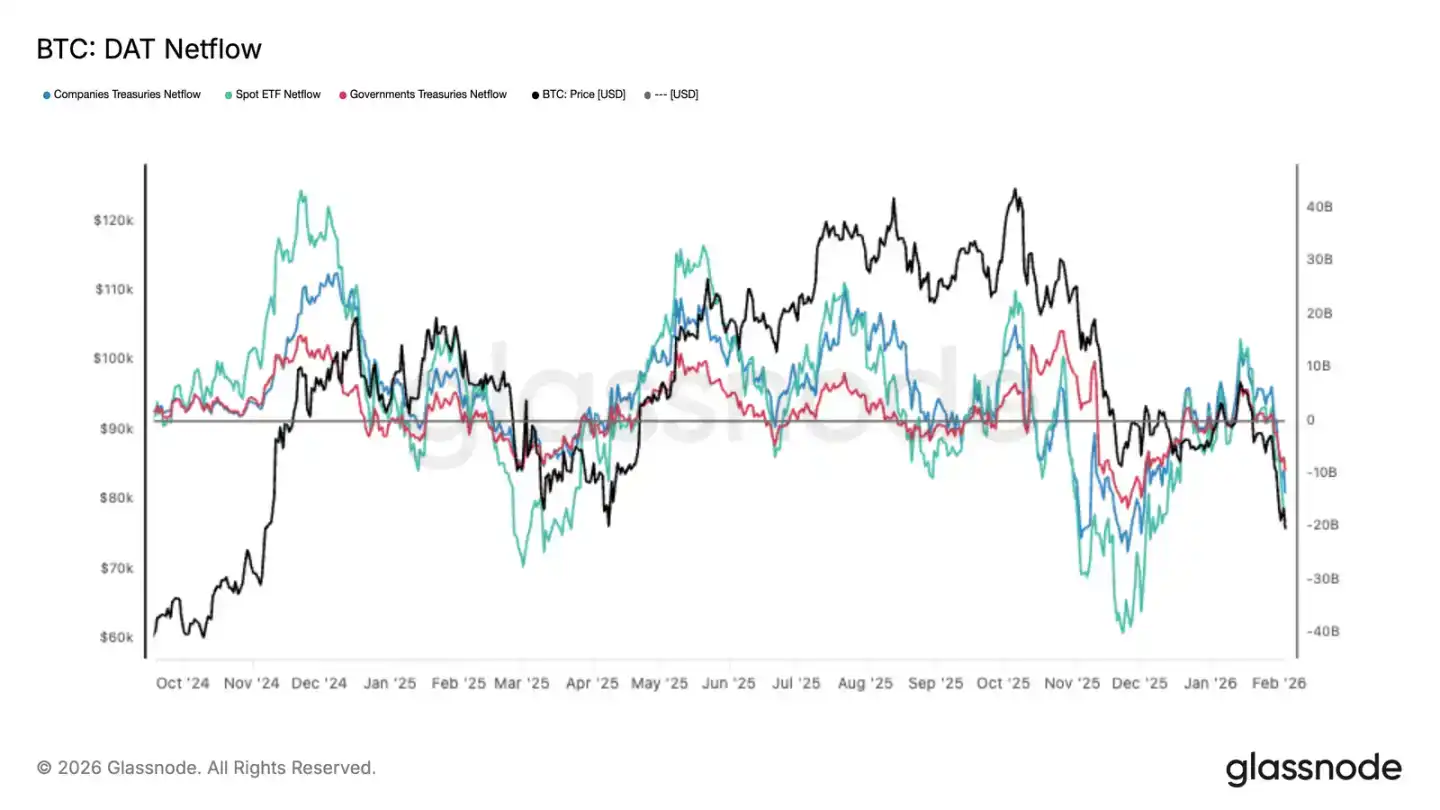
· Institutional capital inflows have significantly weakened. Net inflows into ETFs and related funds have shrunk, unable to provide sustained buying support as they did in the previous rally phase.
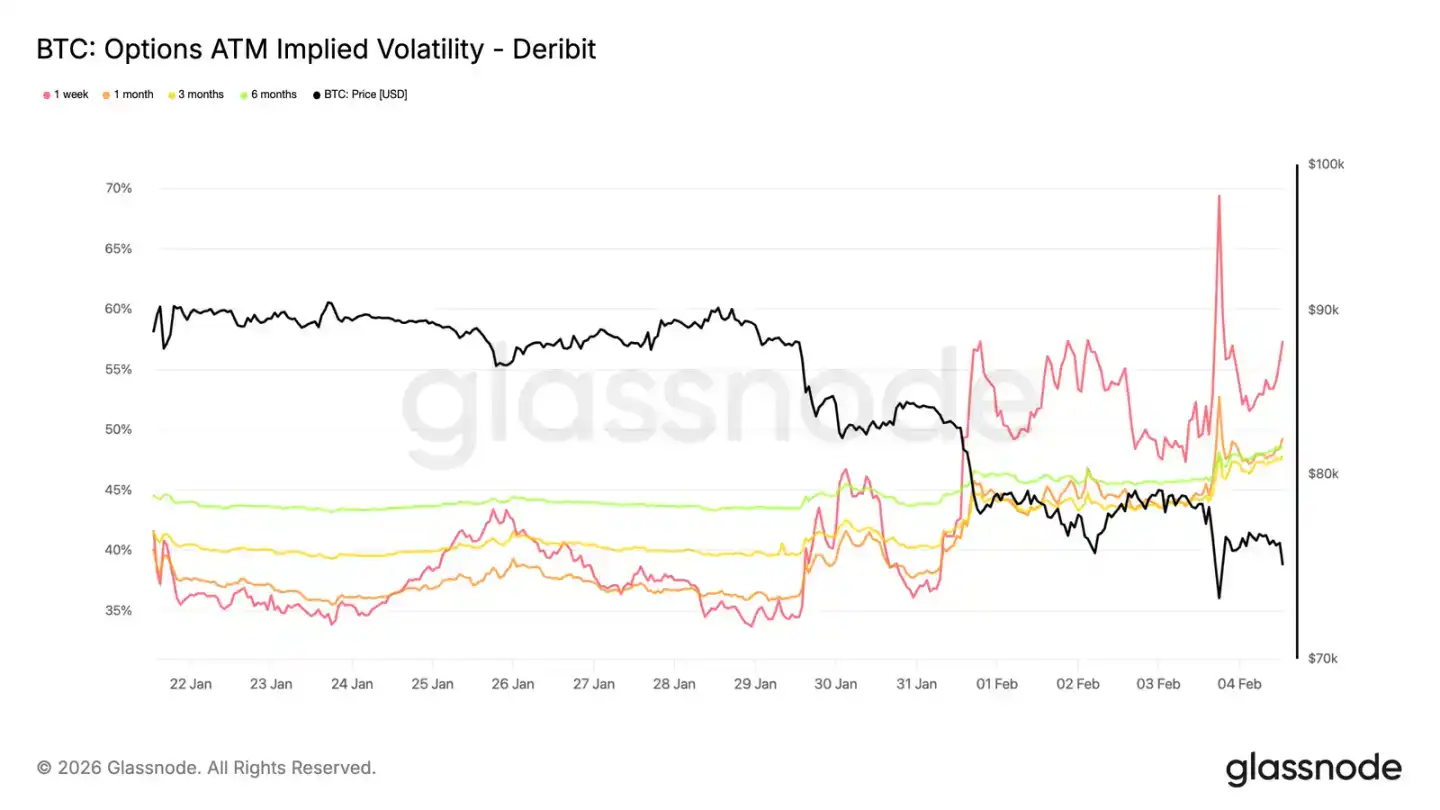
· The options market continues to reflect high expectations of downside risk. Implied volatility remains elevated, and rising demand for put options indicates strong risk-aversion sentiment.
· With market leverage being cleared and spot demand still weak, prices remain fragile. Any rebound is likely to be a technical correction rather than a trend reversal.
On-Chain Data Observations
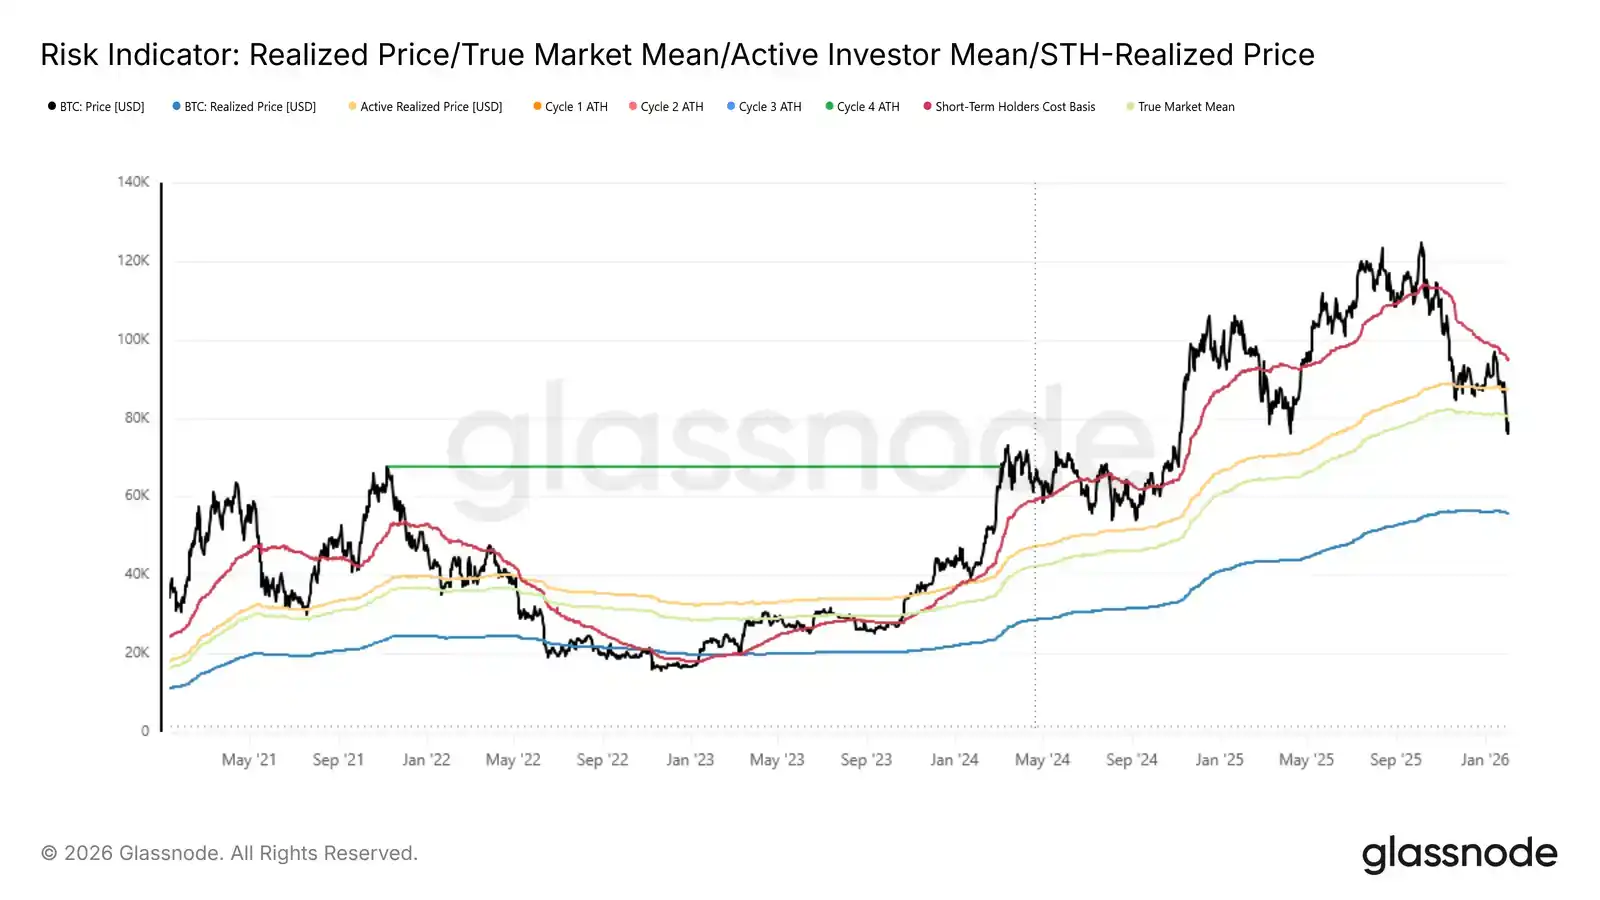
Following last week's analysis, which pointed out the downside risk after the market failed to reclaim the $94,500 short-term holder cost basis, the price has now clearly broken below the true market mean.
Breaking Key Support
The True Market Mean (the average cost basis of active circulating supply, excluding long-dormant tokens) has acted as a key support line during this correction.
The loss of this support confirms the deterioration of market structure since late November. The current setup resembles the phase in early 2022 when the market transitioned from consolidation to a deep correction. Weak demand coupled with persistent selling pressure indicates the market is in a fragile equilibrium.
From a medium-term perspective, the price range is gradually narrowing. Resistance above lies near the True Market Mean around $80,200, while support below is around the Realized Price near $55,800, a level that has historically attracted long-term capital.
Potential Demand Zone Analysis
As the market structure resets, the focus shifts to potential levels for a downside stabilization. The following on-chain metrics help identify zones where a阶段性 bottom might form:
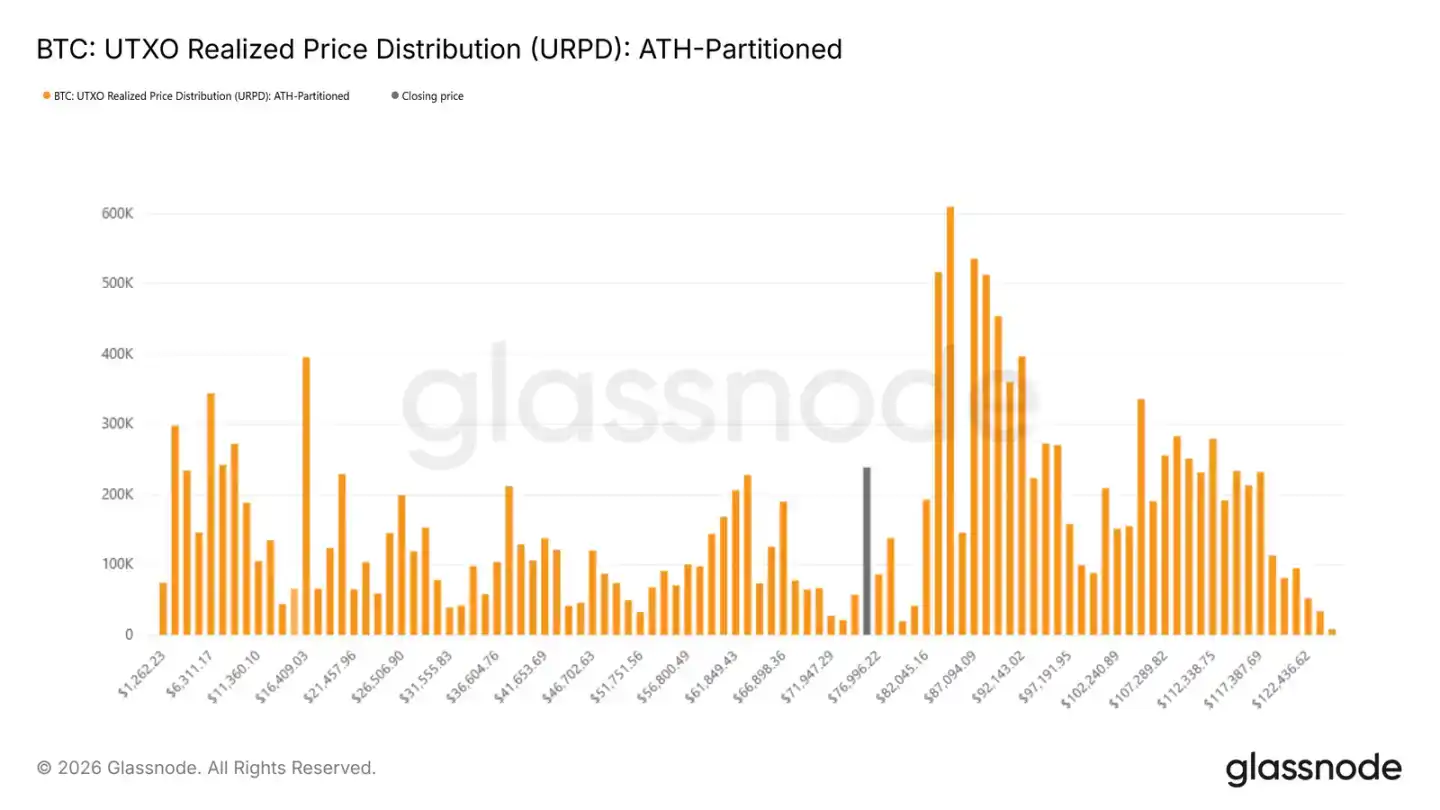
The UTXO Realized Price Distribution shows significant accumulation by new investors in the $70,000 to $80,000 range, indicating a willingness to buy the dip in this zone. Below it, a dense concentration of holdings exists between $66,900 and $70,600. Historically, such cost-basis concentration zones often act as short-term support bands.
Market Stress Indicators
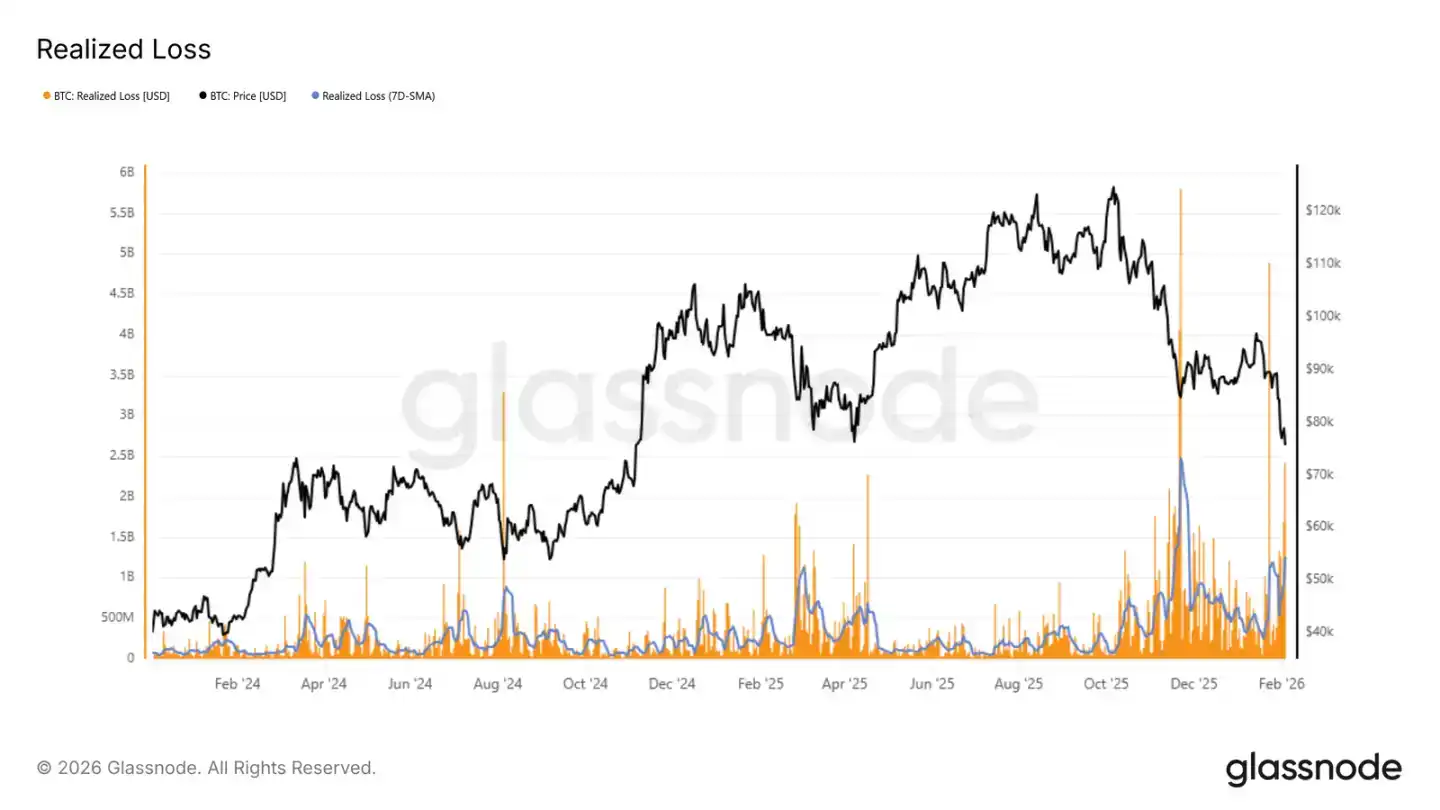
The Realized Loss metric directly reflects the stress level among investors. The current 7-day average Realized Loss has exceeded $1.26 billion daily, showing that panic selling has increased after the market broke below key support.
Historical experience suggests that peaks in Realized Loss often coincide with exhaustion in selling. For example, during the recent bounce from $72,000, daily losses briefly surpassed $2.4 billion. Such extreme values often correspond to short-term inflection points.
Comparison with Historical Cycles
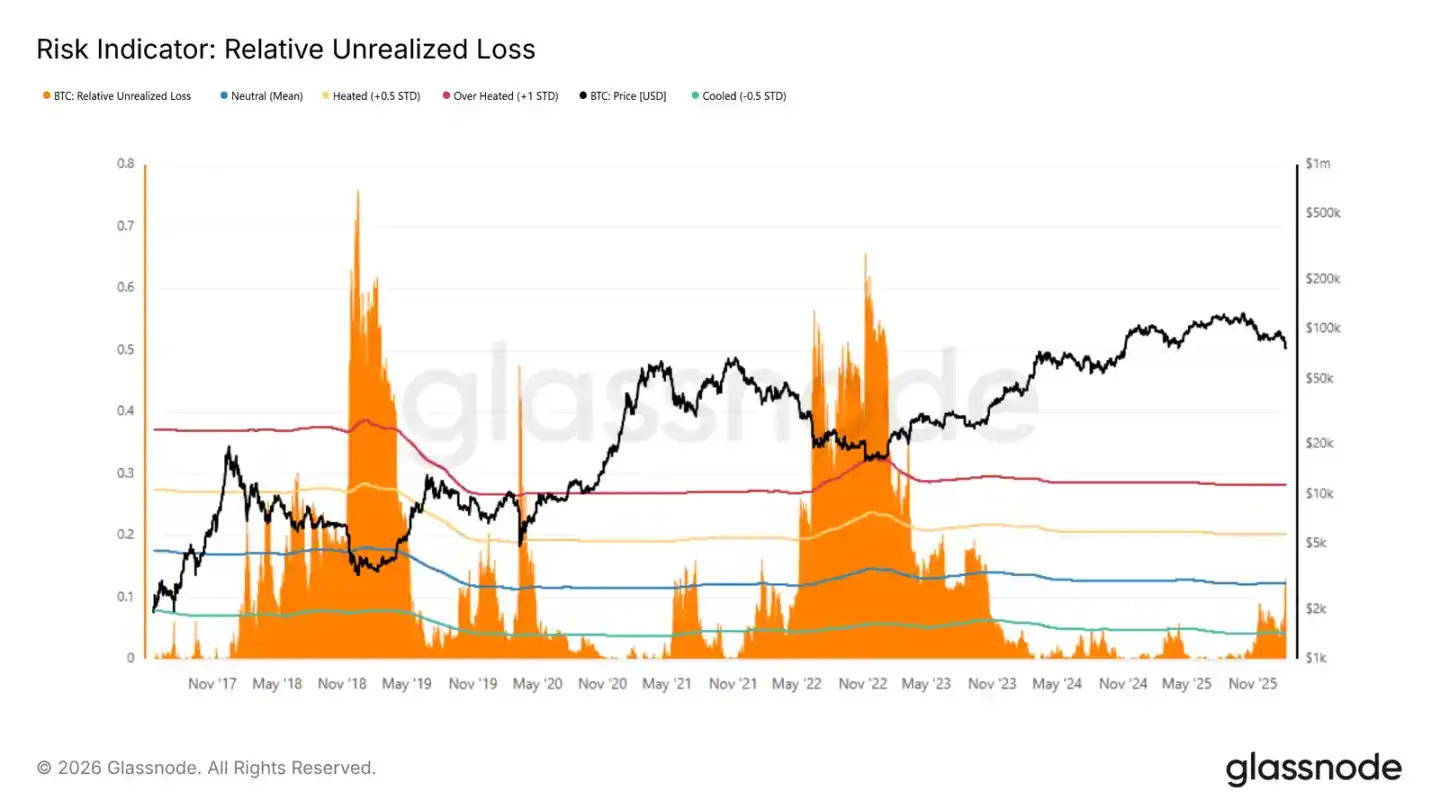
The Relative Unrealized Loss metric (the proportion of unrealized loss to total market cap) helps compare market stress across different cycles. Historical bear market extremes usually exceed 30%, with cycle bottoms in 2018 and 2022 even reaching 65%-75%.
This metric has now risen above its long-term average (approx. 12%), indicating pressure on investors holding coins above the current price. However, reaching historical extreme levels typically requires a systemic risk event on the scale of the LUNA or FTX collapse.
Market Dynamics
Spot and futures trading volumes remain low, while the options market continues to focus on downside protection.
Institutional Flows Turn Net Negative
As prices fell, demand from major institutional investors noticeably weakened. Spot ETF inflows slowed, and corporate and government-related capital also decreased, showing reduced willingness for incremental capital to enter the market.
This contrasts sharply with the previous rally phase, where sustained inflows provided support for price appreciation. The shift in capital flow further confirms the lack of new capital entering the market at current price levels.
Spot Volume Remains Lackluster
Despite the price drop from $98,000 to $72,000, the 30-day average trading volume has not expanded significantly. This indicates a lack of sufficient buying interest to absorb the selling during the decline.
Historically, genuine trend reversals are often accompanied by a significant expansion in spot trading volume. The current volume has only slightly recovered, suggesting market activity is still dominated by position reduction and risk aversion, rather than active accumulation.
Low liquidity makes the market more sensitive to selling pressure, meaning even medium-sized sell orders can trigger relatively large price drops.
Futures Market Forced Liquidations
The derivatives market saw large-scale long liquidations, hitting the highest level since this decline began. This indicates that as prices fell, leveraged long positions were forcibly closed, adding to the downward momentum.
It is worth noting that liquidation activity was relatively moderate during November-December, showing leverage was gradually rebuilding. The recent surge marks the market's entry into a forced deleveraging phase, where forced liquidations become a primary factor influencing price.
Whether prices can stabilize going forward depends on the sufficiency of this deleveraging process. A genuine recovery requires the介入 of spot buying; mere position clearing is unlikely to form a sustained rebound.
Short-Term Volatility Remains Elevated
When the price tested the previous high of $73,000 (now turned support), short-term implied volatility rose to near 70%. Volatility levels have increased by about 20 volatility points compared to two weeks ago, with the entire volatility curve shifting upward.
Short-term implied volatility consistently exceeding recent realized volatility indicates investors are willing to pay a premium for short-term protection. This repricing is particularly evident in near-term contracts, showing risk is concentrated here.
This reflects more a demand for protection against sudden drops rather than a clear directional view. Traders' reluctance to sell short-term options in size keeps the cost of downside protection elevated.
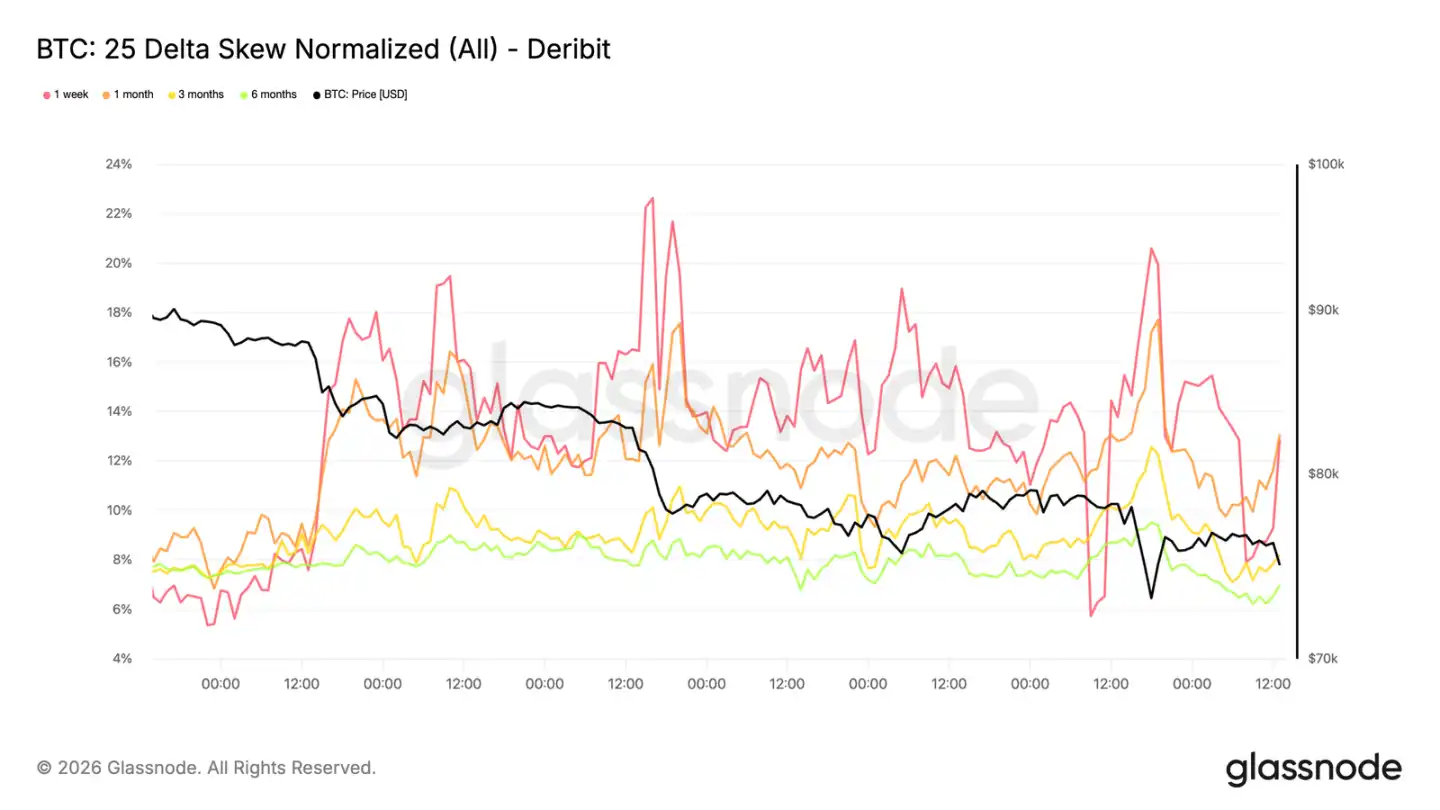
Sustained Increase in Put Option Demand
The volatility repricing shows a clear directional bias. The skew of put options relative to call options has widened again, showing the market is more concerned about downside risk than rebound opportunities.
Even with prices holding above $73,000, option flow remains concentrated in protective positions. This biases the implied volatility distribution negatively, reinforcing the market's defensive tone.
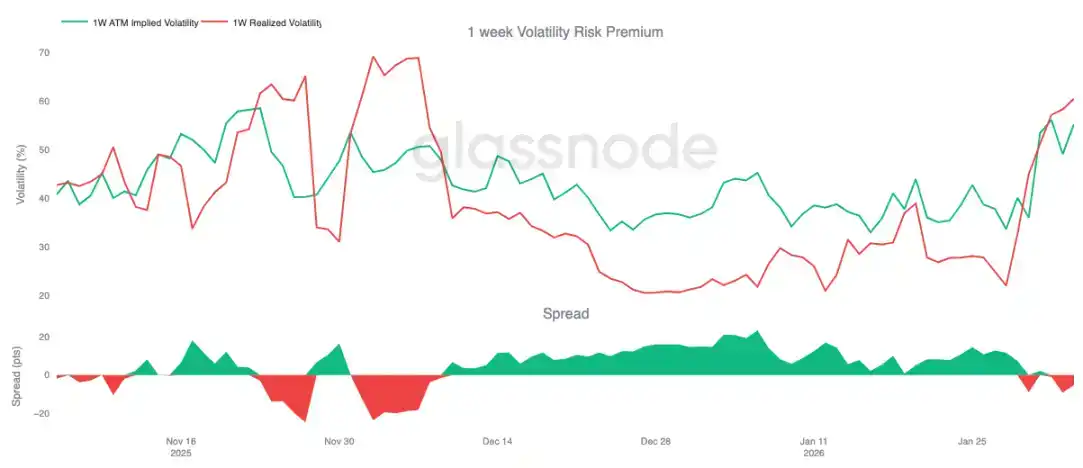
Volatility Risk Premium Turns Negative
The 1-week Volatility Risk Premium turned negative for the first time since early December, currently around -5, compared to +23 just a month ago.
A negative risk premium means implied volatility is below realized volatility. For option sellers, this turns the收益 from time decay into a loss, forcing them to hedge more frequently, which in turn increases short-term market pressure.
In this environment, option trading no longer plays a stabilizing role for the market and may instead exacerbate price volatility.
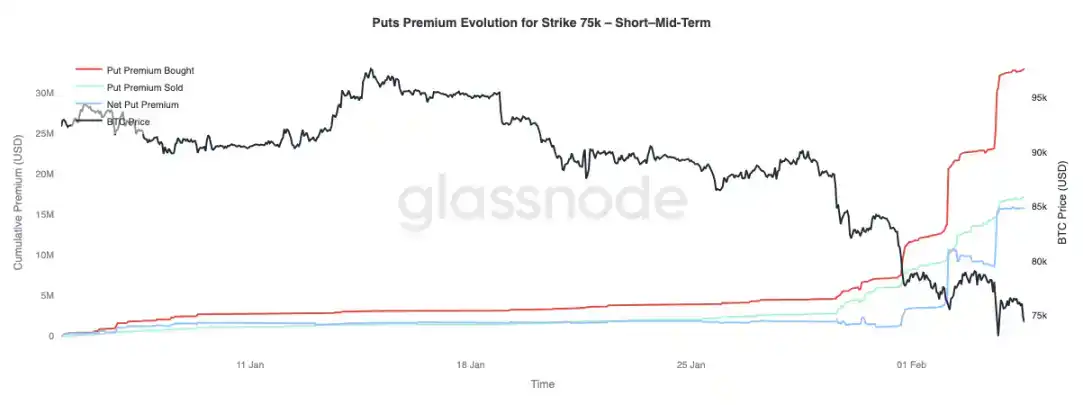
Change in $75,000 Put Option Premium
The $75,000 strike put option has become a focal point for the market, as this level has been tested repeatedly. The net buying premium for these puts has increased significantly, a process advancing in three stages, each synchronized with price declines lacking effective rebound.
The situation is different for longer-dated options (over 3 months): selling premiums have begun to exceed buying premiums, indicating traders are willing to sell high volatility in forward contracts while continuing to pay a premium for short-term protection.
Summary
After failing to reclaim the key level of $94,500, Bitcoin broke below the True Market Mean of $80,200, entering a defensive state. As the price fell into the $70,000 range, unrealized profits contracted and realized losses increased. Although initial accumulation signs appeared in the $70,000-$80,000 range, and a dense holding zone formed between $66,900 and $70,600, persistent loss-selling indicates market sentiment remains cautious.
In the derivatives market, selling pressure showed disorderly characteristics. Large-scale long liquidations confirmed the leverage reset process. While this helps clear speculative froth, it is not sufficient on its own to form a solid bottom. The options market reflects increased uncertainty; rising put demand and high volatility indicate investors are preparing for continued turbulence.
The key to future price action still lies in spot demand. Without seeing an improvement in spot participation and sustained capital inflows, the market will continue to face downward pressure, and any rebounds may lack sustainability. Until fundamentals improve, risks remain skewed to the downside. A genuine recovery requires time, sufficient筹码 turnover, and a substantial restoration of buyer confidence.