For the First Time Since 1955, S&P 500 Profits Exceed Long-Term Trend by 14%

marsbitPublished on 2026-08-04Last updated on 2026-08-04

Abstract

For the first time since 1955, the S&P 500's earnings per share (EPS) have risen approximately 14% above their long-term historical trend channel, according to a recent report. This highlights a significant fundamental shift: strong corporate profits, not just AI narratives or liquidity, are now underpinning the market's high valuations. The strength of current earnings is evidenced on multiple fronts. Actual quarterly results are consistently beating analyst expectations, with the percentage of S&P 500 companies exceeding profit forecasts and the magnitude of sales surprises near multi-year highs. Furthermore, analysts are *raising* future EPS estimates instead of the typical post-quarter downgrades, with full-year 2026 growth expectations revised sharply upwards from ~13% to nearly 28%. This profit growth is broadening beyond the mega-cap "Magnificent Seven" tech stocks. While these giants remain the primary engine, the majority of S&P 500 sectors are contributing, with median company earnings growth around 13.8%. However, this exceptional strength creates a higher bar for future performance. With profit levels already so elevated, merely meeting elevated expectations may not suffice to push stocks higher. Any disappointment in revenue growth, profit margins, or forward guidance could trigger significant pressure on stretched valuations. Therefore, the sustainability of the earnings support will depend on continued sales expansion, stable margins, the payoff from massive...

The high valuation of U.S. stocks is gaining more robust fundamental support: corporate profits are not only growing but analysts are also continuously raising future expectations.

A U.S. stock earnings revision report consolidating data from multiple institutions shows that S&P 500 earnings per share (EPS) are now about 14% above the trend channel formed based on over 90 years of historical data, marking the first deviation of this magnitude since 1955. The report also points out that the proportion of companies exceeding earnings expectations, the magnitude of sales beats, and analyst earnings upgrades are all at historically strong levels.

This data explains why U.S. stocks can still find support despite high valuations. Over the past year, AI investment, interest rate expectations, and liquidity have collectively driven up risk assets; as the index climbs further, relying solely on narratives is no longer sufficient. Corporate profits must continue to grow to digest the higher valuations.

However, strong earnings also present another side: when profit levels are significantly above the long-term trend, market expectations will rise in tandem. Merely meeting forecasts may no longer be enough to drive stock prices higher; once revenue, profit margins, or future guidance fall short of expectations, the pressure on high valuations could also intensify.
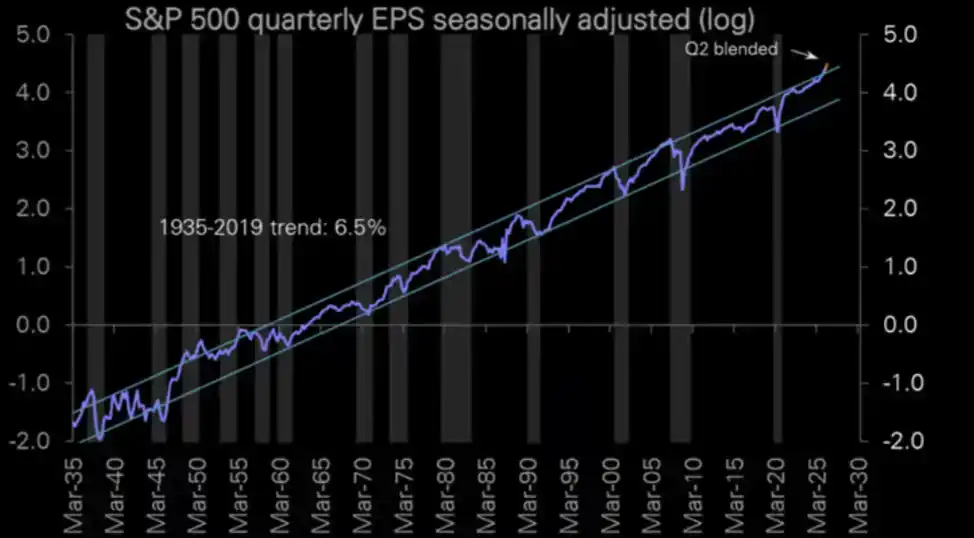
S&P 500 quarterly EPS rises above its long-term trend channel. The report states it is 14% above the 90+ year trend channel, the first time since 1955.

How Strong Are the Profits: S&P 500 EPS Reaches a Rare Position in 70 Years

The report's assessment of the current earnings strength comes mainly from three levels.

First, the absolute level of S&P 500 EPS continues to rise and has clearly broken through the long-term trend range. According to Deutsche Bank's calculations cited in the report, strong earnings growth over consecutive quarters has pushed S&P 500 EPS 14% above its long-term trend channel.

Second, actual corporate performance is generally better than analyst forecasts. The report states that the coverage of S&P 500 companies exceeding earnings expectations is near historical highs, and the overall magnitude of sales beats has risen to a nearly five-year high.

Third, earnings expectations have not been revised downward as usual after the start of the earnings season; instead, they continue to rise. The report shows that in July, analysts raised their bottom-up quarterly EPS expectations for the S&P 500 by 0.3%. Historically, analysts typically lower forecasts in the first month of a quarter to reflect more cautious management guidance and macroeconomic assumptions.

These signals collectively indicate that the current U.S. stock market is not facing a rally driven solely by valuation expansion. Corporate profits themselves are providing support, and actual performance is still consistently surpassing prior expectations.

However, "strong earnings" does not mean all data can be directly mixed.

One striking figure from the report is that S&P 500 Q2 earnings grew by 33.2%, a level not seen in over 30 years, second only to the special recovery phases following the financial crisis and the pandemic.

It is noteworthy that in the public data cited in this article, FactSet, as of July 2, estimated S&P 500 Q2 earnings growth at 23.3% year-over-year; Axios cited FactSet's figure as 22.5%, and Bloomberg's was around 25%. Therefore, a more accurate statement is: under publicly available metrics, S&P 500 Q2 earnings growth is roughly in the 23% to 25% range; the 33.2% figure in the report may use different statistical timing, sample scope, or adjustment methods.

Nevertheless, even using the 23% to 25% range, S&P 500 Q2 earnings growth remains at a high level, with the profit side still providing fundamental support for the index.

Where the Strength Lies: Earnings Beat Expectations, and Profit Forecasts Are Also Being Revised Upward

The value of this round of earnings improvement lies not only in the high Q2 numbers but also in the simultaneous rise of actual performance and future expectations.

Typically, as companies enter the earnings season, analysts gradually lower forecasts based on company guidance, cost changes, and macroeconomic risks. However, the opposite has occurred this earnings season: actual profits have consistently exceeded expectations, and analysts have subsequently continued to raise future EPS estimates.

The report, citing Carson's data, states that at the beginning of the year, the market expected the S&P 500 to achieve about 13% earnings growth in 2026; this expectation has now risen to nearly 28%. This number should be clearly labeled as the institution's metric cited by the report, not as a unified market consensus.

The more important change is that U.S. stock bulls are no longer relying solely on expectations of rate cuts, liquidity, or the AI narrative; they are also beginning to gain support from earnings upgrades.

As long as corporate profits continue to exceed forecasts and analysts keep raising future earnings expectations, high valuations may gradually be digested through profit growth. Conversely, once earnings revisions stop rising, the market will lose a key support, and valuation concerns will re-emerge.
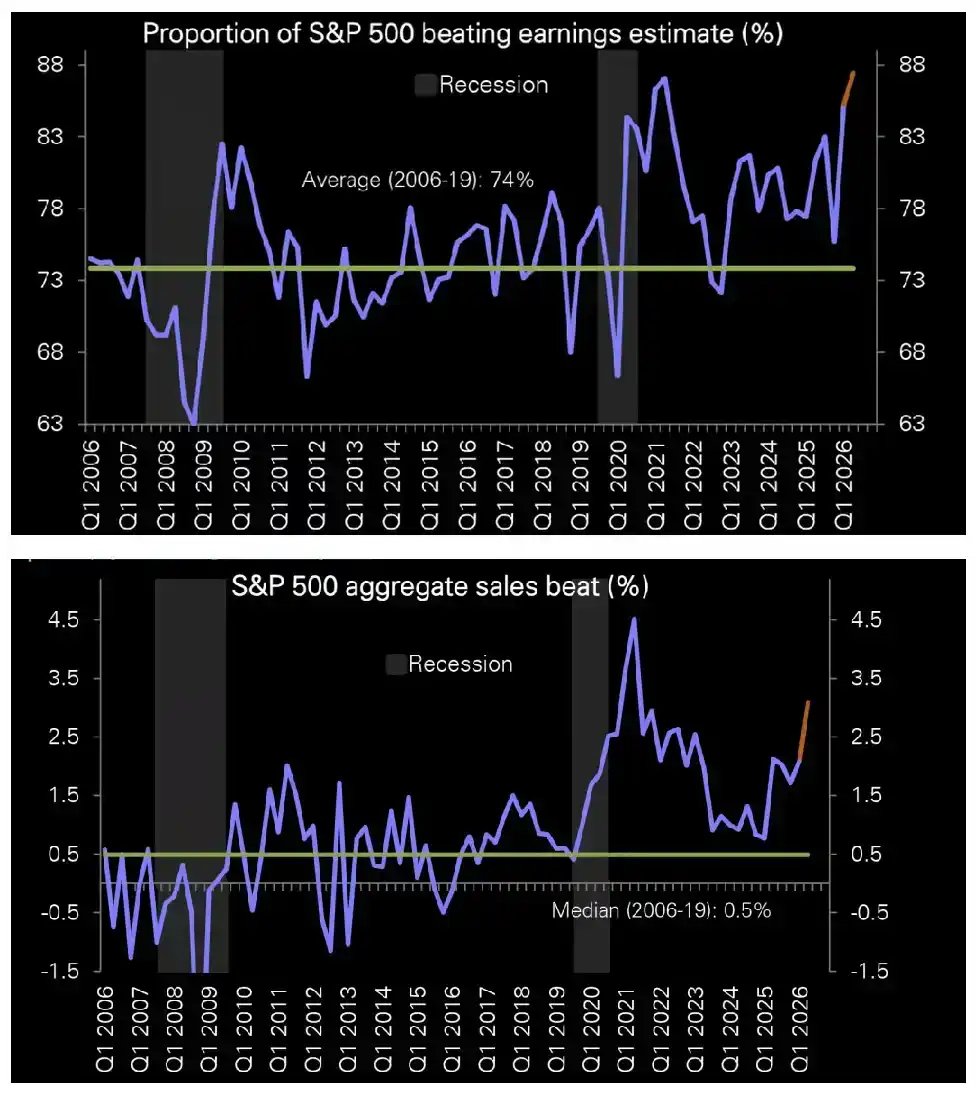
The proportion of S&P 500 companies exceeding earnings expectations has risen to near historical highs, and the overall magnitude of sales beats has also reached a five-year high.

Has It Spread: Tech Stocks Remain the Main Driver, But More Companies Are Joining In

Whether strong earnings can persist also depends on whether growth spreads from a few large tech companies to a broader market.

Breakdown data from FactSet as of July 20 shows the S&P 500's overall blended Q2 earnings growth rate was 24.7%, while the earnings growth rate for the 493 companies outside the "Magnificent Seven" was 22.8%. This implies that the index's earnings growth is not entirely driven by a handful of mega-cap tech companies.

However, the pulling power of heavyweight stocks still cannot be ignored. If Micron and Nvidia are further excluded, the S&P 500's Q2 earnings growth would drop to 16.8%. The report also notes that after excluding star companies and their one-time gains, the median company in the S&P 500 had an earnings growth rate of about 13.8%.

These figures point towards a more balanced judgment: earnings growth has spread, but large tech and semiconductor companies remain important engines.

Data at the industry level also requires cautious interpretation.

The Deutsche Bank metric cited states that all S&P 500 sectors are on track for a second consecutive quarter of positive growth, with 8 out of 11 sectors likely achieving double-digit growth. Meanwhile, the publicly available FactSet metric from July 2 indicates that 10 out of 11 sectors are expected to see year-over-year earnings growth, with Healthcare being the only one expected to decline; on the revenue side, all 11 sectors are expected to achieve year-over-year growth.

Thus, it can be seen that earnings improvement has covered most sectors, but differentiation between sectors still exists.

It is worth noting that revenue growth indicates that overall corporate sales are still expanding, but final profits are also affected by wages, raw materials, depreciation, product mix, pricing power, and one-time gains/losses. The same revenue growth rate can translate into vastly different profit outcomes across sectors.

The true value of earnings diffusion lies in the S&P 500's profit base broadening; the index is no longer completely dependent on a few tech giants. However, this is not sufficient proof that all companies and sectors have entered a synchronized growth cycle.
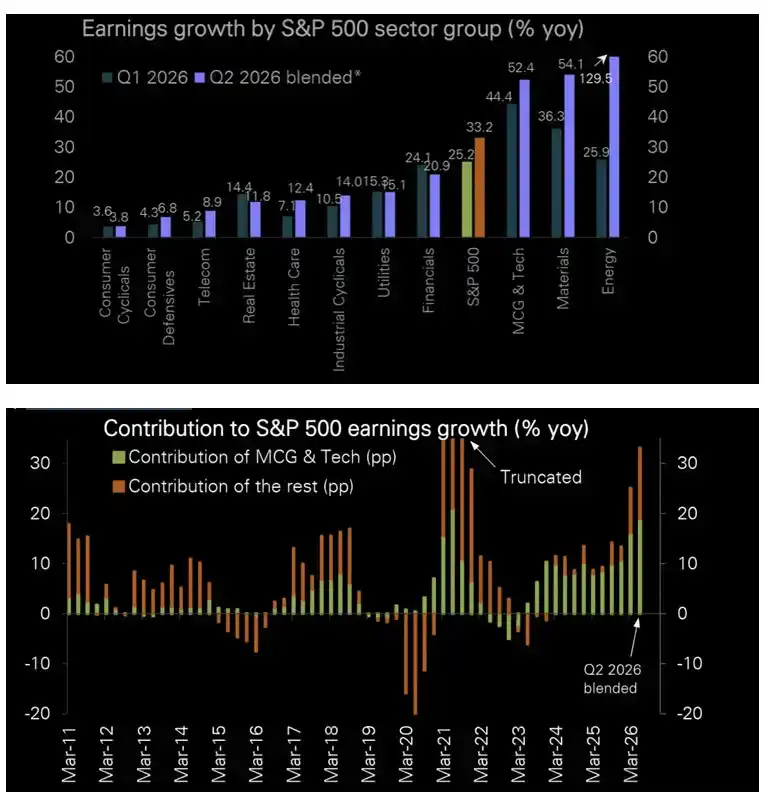
Under the report's metric, earnings growth has accelerated for most S&P 500 sectors, and contributions to index earnings growth are expanding beyond tech and large-cap growth stocks.

Why Stronger Profits Lead to a Higher Earnings Bar

Strong earnings can support valuations but also create higher comparison benchmarks.

According to the report's calculations, S&P 500 EPS is already 14% above its 90+ year trend channel. This does not mean corporate profits are about to peak, nor can it directly lead to the conclusion that the market is about to correct; it indicates that the current profit level is significantly above the long-term trend, meaning future year-over-year growth will face greater pressure from a high base.

When earnings expectations are revised up from about 13% at the start of the year to nearly 28%, the market has essentially priced in fairly optimistic growth assumptions in advance. The test companies face thereafter is no longer just "whether there is growth," but whether the growth rate can continue to exceed constantly rising forecasts.
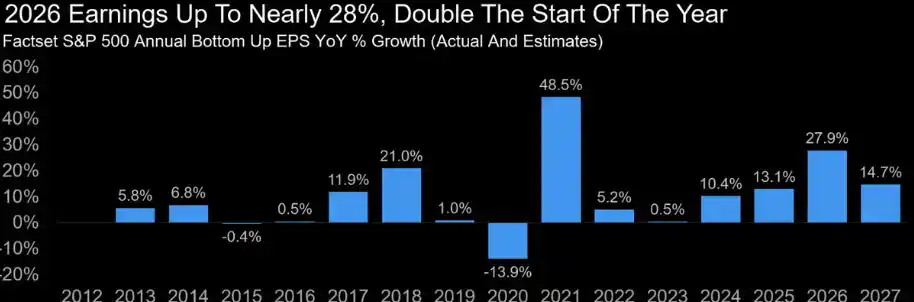
The report shows that full-year earnings growth expectations for the S&P 500 have risen from about 13% at the start of the year to nearly 28%.

This also means a seemingly contradictory situation could emerge during the earnings season: overall profits remain strong, but individual stocks may not necessarily rise due to earnings growth.

The reason is that stock prices reflect the gap between actual results and market expectations. If the market already expects a company's revenue to grow 20%, actual growth of 20% can only be considered in line with expectations; if profit margins, orders, or future guidance are slightly below the market's prior assumptions, the stock price may still fall.

High profitability also increases valuation sensitivity to bad news. A slowdown in sales growth, profit margins under pressure from costs, AI capital expenditure returns falling short of expectations, or management issuing conservative next-quarter guidance could all trigger more pronounced valuation adjustments.

Therefore, stronger profits do not imply lower market risk. They imply more solid fundamental support, but also imply higher investor demands.
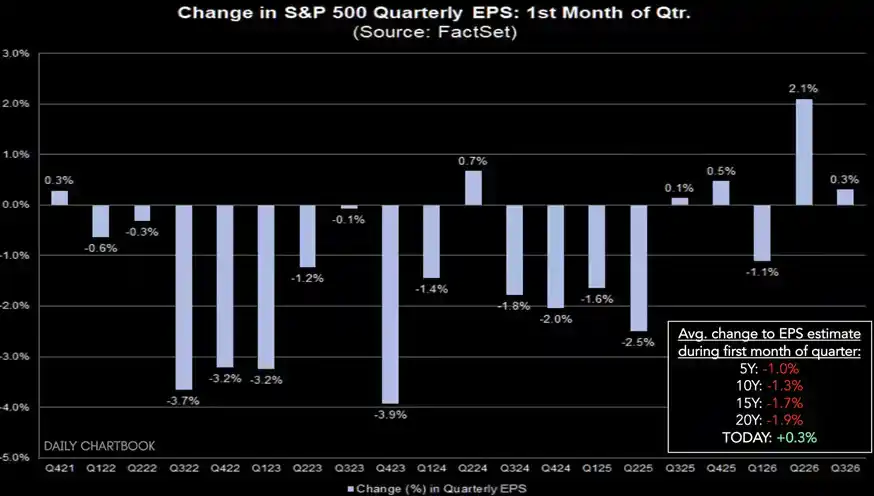
In July, analysts raised their quarterly EPS expectations for the S&P 500 by 0.3%; historically, analysts typically lower earnings expectations in the first month of a quarter.

What to Watch Next: Whether Revenue, Margins, and Earnings Revisions Can Sustain

Going forward, judging whether U.S. stock profits can continue to support the index requires focusing on four more specific variables.

First is revenue growth. Profits can improve in the short term through cost control, buybacks, or one-time gains, but revenue better reflects whether demand is genuinely expanding. If sales growth begins to slow noticeably, the sustainability of profit expansion will also be questioned.

Second is profit margins. The current earnings growth partly stems from the high profit margins and scale effects of large tech companies. If wages, energy, depreciation, or financing costs rise, revenue growth may not translate proportionally into profits.

Third is the return on AI-related capital expenditures. Large tech companies are still investing huge sums in building data centers, purchasing chips, and expanding cloud infrastructure. Investors need to see these expenditures gradually translate into cloud revenue, software subscriptions, advertising efficiency, or enterprise AI service revenue.

Fourth is the direction of earnings revisions. Whether analysts continue to raise 2026 and 2027 EPS forecasts may be more important than a single quarter's earnings growth rate. As long as expectations continue to be revised upward, high valuations can still find support; if earnings revisions peak or even turn downward, the market's tolerance for high valuations will also quickly diminish.

In summary, the most positive signal from this round of U.S. stock earnings is the simultaneous improvement in short-term performance, breadth of growth, and future expectations. The index rally is not solely reliant on liquidity and the AI theme; corporate profits themselves are also providing support.

But this support is already built on exceptionally high profit levels and market expectations.

The stronger the profits, the more reason valuations have to be maintained; the higher the expectations, the greater the cost of earnings missteps. What will truly determine whether U.S. stocks can continue to rise from now on is not whether companies can deliver a "good" earnings report, but whether revenue, profit margins, and future guidance can continue to exceed the increasingly high bar set by the market.


Related Questions

QAccording to the article, by how much does the S&P 500 EPS currently exceed its long-term trend channel, and why is this significant?

AThe S&P 500 EPS currently exceeds its long-term trend channel, based on over 90 years of data, by about 14%. This is significant because it's the first time such a high deviation has occurred since 1955, indicating that corporate profits are at an exceptionally high level relative to historical norms, providing fundamental support for the market's high valuation.

QWhat are the three key indicators mentioned in the article that demonstrate the current strength of corporate earnings in the U.S. stock market?

AThe three key indicators are: 1) The absolute level of S&P 500 EPS has risen above its long-term trend channel. 2) Actual corporate earnings are broadly beating analyst forecasts, with the proportion of S&P 500 companies exceeding profit estimates near historical highs. 3) Analyst earnings revisions are moving upward instead of the typical downward revisions seen at the start of an earnings season, with July seeing a 0.3% upward revision for quarterly EPS estimates.

QBased on the article, has the strong earnings growth in the S&P 500 diffused beyond the large technology companies, and what evidence is provided?

AYes, earnings growth has diffused beyond just the large tech companies, but they remain a crucial engine. Evidence includes: FactSet data showing that excluding the 'Magnificent Seven', the remaining 493 S&P 500 companies still achieved a 22.8% earnings growth rate for Q2. However, further excluding Micron and Nvidia would lower the overall index growth rate to 16.8%, highlighting their significant pull. The median company's earnings growth rate is estimated at around 13.8%.

QWhy does the article suggest that stronger corporate profits might actually create a higher hurdle for companies during earnings season?

AThe article suggests that stronger profits create a higher hurdle because they elevate market expectations. As profit levels rise significantly above the long-term trend and analysts continuously revise forecasts upward (e.g., full-year 2026 growth expectations rising from ~13% to nearly 28%), simply meeting expectations may no longer be enough to push stock prices higher. Companies now need to beat these heightened expectations in terms of revenue, profit margins, or future guidance. Any shortfall could trigger more significant valuation adjustments.

QWhat four specific factors should investors monitor to determine if strong corporate earnings can continue to support the U.S. stock market, according to the article's conclusion?

AThe four specific factors to monitor are: 1) Revenue growth, as a true reflection of demand expansion. 2) Profit margins, to see if cost pressures erode earnings. 3) The return on AI-related capital expenditures, to assess if massive investments translate into new revenues. 4) The direction of earnings revisions, as continued upward revisions are crucial for sustaining high valuations. The sustainability of support hinges on these factors consistently exceeding the increasingly high market expectations.

Related Reads

DeFi Sector Bounces Back Strongest: Which High-Revenue Projects Offer Entry Opportunities?

DeFi Sector Leads Recovery: Which High-Revenue Projects Are Worth Watching? DeFi has been one of the most active sectors during the recent market rebound. Beyond chasing price action, a key fundamental metric for evaluating DeFi protocols is sustainable revenue, which indicates real user demand. This analysis highlights high-revenue projects across key categories, using protocol fee data (net of supplier payouts). **DEX** * **Uniswap (UNI)**: Leads with $7.18M in 30-day revenue. Protocol fees from v2 and select v3 pools are used for UNI token burns. * **Solana DEXs**: Jupiter (JUP, $4.69M 30-day revenue) uses 50% of revenue for JUP buybacks. Meteora (MET, $1.67M) and Raydium (RAY, $1.13M) also allocate portions of fees to token buybacks. * **PancakeSwap (CAKE)**: Earned $5.16M in 30 days, with part of its fees used for CAKE burns, maintaining a net deflationary supply. * **Aerodrome (AERO)**: On Base, it generated $4.11M in 30 days. Revenue is directly distributed to veAERO holders rather than used for buybacks. **Lending** * **World Liberty Financial (WLFI)**: Top earner with $10.47M in 30-day revenue. A proposal passed to use 100% of fees from its Protocol-Owned Liquidity (POL) for WLFI buybacks, but holder net income remains zero. * **Aave (AAVE)**: Generated $4.12M in 30 days. Its buyback program was paused in April 2026 following the rsETH bridge attack. **ETH Staking** * **ether.fi (ETHFI)**: Earned $3.03M in 30 days. Revenue from eETH withdrawals is used for ETHFI buybacks, which are then distributed to sETHFI stakers. * **Lido (LDO)**: Generated $2.31M. Its new NEST mechanism automatically uses 50% of annual revenue exceeding $40M for LDO buybacks. In summary, several DeFi protocols are generating significant revenue, with many employing token buyback or direct distribution mechanisms. This revenue provides a fundamental basis for evaluation amid market volatility.

marsbit3m ago

DeFi Sector Bounces Back Strongest: Which High-Revenue Projects Offer Entry Opportunities?

marsbit3m ago

Hyperliquid is also getting a Layer2, what is Elysium?

Hyperliquid, a decentralized exchange, is set to launch its own Layer 2 solution called Elysium, developed by its largest liquid staking protocol, Kinetiq. This move aims to address key limitations in Hyperliquid's current ecosystem, particularly the performance and user experience issues on its existing HyperEVM. The article explains that HyperEVM has struggled with network congestion, high gas fees (sometimes exceeding $10-$20 per simple swap), and a fragmented infrastructure for launching and trading new tokens, especially memecoins. While there is significant speculative interest, the current setup lacks the efficient trading infrastructure to sustain it. Elysium is designed as a high-performance L2 that will use HYPE as its gas token. Its goals are to provide drastically faster block times and higher throughput compared to HyperEVM, create a seamless pipeline for token launches (from initial creation on Elysium to eventual listing as spot and perpetual markets on Hyperliquid's main chain, HyperCore), and offer developers richer access to HyperCore's order book data for better hedging and market-making. The L2 is positioned not as a competitor to HyperCore but as a "value-accrual" layer that aims to drive more activity and volume back to the main chain. Potential use cases extend beyond memecoins to include complex applications like PaperTrade (a novel perpetual DEX) and other DeFi protocols requiring fast settlement and real-time data. Elysium's sequencer revenue is planned to be shared with applications, the Kinetiq treasury, and used to buy back and burn the KNTQ token.

marsbit4m ago

Hyperliquid is also getting a Layer2, what is Elysium?

marsbit4m ago

Towns Across the U.S. Resist Data Center Construction, Bitcoin Miners Become the Biggest Beneficiaries

Across numerous U.S. states, governors and local governments are slowing or halting approvals for new data center construction due to intense public opposition and political pressure. This creates a significant hurdle for AI and other data center projects, which require years of grid connection approval. According to Morgan Stanley, this grid access bottleneck unexpectedly benefits Bitcoin mining companies like Cipher, Hut 8, and Riot Platforms. These miners already possess pre-approved, valuable power contracts and grid connections. With new supply constrained, their existing infrastructure becomes more valuable. This dynamic accelerates a pre-existing trend: miners are pivoting to supply power and data center capacity to the AI industry, signing large contracts like the $9.1 billion deal between Riot Platforms and Anthropic. Companies with AI/high-performance computing contracts command higher valuations than pure-play Bitcoin miners. However, the shift faces uncertainty. Regulatory reviews, like one in Texas targeting both data centers and crypto mines, could also impact miners' permits. Furthermore, a recent sharp rally in Bitcoin's price, pushing toward $80,000, could make mining profitable again, potentially altering the economic calculus of diverting power to AI. The core conflict pits growing AI demand against community resistance to large, power-intensive facilities.

marsbit6m ago

Towns Across the U.S. Resist Data Center Construction, Bitcoin Miners Become the Biggest Beneficiaries

marsbit6m ago

US Stock Market Trend (Aug 25): Besant's Trillion-Dollar Bond Buy Pushes Down Long-Term Rates, Nasdaq Falls, Dow Rises Amid Extreme Divergence

August 26, US Stock Market: Nasdaq Drops as S&P 500 Sees Mixed Close Amid Treasury Moves, Geopolitical Concerns. The US stock market was sharply divided on Monday. The Dow Jones rose 0.26% to 53,417.16, extending gains, while the S&P 500 slipped 0.28% to 7,652.82, and the Nasdaq Composite fell 0.76% to 25,869.14. The Philadelphia Semiconductor Index tumbled nearly 4%. Treasury Secretary Bessenter took center stage, announcing dual actions: deploying nearly a trillion dollars from the Treasury General Account (TGA) to repurchase long-term bonds to pressure yields, while simultaneously imposing new sanctions on Iran. Long-term Treasury yields edged lower, with the 10-year yield falling about 3 basis points to 4.70%. However, markets focused on the geopolitical risks from the sanctions, prompting a risk-off shift into gold and Bitcoin, weighing heavily on tech and AI-hardware stocks. Nvidia informed major cloud clients of plans to raise AI server prices by over 15% starting next year. The company also reportedly plans to invest in AI search firm Perplexity. Despite this pricing power signal, its stock and the broader chip sector were dragged down by macro and geopolitical worries. All eyes are on Nvidia's earnings report scheduled for release after Wednesday's market close, with focus on Blackwell shipment details and data center revenue guidance. Samsung Electronics disappointed markets with a shareholder return plan seen as insufficient, raising concerns about capital expenditure prospects in the memory chip sector and contributing to the semiconductor selloff. In trade policy, former President Trump announced plans to raise US tariffs on Canadian autos, auto parts, and steel to 50% starting next year, significantly escalating trade tensions. Amid the risk-off sentiment, spot gold rose 1.05% to $4,651.24 per ounce, hitting a near three-month high. Bitcoin climbed 1.59% to $78,966, approaching the $80,000 level for the first time since mid-May. Market attention turns to the US Conference Board's August Consumer Confidence Index, for clues on the resilience of consumer spending, and to continued positioning ahead of Nvidia's pivotal earnings report.

marsbit9m ago

US Stock Market Trend (Aug 25): Besant's Trillion-Dollar Bond Buy Pushes Down Long-Term Rates, Nasdaq Falls, Dow Rises Amid Extreme Divergence

marsbit9m ago

Trading

Spot
活动图片