Finding Missed Pivot Points Correctly: How a Crypto Trader Can Apply the Rob Booker Indicator

cryptonews.ruPublished on 2026-08-08Last updated on 2026-08-08

Abstract

"Missed Pivot Points (MPP), popularized by retail trader Rob Booker, are support and resistance levels calculated mathematically from the previous period's close, high, and low, rather than drawn visually. The article explains their calculation and application in cryptocurrency trading. MPPs act as 'price magnets,' and clusters of these levels are considered strong signals for potential trend reversals, often aligning with Fibonacci retracement levels—as seen in Bitcoin's resistance zones around $62,000-$66,000 and $74,000-$80,000. Traders can use them in breakout or pullback strategies. However, the indicator has drawbacks: numerous variations exist, it shouldn't be used alone, identifying level clusters is subjective, and it can give false signals during consolidation. In conclusion, MPP is a mathematical tool for identifying key levels but requires confirmation from other analysis methods."

Missed Pivot Points (MPP) are levels plotted on charts. The main difference with MPP is that they are drawn not in the standard way, but based on calculations. The foundation of missed pivot points is data from the previous trading period, which can be a day, week, or month. The tool was popularized by retail trader Rob Booker, who specializes in short selling.

So how are they calculated?

Calculating Missed Pivot Points

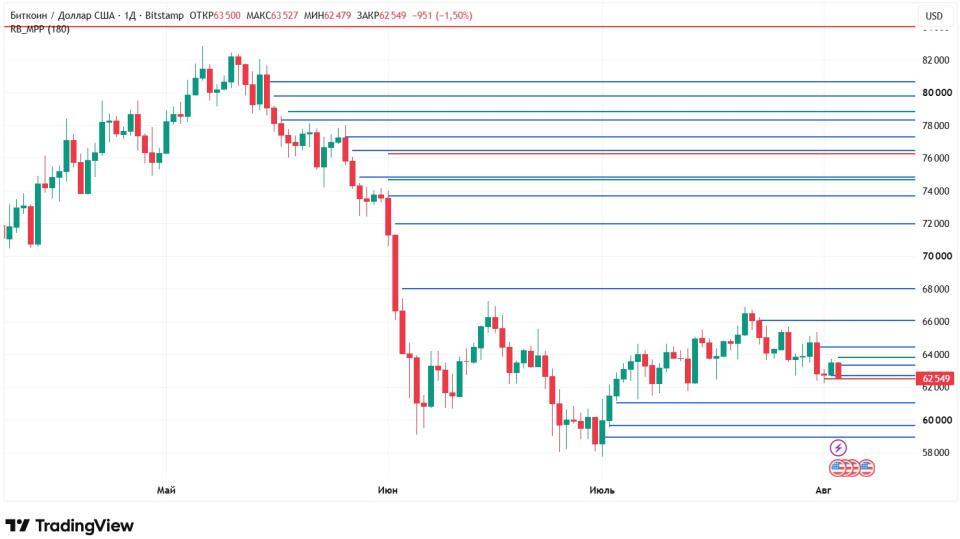
To determine where a particular missed pivot point is located, it is necessary to find the arithmetic mean of the closing, high, and low prices of the previous trading period. Considering that the determination of the level is based on mathematics, drawing it on the chart may not always be obvious from a visualization standpoint. An image of Bitcoin's price movement on the Bitstamp exchange will help confirm this:
Source: tradingview.com

The chart shows many lines of different colors: red monthly, green weekly, and blue daily. As can be seen from the image, far from all of them could have been drawn by eye alone, as they often do not coincide with extremes.

In actual cryptocurrency trading, you won't have to calculate missed pivot points yourself. The trading platform will do this automatically. For example, on TradingView, you only need to set the "Days Ago" argument. It is responsible for the time period on which to search for levels. By default, the argument is set to 180 days. A crypto trader can decrease or increase this parameter at their discretion.

Having figured out how to build and plot missed pivot points, let's turn to how to trade using them.

Missed Pivot Points in Trading

Rob Booker himself believes that the levels act as so-called magnets: the price will tend towards them one way or another. The best reversal signal for a crypto trader will be an area where many different levels have formed. This strengthens the signal that a long-term trend break is quite likely.

If we look at Bitcoin's daily chart, quite strong resistance zones have currently formed in two ranges: $62,000–66,000 and $74,000–80,000. If BTC can break above them, a serious rise is quite possible. At the moment, they act as substantial resistance zones.

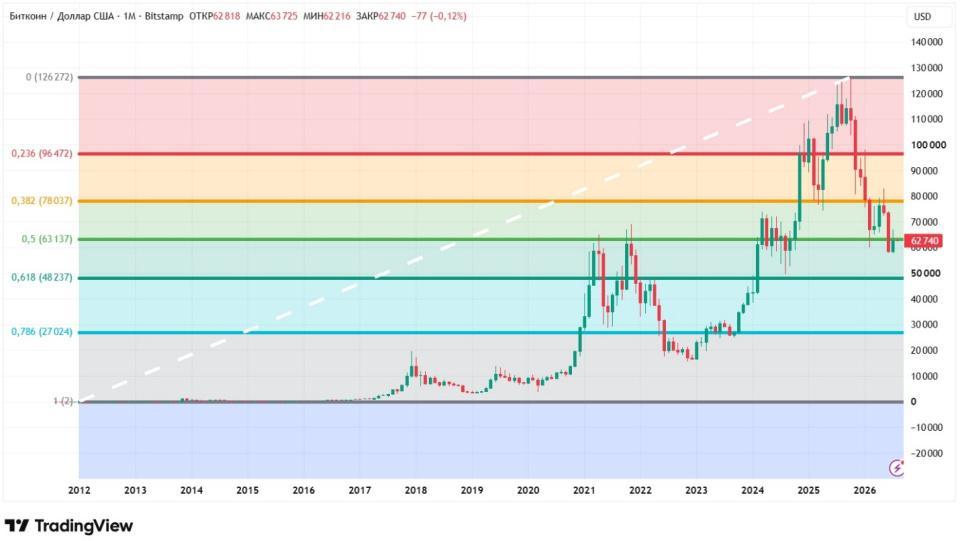
Moreover, Booker claims that a cluster of missed pivot points is often confirmed by Fibonacci levels. If we consider Bitcoin from its low to its high, this holds true. The 50% correction level is around $63,000, thus falling into the first range, and the 38.2% level is not far from $78,000, which corresponds to the second price interval.
Source: tradingview.com

Additionally, missed pivot points can also be used as regular support and resistance levels. In this case, you only need to decide on a strategy: breakout or bounce. In the first case, a trade is made when the level is broken in its direction; in the second case, in the opposite direction. In any case, do not forget to place stop-loss orders, which will prevent unlimited losses.

Despite missed pivot points according to Rob Booker being a simple and effective tool, it has some drawbacks.

Indicator Disadvantages

The first downside is multiple variations. There are quite a few versions of missed pivot points. There are versions by Booker, by Thomas DeMark, by Ken Wood, and others. They all have a right to exist, and their effectiveness depends on the specific trading system.

The second downside is that missed pivot points should not be used as a standalone analytical tool. Even Rob Booker himself, in his lessons, constantly uses the Knoxville Divergence indicator as confirmation.

The third downside is subjectivity. Determining where there are "many" missed pivot points, as Booker advises, has no clear boundaries. As a result, the outcomes can be ambiguous.

The fourth downside is that the indicator can give false signals, especially during consolidation.

Conclusion

Rob Booker's Missed Pivot Points, MPP, is an indicator that operates on the principle of support and resistance levels. The peculiarity of MPP is that the set of its lines is plotted not based on visual representation, but on a mathematical calculation.

This material and the information in it are not individual or any other recommendation. The opinion of the editorial board may not coincide with the opinions of analytical portals and experts.



end-content

Related Questions

QWhat are Missed Pivot Points (MPP) and how do they differ from standard pivot points?

AMissed Pivot Points (MPP) are levels plotted on charts. Their key difference from standard pivot points is that they are not drawn based on visual or standard calculations but are derived from specific mathematical calculations using data from the previous trading period (such as day, week, or month). They were popularized by retail trader Rob Booker.

QHow is a Missed Pivot Point calculated?

ATo calculate a Missed Pivot Point, you need to find the arithmetic mean of the previous trading period's closing price, high price, and low price. In practice, trading platforms like TradingView perform this calculation automatically; the trader only needs to set the 'Days Back' parameter to determine the time frame for finding the levels.

QAccording to the article, how does Rob Booker suggest traders use the concentration of multiple MPP levels?

ARob Booker suggests that an area where multiple different MPP levels cluster together serves as a strong signal. He refers to these zones as a 'magnet' for price, and a cluster often indicates a higher probability of a long-term trend reversal or a significant price movement.

QWhat is one of the main disadvantages of using the Missed Pivot Points indicator mentioned in the article?

AOne of the main disadvantages is that Missed Pivot Points should not be used as a standalone analytical tool. Even Rob Booker, in his own lessons, consistently uses other indicators, like the Knoxville Divergence, to confirm signals generated by MPP.

QHow can crypto traders potentially use MPP levels in their trading strategies?

ATraders can use MPP levels as regular support and resistance levels. They need to decide on a strategy type: a 'breakout' strategy, where a trade is executed when the price breaks through the level in the direction of the break, or a 'bounce' strategy, where a trade is taken in the opposite direction of the level test. Proper stop-loss orders are essential with either approach.

Related Reads

XRP Price Forecast Amid Accumulation by Large Holders

XRP Price Forecast Amid Rising Accumulation by Large Holders On August 12, XRP's price increased by 1.36% to $1.01, recovering after briefly dropping below the $1 support level the previous day. Data indicates that despite weak price momentum, activity from large holders (whales) and active addresses is growing. Santiment data shows a net increase of 32 wallets holding over 1 million XRP over three months, starting May 2026. This accumulation suggests a transfer of supply from weak to strong hands. While large investors bought, retail selling contributed to a 29% decline in XRP's market cap over the same period. Concurrently, the number of active XRP addresses surged 84% from August 1 to August 11. This network activity rise occurs ahead of an XRP Ledger update expected to boost DeFi usage and despite a low 22% probability of the CLARITY Act passing in 2026, creating a bullish divergence. Technically, XRP's drop below $1 on August 12 marked a 20-month low, with the RSI at 37 favoring bears. Further sell pressure could push the price down to the $0.85 Fibonacci level. However, analysts note XRP may be oversold after a 71% decline from July 2025. A strong uptrend would require overcoming resistance at the $1.20 Fibonacci level. Separately, the Coreum bridge connecting to the XRP Ledger was hacked for $200,000 worth of XRP, exploiting a deposit verification flaw. The Ripple community confirmed the XRP Ledger itself remains secure.

cryptonews.ru2m ago

XRP Price Forecast Amid Accumulation by Large Holders

cryptonews.ru2m ago

US Consumer Price Index Drops to 3.4% as Expected, Bitcoin Rises

U.S. Consumer Price Index (CPI) inflation for July met expectations, easing concerns about a Federal Reserve interest rate hike this year. Following the data release, Bitcoin recovered, rising above the key psychological level of $64,000. The U.S. CPI fell to 3.4% year-over-year and 0.1% month-over-month, aligning with forecasts. The core CPI also matched expectations, dropping to 2.5% annually and 0.2% monthly. Bitcoin climbed to around $64,100, recovering from an intraday low near $63,400. However, trading remains in a narrow range due to uncertainty from U.S.-Iran tensions and their potential impact on energy prices. Fed Presidents Austan Goolsbee and Neel Kashkari have indicated inflation is a top concern, with Kashkari advocating for rate hikes. Despite this, the probability of a Fed rate hike at the September FOMC meeting decreased after the CPI report, which is viewed as positive for Bitcoin and the broader crypto market. Market forecasts now suggest a 67% chance rates will remain unchanged. Data from prediction platform Polymarket shows the likelihood of a rate hike this year has fallen to 54%, down from a recent peak of 60% and a July high of 79% amid escalating U.S.-Iran tensions. Market attention now shifts to tomorrow's Producer Price Index (PPI) report for a more complete picture of inflation. A low PPI reading could further reduce rate hike fears, especially following July's jobs report which indicated ongoing labor market instability.

cryptonews.ru4m ago

US Consumer Price Index Drops to 3.4% as Expected, Bitcoin Rises

cryptonews.ru4m ago

Trading

Spot
活动图片