Ethereum Network Experiences Rapid Growth In Daily Transactions Amid Rising ETH Prices

bitcoinistPublished on 2026-03-27Last updated on 2026-03-27

Abstract

Ethereum's network is experiencing a rapid surge in daily transactions, coinciding with a rise in ETH's price toward $2,200. On-chain data indicates a significant spike in user activity, reflecting increased engagement with decentralized applications and on-chain services. Despite recent price declines, network activity remains robust, suggesting underlying resilience among investors. Analysts note that ETH is approaching a critical realized price level near $2,300, a psychological barrier separating profit from loss. With the price positioned in the middle of the realized price range, a medium to long-term holding strategy is advised. At the time of writing, ETH trades around $2,117, down over 2% in 24 hours.

As the market regains bullish momentum, the Ethereum price flipped toward the upside direction, drawing closer to the $2,200 level. Looking at recent on-chain data, this positive performance is starting to reflect on the ETH network, with transactions executed on chain spiking to significant levels.

Daily Transaction Count On Ethereum Climbs

Ethereum’s price action is moving in tandem with the network performance, raising speculation whether ETH is gathering momentum underneath for a potential rally. While the price of Ethereum is currently breaking key resistance points, the network is reaching levels not seen in months.

In an X post, CW, a data analyst on CryptoQuant and investor, has published that activity on the Ethereum network is spiking at a notable pace. According to the analyst, daily transaction counts on the network are increasing exponentially, which points to a sharp rise in user engagement.
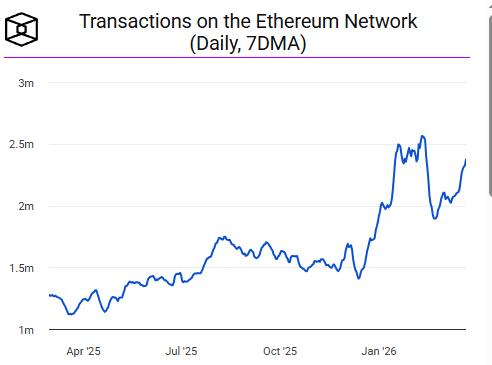
Source: Chart from CW on X

Furthermore, this surge in daily transaction count implies that more participants are interacting with decentralized applications, transfers, and on-chain services. All of these crucial factors reflect renewed demand and growing utility across the broader ecosystem, which could translate into sustained market momentum.

Although the price of ETH has fallen this year, activity across the leading network has remained at an all-time high level. At this point, CW claims that the rising daily transaction count is not a signal of a bear market. The price of Ethereum may have dropped, but some investors are displaying robust resilience under the surface, reinforcing the network growth as the trend continues.

ETH’s Price Is Moving Closer To Short-Term Realized Price

In terms of price action, Ethereum continues to trade within a short-term range, with the altcoin currently valued around $2,150. After a brief analysis, Darkfost, another author at CryptoQuant and market expert, announced that the price is in striking distance from the average realized price, which presently sits at the $2,300 level.

This level typically serves as a structural and psychological barrier that separates profit from loss for a significant portion of the market. ETH nearing this level signals a critical inflection point. By applying a standard deviation, the model allows projecting a high average price currently estimated at the $5,300 mark and a low at $1,150.

Thus, Darkfost highlighted that Ethereum is positioned in the middle of this realized price zone, suggesting that the best strategy for those looking to take a medium to long-term exposure is to wait out the market. Given the current market conditions, this strategy proves to be valid. In this market structure, the realized price, which acts as resistance, is also expected to serve as a break-even exit level for some investors.

At the time of writing, the price of ETH was trading at $2,117, declining by over 2% over the last 24 hours. Its trading volume is moving in alignment with price action, recording a more than 7% decrease over the past day.

ETH trading at $2,122 on the 1D chart | Source: ETHUSDT on Tradingview.com

Trending Cryptos

Related Questions

QWhat is the current price of Ethereum and how has it changed in the last 24 hours?

AAt the time of writing, the price of Ethereum was trading at $2,117, declining by over 2% over the last 24 hours.

QAccording to the data analyst CW, what on-chain metric is spiking and what does it indicate?

AAccording to data analyst CW, the daily transaction count on the Ethereum network is spiking at a notable pace, which points to a sharp rise in user engagement and renewed demand across the ecosystem.

QWhat is the significance of the 'realized price' level mentioned in the article, and where is it currently positioned?

AThe 'realized price' level, currently at $2,300, is a structural and psychological barrier that separates profit from loss for a significant portion of the market. The article states that Ethereum is in striking distance of this level, signaling a critical inflection point.

QWhat does the high and low price projection, based on a standard deviation model, estimate for Ethereum?

ABy applying a standard deviation, the model projects a high average price estimated at $5,300 and a low at $1,150.

QDespite the price drop this year, what has remained at an all-time high level on the Ethereum network according to the article?

AAccording to the article, activity across the Ethereum network has remained at an all-time high level despite the price of ETH falling this year.

Related Reads

Goldman Sachs: July Smashes Through Crowded Trades, U.S. Stock Bull Market Not Broken but Harder to Navigate

Goldman Sachs: July Sees Crowded Trades Unwound, U.S. Bull Market Intact but Getting Tougher. The U.S. stock market in July did not see an index-level crash, but rather a significant unwinding of speculative positions. While the S&P 500 remained stable—trading within a narrow 3.5% range and staying within 2% of its high—underlying market dynamics were volatile. Heavily crowded trades, particularly in high-momentum tech, AI-linked stocks, and Asian strategies, faced severe pressure and forced deleveraging. Data indicates this was a meaningful cleanse, not a minor adjustment. Global tech exposure saw its largest sell-off in over five years, leverage in Korean equity ETFs plummeted, and Goldman's prime brokerage recorded the largest gross exposure reduction since late 2022. Leverage on momentum factors among fundamental long/short clients fell to the 28th percentile of its one-year range. The AI trade narrative shifted from pure potential to a focus on tangible returns. While Meta failed to show clear AI monetization, Microsoft and Amazon provided evidence that massive capital expenditure is translating into scalable revenue and product growth, preventing a blanket sell-off of the AI sector. The Federal Reserve's more opaque communication style and volatility in long-end Treasury yields have introduced new friction, particularly for rate-sensitive growth and tech stocks. The broader outlook for U.S. equities remains favorable, supported by a strong economy, robust earnings, and substantial AI capital expenditure. However, risk/reward is no longer cheap, and the market's upward elasticity has weakened. The Nasdaq 100's trajectory—up 12% year-to-date despite significant pullbacks—illustrates that the bull trend persists but the path is becoming more difficult. The key lesson from July is that the market no longer rewards crowded, highly leveraged trades, requiring more disciplined and liquid portfolio approaches.

marsbit3h ago

Goldman Sachs: July Smashes Through Crowded Trades, U.S. Stock Bull Market Not Broken but Harder to Navigate

marsbit3h ago

Trading

Spot

Hot Articles

Discussions

Welcome to the HTX Community. Here, you can stay informed about the latest platform developments and gain access to professional market insights. Users' opinions on the price of ETH (ETH) are presented below.

活动图片