Ethereum’s price was rocked by the market drawdown on Monday, causing it to lose the $1,900 support level once again, which has triggered speculations about its near-term market outlook. Following the pullback, investors’ sentiment is shifting towards a more cautious state, keeping its market dynamics firmly bearish.
Bearish Momentum Persists in The Ethereum Market
Just as the broader cryptocurrency environment has flipped highly bearish, Ethereum market dynamics remain strongly tilted to the downside. Some of the indications of this scenario include signs of capitulation across the leading altcoin and network.
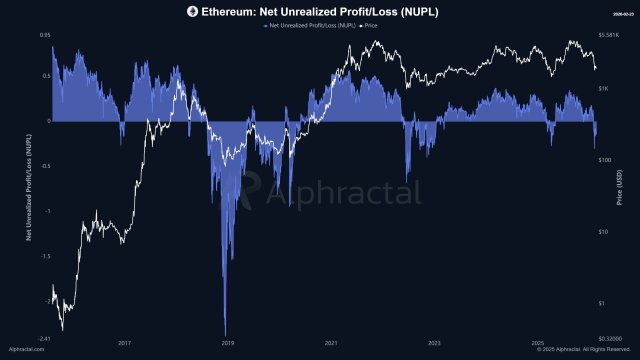
Joao Wedson, an author and the founder of on-chain data analytics platform Alphractal, has shed light on ETH’s current market state after examining multiple metrics. Key indications, such as realized/unrealized losses and declining demand metrics, point to an increasing number of investors pulling out of positions due to pressure.
Data from Alpha AI shows that there is an increase in long positions while the Coinbase Premium Index is demonstrating a decline. The increase in leveraged longs indicates that traders are wagering that recent weakness will give way to upward momentum and are setting up for a rebound.
At the same time, on-chain data is flashing signs of capitulation. Current flows indicate defensive behavior from investors and waning conviction rather than new accumulation. Wedson also underlined other key areas and metrics that reinforce this idea of bearish market dynamics for ETH.
The first metric is the Whale vs Retail Delta, which is now showing that the retail investors are positioning heavily on the long side. The Liquidation Level Heatmap is reflecting high leverage in the system. ETH’s Open Interest (OI) has been declining, with active addresses persistently vanishing.
On-chain volume is flashing caution as active drops, and the NUPL is currently exhibiting capitulation signals. Given these bearish signals, Wedson highlighted that the next drop could spur the formation of a base with strong probability. This implies that Ethereum might start its accumulation phase in the short term.
A Move Back To Lower Bollinger Bands
In the current market state, Ethereum’s price appears to be moving in the same direction as Bitcoin’s price. According to market analyst and investor Cantonese Cat, both cryptocurrency assets just hit their lower Bollinger Bands as they contract as support. However, the direction has not yet been determined for the Bollinger Band squeeze.
As a result, Cantonese Cat noted that bulls may want more sideways to turn the 20-day SMA flatter, which would present a better chance to flip it as support. Meanwhile, the bears would be looking for more follow-through of the current price action and for a lower low occurring soon, but it has not yet happened.
At the time of writing, the ETH price was trading at $1,826 after dropping by over 3% in the last 24 hours. Despite the waning price action, its trading volume has turned bullish again, rising by more than 29% within the same period.