ETH Price Holds Near $3,000 as ETF Outflows Offset Market Gains

TheNewsCryptoPublished on 2026-01-28Last updated on 2026-01-28

Abstract

Ethereum (ETH) is trading near $3,004, showing modest gains while remaining range-bound between key support and resistance levels. Despite a 24-hour trading volume of $26.56 billion, ETH faces subdued medium-term momentum, trading below key moving averages. Institutional flows show a net outflow of $63.53 million from Ethereum ETFs, with BlackRock’s fund contributing significantly. While some products saw minor inflows, they weren’t enough to offset outflows, though cumulative net inflows since launch stand at $12.36 billion. Technical indicators like RSI and MACD suggest balanced buying and selling pressure, with near-term movement likely confined between $2,900 support and $3,150–$3,200 resistance.

Ethereum (ETH) is trading near $3,004, showing a modest gain over the past day as price action remains around the $3,000 level. Over the last 24 hours, ETH moved between an intraday low of $2,916.22 and a high of $3,040.72, while its market capitalization stands at $362.66 billion and trading volume is around $26.56 billion. This reflects ongoing interest in the asset even as broader market dynamics evolve.

Meanwhile, institutional flows into Ethereum’s exchange-traded products remain a key focus. According to the latest data SoSoValue, the total net flow for January 27 showed a net outflow of about $63.53 million, with BlackRock’s ETHA fund accounting for the largest portion of that outflow.

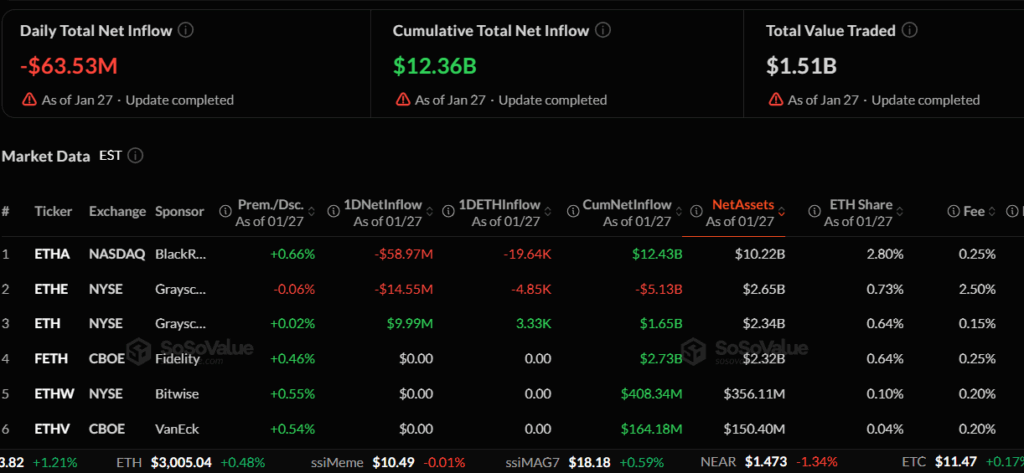
At the same time, some other products, such as the Grayscale Ethereum Mini Trust ETF, recorded smaller net inflows, but they were not large enough to offset the overall outflow figure. The cumulative total net inflow into Ethereum spot ETFs now stands near $12.36 billion since these products launched.

Ethereum Trades Near $3,000 as Price Action Remains Range-Bound

On the weekly chart, Ethereum is still trading below its 9-week moving average (near $3,050) and below the 21-week moving average (around $3,515). This suggests that medium-term trend momentum remains subdued. Weekly price action has seen lower highs after peaks near $3,800, indicating that sellers have been active at higher levels and the broader structure has not yet turned decisively upward. The lack of a fresh bullish crossover keeps upside momentum restrained for now.

The RSI (14) on the weekly timeframe sits around 44–45, below neutral levels. This highlights a lack of strong momentum in either direction, with buying and selling pressures broadly balanced. Meanwhile, the MACD indicator remains below its signal line with the histogram in negative territory, pointing to continued range-bound conditions rather than a firm trend reversal.

Zooming in, The Bull Bear Power Trend (BBPT) shows reduced bearish pressure, but bullish strength is still limited. This aligns with the current sideways movement.

Looking at short-term price action, daily charts show ETH consolidating above $2,900, with buyers defending dips and sellers stepping in near resistance levels. From a longer-term perspective, Ethereum remains above several key support bands but below major resistance zones formed earlier in the year, reflecting a period of correction and consolidation following earlier gains.

In the near term, support is seen near $2,900, while resistance is located around $3,150–$3,200. Until price clears these levels with conviction, ETH’s movement is likely to remain range-bound, shaped by both technical levels and broader market flows.

TagsAltcoinCrypto MarketETHETHEREUM

Related Questions

QWhat is the current trading price of Ethereum (ETH) and what is its market capitalization?

AEthereum (ETH) is trading near $3,004, and its market capitalization stands at $362.66 billion.

QWhat was the total net flow for Ethereum exchange-traded products on January 27, and which fund had the largest outflow?

AThe total net flow for January 27 showed a net outflow of about $63.53 million, with BlackRock's ETHA fund accounting for the largest portion of that outflow.

QWhat do the weekly RSI and MACD indicators suggest about Ethereum's current market momentum?

AThe weekly RSI (14) sits around 44–45, below neutral levels, indicating a lack of strong momentum in either direction. The MACD remains below its signal line with the histogram in negative territory, pointing to continued range-bound conditions rather than a firm trend reversal.

QWhat are the key near-term support and resistance levels for Ethereum's price?

AIn the near term, support is seen at $2,900, while resistance is located around $3,150–$3,200.

QWhat is the cumulative total net inflow into Ethereum spot ETFs since their launch?

AThe cumulative total net inflow into Ethereum spot ETFs now stands near $12.36 billion since these products launched.

Related Reads

The Value Distribution of Stablecoins

**Summary: The Value Distribution of Stablecoins** The article argues that stablecoins are evolving from mere trading tools into broader channels for dollar access. It divides the stablecoin ecosystem into four layers to analyze how value is distributed: 1. **Issuance Layer:** Mints stablecoins, holds reserve assets, and captures the spread between reserve yield and user costs (e.g., Tether, Circle). This layer currently earns the largest profit margin. 2. **Infrastructure Layer:** Connects stablecoins to the traditional financial system, handling fiat on/off-ramps, banking integration, compliance (KYC/AML), and asset management (e.g., Bridge, BVNK). This is the "unglamorous" but critical work, building the essential bridges between crypto and real-world finance. 3. **Acquiring/Distribution Layer:** Integrates stablecoins into merchant systems, manages payment flows, and provides enterprise financial software (e.g., Stripe, Coinbase). They act as the access point for businesses. 4. **Application Layer:** The end-users and businesses that ultimately use stablecoins for payments, settlements, or as a store of value. They benefit from convenience but have little pricing power. The core thesis is that while the issuance layer currently dominates profits, the often-overlooked **infrastructure layer holds significant long-term potential**. The real challenge and barrier to mass adoption is not the on-chain transfer of stablecoins (which is simple), but the complex "last mile" integration into existing business workflows, banking systems, and regulatory frameworks across different countries. Companies in this layer are currently in a "land grab" phase, investing heavily to build networks, secure bank partnerships, and establish compliance pathways. While their position is currently pressured by the profitable issuers above and distribution platforms below, the article suggests that if stablecoins become a default financial rail for businesses, the infrastructure providers who have done the hard work of integration will ultimately gain strong pricing power and become entrenched, essential players.

marsbit1h ago

The Value Distribution of Stablecoins

marsbit1h ago

The Value Distribution of Stablecoins

The Value Distribution of Stablecoins The article argues that stablecoins are evolving from a mere trading tool into a broad "dollar channel." It analyzes the industry's value chain through four layers: 1. **Issuance Layer (e.g., Tether, Circle):** The top layer that mints stablecoins, holds reserve assets, and captures the thickest interest rate spread. 2. **Infrastructure Layer (e.g., Bridge, BVNK):** Connects stablecoins to the traditional financial system, handling critical but complex "dirty work" like fiat on/off-ramps, banking integration, compliance (KYC/AML), and cross-border settlement. 3. **Acquiring/Distribution Layer (e.g., Stripe, Coinbase):** Embeds stablecoins into merchant systems, manages payment flows, and integrates with enterprise software. 4. **Application Layer:** End-users and businesses that ultimately use stablecoins for payments, settlement, or storing value. The author posits that while the issuance layer currently captures the most profit, the most overlooked and potentially critical layer is infrastructure. The core challenge for stablecoin adoption isn't the on-chain transfer (which is simple), but bridging the gap between blockchain and the real-world financial system. This involves solving practical problems for businesses: fiat conversion, reconciliation, tax handling, and user onboarding. Infrastructure companies are currently in a difficult "land-grab" phase—building networks, securing banking relationships, and achieving compliance country-by-country. They face pressure from both the profitable issuance layer above and distribution platforms below. However, the author suggests this layer is building a crucial moat. Once stablecoins become a default business rail, the infrastructure players who have done the hard work of integration may gain significant, durable value and pricing power.

链捕手1h ago

The Value Distribution of Stablecoins

链捕手1h ago

How to Do Research Well: Deliberately Practice the Real Skills That Matter

No one truly teaches you how to do research. You're often given a desk, a pre-selected problem, and vague instructions to "create something new." Consequently, many people reverse-engineer the job based on visible outputs—papers, posts, announcements—learning only how to *appear* like a researcher rather than how to *become* one. True research capability is built from stacking small, trainable skills, nearly all of which can be developed through deliberate practice. **Pick Your Own Problem:** Most researchers absorb problems from advisors or trends, lacking the underlying reasoning. Choosing a problem you genuinely care about, as John Schulman advises, leads to original work. Develop "taste" like a muscle: predict experiment outcomes, guess paper results from methods, and track which findings remain important over time. **Upgrade Your Inputs:** Relying on shared reading lists (arXiv hot lists, filtered group chats) leads to unoriginal conclusions. Undervalued old literature often holds crucial insights (e.g., MoE, LSTM, backpropagation). Richard Sutton's "The Bitter Lesson" or Claude Shannon's 1952 talk on creative thinking are more predictive than lengthy modern surveys. Breadth matters as much as depth: draw from neuroscience, mechanism design, hardware knowledge, and honest statistics. Read papers directly, especially appendices and limitations sections. **Write Everything Down:** As Paul Graham noted, writing exposes flaws in seemingly mature ideas. Writing is the cheapest defense against self-deception. Following Feynman's principle, Darwin programmatically wrote down facts contradicting his theory to combat memory bias. Maintain a detailed log of hypotheses, setups, predictions, results, and updated understandings. Reviewing past logs fosters essential humility.

marsbit3h ago

How to Do Research Well: Deliberately Practice the Real Skills That Matter

marsbit3h ago

Trading

Spot
Futures
活动图片