Dogecoin Price Just Entered A Critical Level, But Analyst Says It’s Not Time To Buy

bitcoinistPublished on 2026-06-04Last updated on 2026-06-04

Abstract

Dogecoin has returned to a major long-term level on its monthly chart, entering what analyst Trader Tardigrade identifies as a critical resistance zone. Historically, this zone within a massive descending broadening channel has seen only two visits in the past decade—in 2017 and 2020—each followed by a strong rejection and deep correction. The coin has already dropped 8% after testing this area. Crucially, the analyst's chart is inverted; the "resistance" line is actually a bullish support line on a normal price chart. Past rejections from this line preceded major rallies. Therefore, the current price action near $0.0937 is viewed as a return to support, with potential for an upward bounce. A move above $0.10 could signal improving sentiment, while a break above $0.25 would confirm a bounce from support. The inverted chart structure even suggests room for significant upside toward double-digit targets.

Dogecoin has returned to a major long-term level on the monthly chart, setting up another important test for the meme coin after months of weak price action.

The setup was initially noted by crypto analyst Trader Tardigrade on X, who argued that DOGE is now sitting at a critical resistance zone where previous rallies have failed. Dogecoin has visited this price zone only twice in the past decade, and each visit ended the same way.

The Pattern That Has Defined DOGE Since 2015

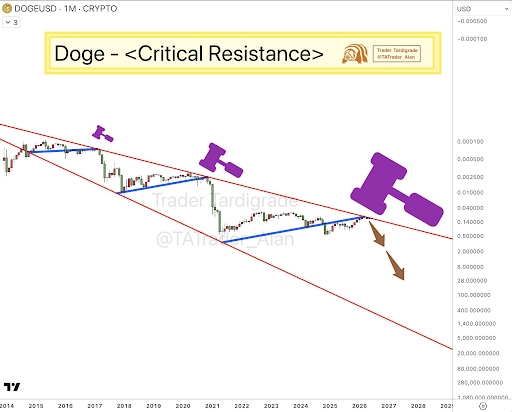
Trader Tardigrade’s long-term Dogecoin chart shows DOGE trading inside a massive descending broadening channel that has shaped price action for years. This channel has shaped Dogecoin’s price action for over a decade now, with two clearly defined red trendlines that widen progressively as time passes.

As shown in the chart below, Dogecoin previously rallied into the upper resistance of this channel in 2017 and in 2020, and both moves ended with strong rejections followed by deep corrections. Now, in 2026, Dogecoin has returned to that same overhead structure for a third time and looks like it is about to reject again. As noted by Trader Tardigrade, this is where we dump Dogecoin.

Source: Chart from Trader Tardigrade on X

Dogecoin has already dropped by 8% over the last three days, a decline that came shortly after DOGE tested that major resistance area, making the pattern a strong warning.

Real Message Behind The Inverted Chart

Trader Tardigrade’s chart presents DOGE/USD on the monthly timeframe, but the price scale is flipped. This means the lower the chart moves, the higher Dogecoin is actually moving in normal market price. Therefore, the red descending line labeled as critical resistance is not a bearish ceiling in the conventional sense, but a bullish line on an inverted chart, and a rejection from it sends the price directly into an upward movement in real terms.

In each of the two previous cases, the 2017 cycle and the 2021 cycle, a rejection from that inverted resistance was followed by a large move downward on the inverted chart, meaning a large rally upward on the normal DOGE chart.

Therefore, the current price action should be looked at as a return to support instead, and the analyst is expecting a bounce to higher price levels. Dogecoin is currently trading at $0.0937, which places it squarely within a support range between $0.09 and $0.10.

A move above $0.10 and into the $0.15 to $0.18 range would be the first indication that sentiment around DOGE is beginning to improve. However, the stronger signal would come from a break above $0.25, as that would make it clearer that DOGE is bouncing from the support structure.

Interestingly, the inverted chart’s structure leaves room for a move into double-digit price targets before Dogecoin reaches the next major trendline.

DOGE trading at $0.09 on the 1D chart | Source: DOGEUSDT on Tradingview.com

Related Questions

QWhat is the critical level that Dogecoin price has just entered, and how significant is it according to the article?

ADogecoin has returned to a major long-term resistance level on the monthly chart, which is a critical price zone it has only visited twice in the past decade. Both previous visits resulted in strong rejections followed by deep corrections, making this level highly significant and a crucial test for DOGE's current price action.

QWho is the analyst mentioned in the article, and what is their key observation about Dogecoin's current chart pattern?

AThe analyst mentioned is Trader Tardigrade on X. Their key observation is that Dogecoin is trading inside a massive descending broadening channel that has shaped its price action for years. DOGE is now testing the upper resistance of this channel for the third time, a zone where previous rallies in 2017 and 2021 failed.

QWhat is unusual about the chart presented by Trader Tardigrade, and how does it change the interpretation of the 'resistance' level?

AThe chart presents DOGE/USD on a monthly timeframe with an inverted price scale. This means the 'descending resistance' line is actually a bullish line on the inverted chart. A rejection from this line on the inverted chart signals a large upward movement for DOGE's actual price. Therefore, the critical level should be viewed as a support zone for a potential price bounce.

QBased on the inverted chart analysis, what price movement is expected for Dogecoin from its current level?

ABased on the inverted chart analysis, a rejection from the 'resistance' (which acts as support on the inverted chart) is expected to lead to a bounce to higher price levels. The analyst anticipates a move upward, with key levels to watch being a break above $0.10, then the $0.15 to $0.18 range, and a stronger signal coming from a break above $0.25.

QWhat is Dogecoin's current price and the key support range mentioned in the article?

ADogecoin is currently trading at $0.0937. The key support range mentioned is between $0.09 and $0.10.

Related Reads

The Value Distribution of Stablecoins

**Summary: The Value Distribution of Stablecoins** The article argues that stablecoins are evolving from mere trading tools into broader channels for dollar access. It divides the stablecoin ecosystem into four layers to analyze how value is distributed: 1. **Issuance Layer:** Mints stablecoins, holds reserve assets, and captures the spread between reserve yield and user costs (e.g., Tether, Circle). This layer currently earns the largest profit margin. 2. **Infrastructure Layer:** Connects stablecoins to the traditional financial system, handling fiat on/off-ramps, banking integration, compliance (KYC/AML), and asset management (e.g., Bridge, BVNK). This is the "unglamorous" but critical work, building the essential bridges between crypto and real-world finance. 3. **Acquiring/Distribution Layer:** Integrates stablecoins into merchant systems, manages payment flows, and provides enterprise financial software (e.g., Stripe, Coinbase). They act as the access point for businesses. 4. **Application Layer:** The end-users and businesses that ultimately use stablecoins for payments, settlements, or as a store of value. They benefit from convenience but have little pricing power. The core thesis is that while the issuance layer currently dominates profits, the often-overlooked **infrastructure layer holds significant long-term potential**. The real challenge and barrier to mass adoption is not the on-chain transfer of stablecoins (which is simple), but the complex "last mile" integration into existing business workflows, banking systems, and regulatory frameworks across different countries. Companies in this layer are currently in a "land grab" phase, investing heavily to build networks, secure bank partnerships, and establish compliance pathways. While their position is currently pressured by the profitable issuers above and distribution platforms below, the article suggests that if stablecoins become a default financial rail for businesses, the infrastructure providers who have done the hard work of integration will ultimately gain strong pricing power and become entrenched, essential players.

marsbit6h ago

The Value Distribution of Stablecoins

marsbit6h ago

The Value Distribution of Stablecoins

The Value Distribution of Stablecoins The article argues that stablecoins are evolving from a mere trading tool into a broad "dollar channel." It analyzes the industry's value chain through four layers: 1. **Issuance Layer (e.g., Tether, Circle):** The top layer that mints stablecoins, holds reserve assets, and captures the thickest interest rate spread. 2. **Infrastructure Layer (e.g., Bridge, BVNK):** Connects stablecoins to the traditional financial system, handling critical but complex "dirty work" like fiat on/off-ramps, banking integration, compliance (KYC/AML), and cross-border settlement. 3. **Acquiring/Distribution Layer (e.g., Stripe, Coinbase):** Embeds stablecoins into merchant systems, manages payment flows, and integrates with enterprise software. 4. **Application Layer:** End-users and businesses that ultimately use stablecoins for payments, settlement, or storing value. The author posits that while the issuance layer currently captures the most profit, the most overlooked and potentially critical layer is infrastructure. The core challenge for stablecoin adoption isn't the on-chain transfer (which is simple), but bridging the gap between blockchain and the real-world financial system. This involves solving practical problems for businesses: fiat conversion, reconciliation, tax handling, and user onboarding. Infrastructure companies are currently in a difficult "land-grab" phase—building networks, securing banking relationships, and achieving compliance country-by-country. They face pressure from both the profitable issuance layer above and distribution platforms below. However, the author suggests this layer is building a crucial moat. Once stablecoins become a default business rail, the infrastructure players who have done the hard work of integration may gain significant, durable value and pricing power.

链捕手6h ago

The Value Distribution of Stablecoins

链捕手6h ago

Trading

Spot
Futures
活动图片