Deconstructing the Real Risks of DeFi Lending: Annual Loss Rate Only 0.03%

marsbitPublished on 2026-05-19Last updated on 2026-05-19

Abstract

Deconstructing the true risks of DeFi lending reveals an annual loss rate of only 0.03% from hacks and exploits. Analysis of DeFi Llama data (excluding cross-chain bridge incidents) for EVM and Solana lending protocols shows that despite high historical attack frequency due to concentrated assets, the sector's security has matured significantly. Over the past year, non-cross-chain lending on these chains saw gross losses of $309M, with net losses after recoveries at $301M. Against a daily average TVL of $99.6B, this translates to a minimal annualized loss rate of approximately 0.03%. The Euler Finance case in 2023, where $197M was fully recovered, exemplifies improving asset recovery capabilities, which now account for roughly 20% of losses in this sector. Loss events follow a log-normal distribution: most are small-scale, with catastrophic losses being rare outliers. This pattern, combined with the massive scale of the total lending market, means single incidents rarely impact the broader ecosystem. It underscores the effectiveness of portfolio diversification and provides a basis for sustainable insurance models. The data indicates DeFi lending has entered a mature phase where risks are quantifiable, categorized, and manageable. The actual financial loss relative to the total capital deployed is extremely low, challenging prevailing narratives of systemic risk.

The development of every disruptive fintech inevitably goes through growing pains, and Decentralized Finance (DeFi) is no exception. The early lending markets launched rapidly and expanded aggressively. The industry faced successive security attacks in the public market, then gradually improved code security, collateral asset risk control, oracle mechanisms, liquidation logic, and governance systems.

Past risk cases have reference value but can no longer represent today's mature DeFi ecosystem. After all, those who only look backward often miss current opportunities.

Excluding cross-chain bridge-related security incidents, the current estimated annualized loss rate of funds from theft and malicious attacks for DeFi lending businesses on Ethereum Virtual Machine (EVM) and Solana chains is about 0.03% of the Total Value Locked (TVL). The data for this analysis is aggregated from hack and exploit events flagged on the DeFi Llama platform.

The core criterion for judging security risk is: How large is the actual loss from exploits relative to the amount of capital in the market?

A loss rate of 0.03% roughly equates to the probability of accidental slip-and-fall deaths among the American public. This shows that, setting aside the market's prevalent panic, the actual security risk of DeFi lending businesses is relatively low.

Breakdown of DeFi Security Incidents

As of May 16, 2026, the total amount stolen from all categories of DeFi protocols, according to DeFi Llama statistics, reached $7.751 billion. This statistic has a very broad coverage, encompassing cross-chain bridges, decentralized exchanges (DEX), derivatives protocols, blockchain gaming projects, digital wallets, underlying infrastructure failures, and non-lending DeFi businesses.

Cross-chain bridges are the high-risk area: after removing cross-chain bridge-related security incidents, the total stolen loss in the DeFi sector shrinks to $4.518 billion.

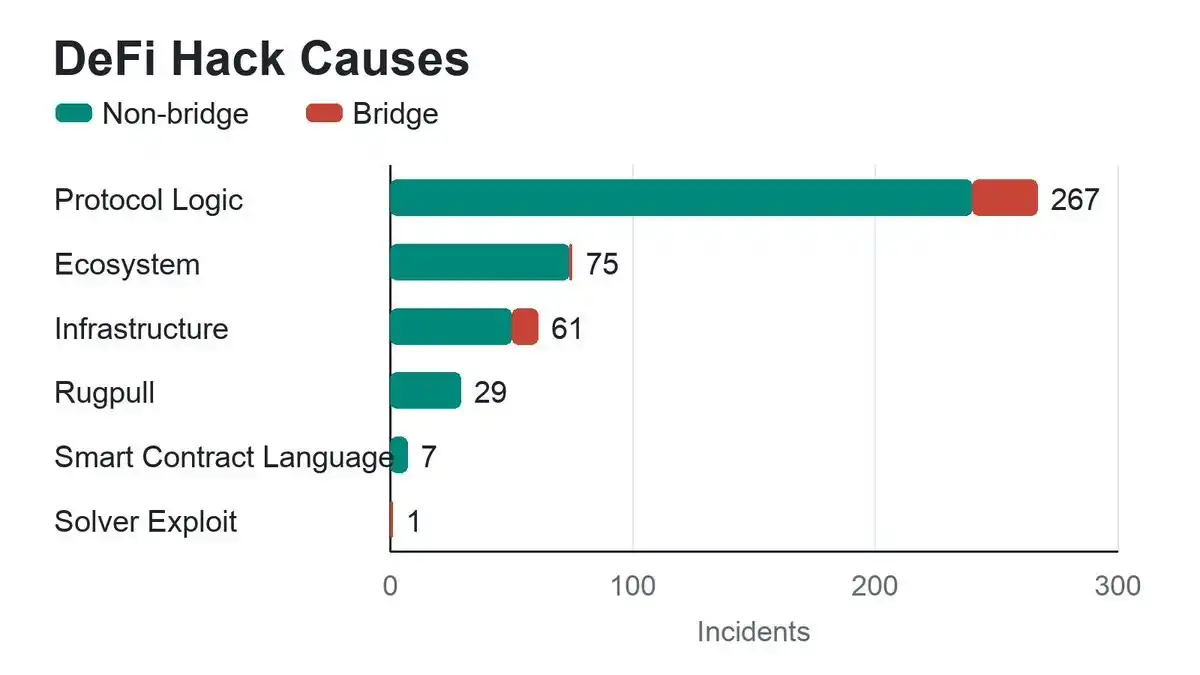
Code executes only the instructions it was written to follow, not the developer's ideal expectations, which is the root cause of various vulnerabilities. Proper risk classification is significant: DeFi is not a single, uniformly risky sector. Cross-chain bridge hacks, DEX oracle manipulations, wallet phishing scams, and lending market collateral asset vulnerabilities are all completely different risk types.

Among all DeFi protocols, lending markets are attacked most frequently, for a very simple reason: large amounts of assets are locked long-term in smart contracts, making them prime targets for hackers.

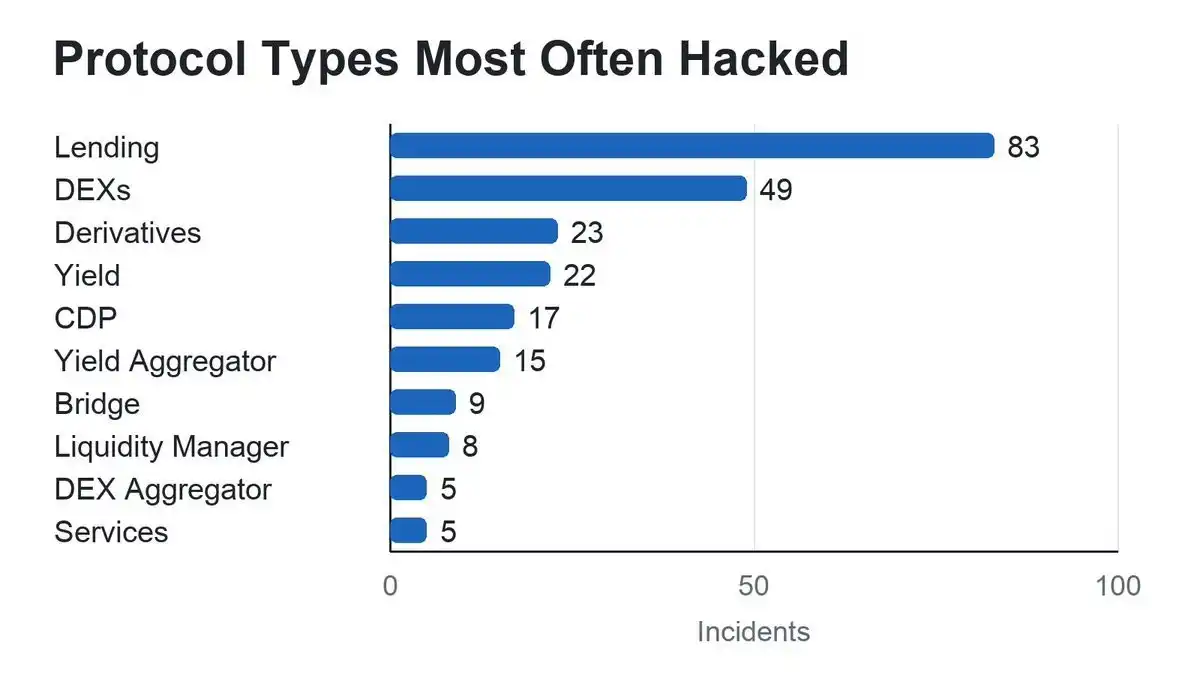
Lending protocols and Automated Market Makers (AMMs) are high-incidence sectors for security incidents, with the core commonality being the need to pool large amounts of assets into smart contracts. Apart from cross-chain bridges, the vast majority of security incidents are concentrated in these two types of protocols. This article will focus on the lending and money market sector for analysis.

Fund Loss Rate Has Greatly Improved

Today's overall DeFi locked volume is far higher than during the early days of frequent vulnerabilities, especially in the lending sector, where project risk control systems are more mature, code audits are more comprehensive, and real-time global risk monitoring is increasingly robust. Excluding cross-chain bridge incidents, the annualized actual stolen loss ratio for lending businesses in the EVM and Solana ecosystems has significantly declined.

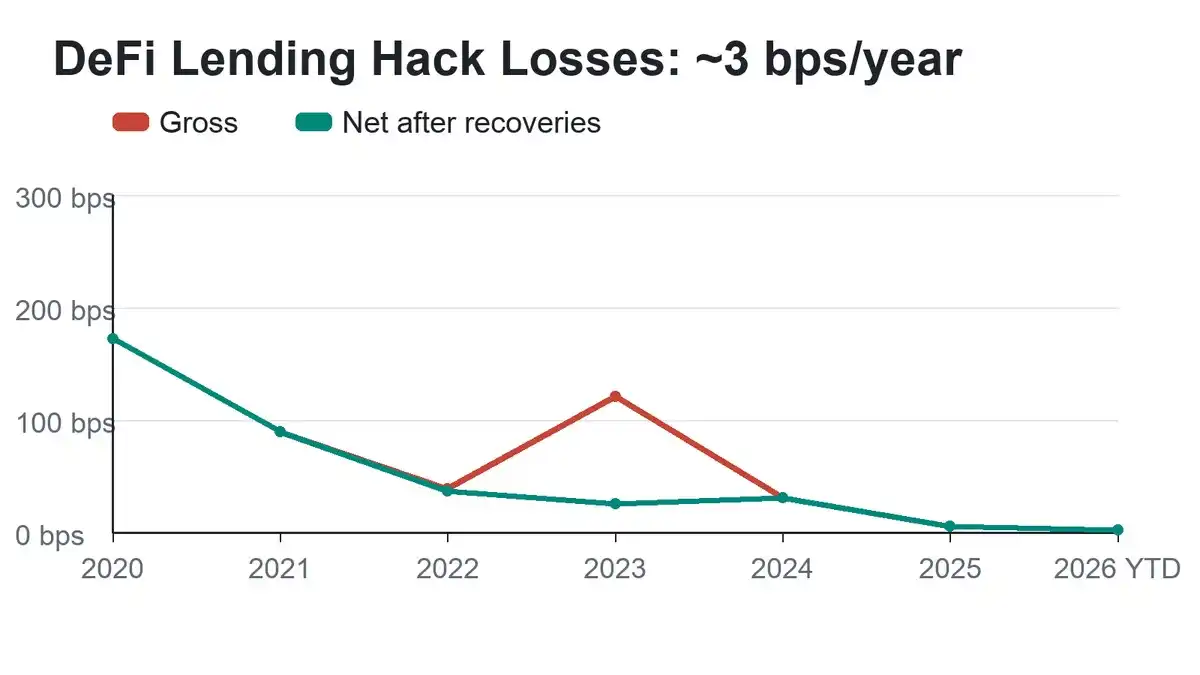
Euler even set a classic risk management case by successfully recovering all stolen assets. The $197 million hack of Euler in 2023 not only saw full recovery but also resulted in a $240 million repatriation due to asset price fluctuations, achieving a positive surplus. This opened the gap between industry book losses and actual recovered amounts.

Taking May 16, 2026, as the cut-off date, statistics from the past year show:

· Total book loss from theft in non-cross-chain lending businesses on EVM and Solana: $30.9 million

· Actual net loss after deducting asset recoveries: $30.1 million

· Average daily locked capital in the lending sector: $99.6 billion

· Book fund loss rate: 3.1 basis points

· Actual net loss rate: 3 basis points

Converted, the annual fund loss remains stable at around 0.03% of the total lending TVL.

The Advantage of Asset Diversification

DeFi security incidents show a clear polarization characteristic: a very small number of extremely large thefts account for the vast majority of the industry's publicly reported total losses. Plotting incident size on a logarithmic scale reveals that the scale of various theft events roughly follows a log-normal distribution. Intuitively, the losses caused by the vast majority of security incidents are relatively small, with high-value mega-thefts concentrated in only a few extreme cases.

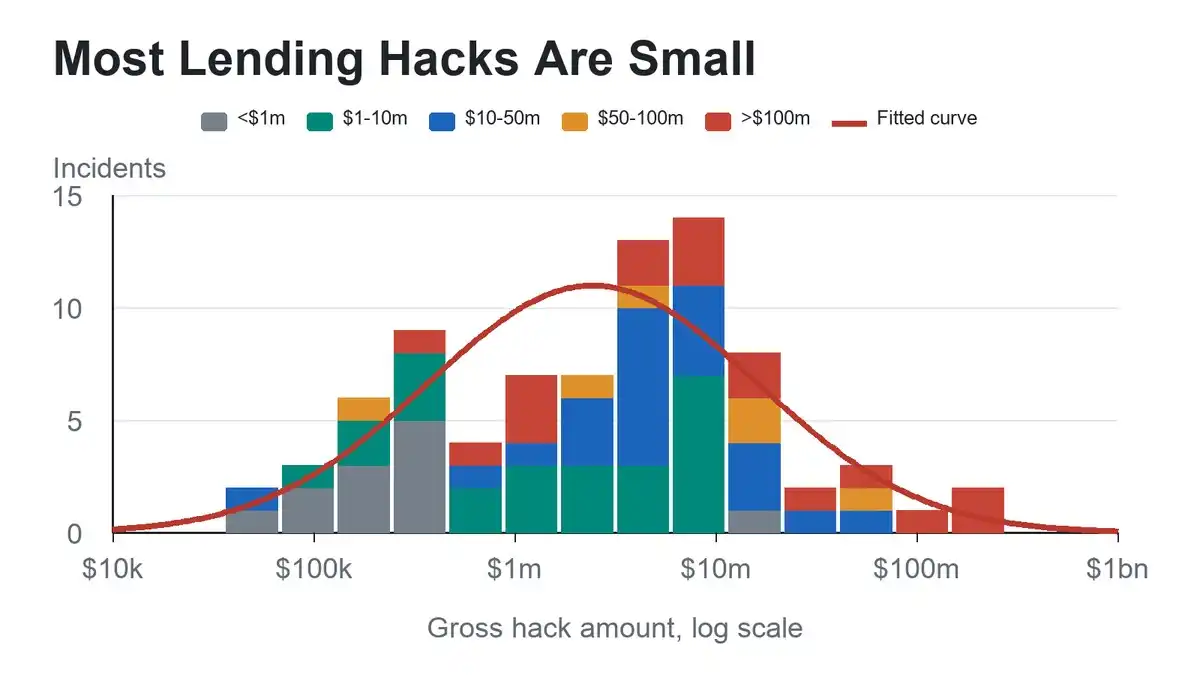
Although ChatGPT has raised differing views, I believe this data strongly demonstrates that portfolio diversification is an excellent method for crime prevention.

From the perspective of risk transfer and commercial insurance, this data model also provides reasonable support for the industry's security insurance business. Insurance institutions can set single-claim payout limits for different protocols to carry out underwriting business in an orderly manner.

Furthermore, the vast majority of theft incidents have limited impact, far from enough to shake the entire capital base of the lending sector. And the larger the overall sector volume, the smaller the impact of a single security event on the whole.

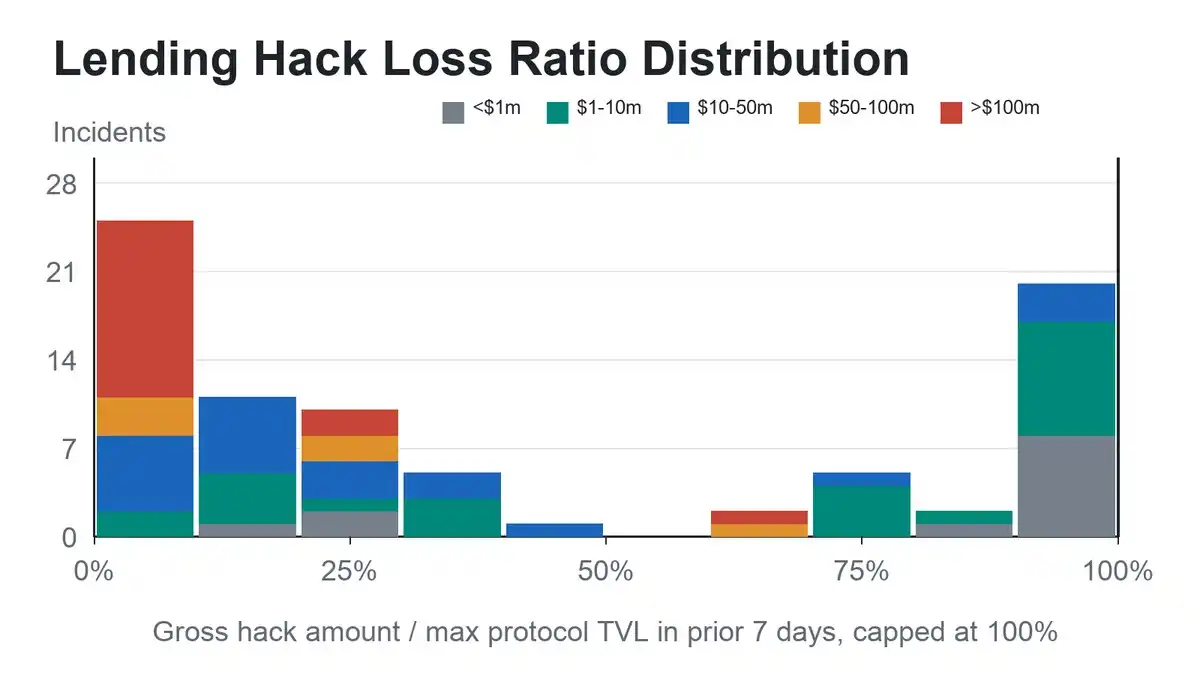
Note: In some theft incidents, the loss amount appears to exceed the project's own TVL. Such cases are uniformly counted as 100% loss.

There are two main reasons for this data discrepancy: first, a time lag exists between the TVL snapshot and the security incident, during which asset volume changed; second, DeFi Llama's TVL statistical scope is inconsistent with the actual assets at risk.

Although this measurement method is not absolutely perfect, it is sufficient to clearly reflect the industry's status quo: the vast majority of exploit attacks only affect a single business module within a lending protocol, with full asset compromise being extremely rare, especially for large, top-tier projects. This research data also provides a key basis for DeFi industry risk hedging and secure asset custody services.

Asset Recovery Capability is Crucial

Asset recovery has also significantly improved the actual risk profile of the DeFi lending sector.

Looking at the all-category DeFi theft data from DeFi Llama, the overall industry asset recovery amount accounts for about 8% of the total book loss; after excluding cross-chain bridge incidents, the asset recovery ratio is higher in the EVM and Solana lending sectors, reaching about 20% of the book loss.

Asset recovery success rates are generally higher for theft cases occurring in regions with well-developed legal systems and mature regulatory governance. This phenomenon also hints at industry implications related to access permissions.

Positive Industry Outlook

Today, the security risks of the DeFi lending sector have become quantifiable and classifiable, with the actual fund loss ratio continuing to decline. Data proves the industry has entered a mature development stage: the actual loss from exploit theft is extremely low relative to the sector's massive capital stock, various risks are clearly distinguishable, and risk boundaries are increasingly transparent.

In conclusion, there's no need to be swayed by external pessimistic narratives. Data and facts are enough to confirm the true risk level of the DeFi lending sector.

Related Questions

QAccording to the article, what is the estimated annual loss rate due to hacks and malicious attacks for DeFi lending businesses on EVM and Solana, after excluding cross-chain bridge incidents?

AThe estimated annual loss rate is approximately 0.03% of the Total Value Locked (TVL).

QWhich two types of DeFi protocols are highlighted as having the highest frequency of security incidents, aside from cross-chain bridges?

ALending markets and Automated Market Makers (AMMs) are highlighted as having the highest frequency of security incidents.

QWhat was the outcome of the 2023 Euler hack mentioned in the article, and how did it impact the overall loss figures?

AThe 2023 Euler hack resulted in the successful full recovery of the stolen $197 million. Due to asset price fluctuations, $240 million was ultimately recovered, creating a positive surplus and widening the gap between book losses and actual recovered amounts.

QWhat key advantage does the article associate with diversifying investments across different DeFi protocols?

AThe article states that diversifying investments is an excellent method for crime prevention, as it mitigates the impact of any single security incident on the overall portfolio.

QHow does the asset recovery rate for EVM and Solana lending protocols compare to the overall DeFi industry average, according to the data presented?

AAfter excluding cross-chain bridge incidents, the asset recovery rate for EVM and Solana lending protocols is around 20% of book losses, which is higher than the overall DeFi industry average recovery rate of about 8%.

Related Reads

Fei-Fei Li's Team Clarifies the Concept of 'World Models', Sora Merely a Renderer

"World Models" has become a widely used yet confusing term in AI. To address this, a team led by Fei-Fei Li and World Labs proposed a functional taxonomy based on the Partially Observable Markov Decision Process framework. This taxonomy categorizes systems called "world models" into three distinct projections: Renderers, Simulators, and Planners. Renderers, like OpenAI's Sora and other video generation models, focus on producing photorealistic visual outputs for human perception. They prioritize visual fidelity over physical accuracy. Simulators, such as NVIDIA Omniverse, aim to compute precise future environmental states for computational tasks like engineering analysis or digital twins. Planners, like Vision-Language-Action models, take in observations and goals to output executable actions for robots or agents. The article clarifies that most current "world models," including Sora, are primarily Renderers. They generate convincing visuals but lack the core ability to simulate state transitions based on actions, a key requirement for a true world model in classic reinforcement learning definitions. This conceptual confusion has practical implications, leading to potential misalignment in technology selection, investment, and public understanding of AI capabilities. Clear categorization is crucial. It helps enterprises avoid costly mistakes (e.g., using a renderer for robot training), allows investors to accurately assess markets, and enables researchers to build comparable benchmarks. While future systems may integrate these functions, recognizing current boundaries is essential for honest assessment and progress.

marsbit37m ago

Fei-Fei Li's Team Clarifies the Concept of 'World Models', Sora Merely a Renderer

marsbit37m ago

Bloomberg Uncovered: How Do China's Wealthy Circumvent the Annual $50,000 Limit to Transfer Assets?

**Summary: How Wealthy Chinese Circumvent $50,000 Annual Foreign Exchange Limits** Despite China's strict capital controls, including an annual $50,000 per person foreign exchange quota, an estimated $150 billion in funds still leaves the country annually via various gray and underground channels. This report outlines the evolution of China's "capital wall" and the methods used to bypass it. **The Evolving Capital Controls:** * **Foundation (1994):** The system of "current account convertibility with strict capital account controls" was established. * **Quota Set (2007):** The $50,000 individual annual forex purchase limit was formalized. * **Crackdown Begins (2015-2017):** Following market volatility, enforcement tightened. Banks were required to scrutinize transactions, and channels like using UnionPay cards for Hong Kong insurance premiums or buying overseas property were blocked. * **Digital & Legal Upgrades (2024-2026):** Enhanced algorithms now flag suspicious patterns (e.g., "smurfing"). The Common Reporting Standard (CRS) provides Chinese tax authorities with data on citizens' offshore accounts. Unlicensed cross-border brokers have been targeted. **Five Primary Methods for Moving Capital:** 1. **Underground Banking / "Hawala" (Duiqiao):** The largest-scale method. No money crosses borders. Clients pay RMB to a domestic account; an overseas associate deposits equivalent foreign currency into the client's offshore account. Risks include high fees, account freezes, and legal penalties. 2. **"Smurfing" or "Ant Moving":** Using multiple individuals' $50,000 quotas to pool funds for one offshore recipient. Increasingly detected by anti-money laundering algorithms. 3. **Trade Invoice Manipulation:** Businesses over-invoice imports or under-invoice exports via offshore shell companies, creating a pretext to transfer excess funds abroad under the guise of trade. 4. **Channel Migration:** After a crackdown on internet brokers, funds flow toward more compliant but costly channels like major banks' cross-border wealth management services or Qualified Domestic Institutional Investor (QDII) quotas. 5. **Structural Arrangements:** High-net-worth individuals use complex, high-cost legal structures involving offshore trusts, insurance, and investment migration programs to transfer asset ownership. **Regulatory Response: Focusing on People, Not Just Money** The current strategy extends oversight from enterprises to **individual residents**. Tools like CRS allow retroactive visibility into offshore assets. Cryptocurrencies, once seen as a potential loophole, are now actively monitored and prosecuted as an illegal channel. The underlying driver remains: with significant wealth concentrated among millions of affluent households seeking diversification amid domestic economic shifts, the incentive to move assets offshore persists despite regulatory barriers.

marsbit57m ago

Bloomberg Uncovered: How Do China's Wealthy Circumvent the Annual $50,000 Limit to Transfer Assets?

marsbit57m ago

Trading

Spot
Futures
活动图片