Chainlink demand surges as withdrawals reach 2 mln LINK: Will this boost price?

ambcryptoPublished on 2026-03-25Last updated on 2026-03-25

Abstract

Chainlink (LINK) is experiencing a surge in investor demand, with over 2.046 million tokens withdrawn from exchange reserves in the past month, signaling potential accumulation and a bullish sentiment. Despite a modest monthly gain of 3.75%, LINK saw a 7.15% price increase in 24 hours, trading at $9.20, accompanied by a 65% surge in trading volume to $952.83 million. Analytics data indicates long-term holder interest, with exchange reserves dropping significantly. Derivatives data shows traders favoring long positions, with bulls dominating. Technically, LINK is moving within an ascending channel pattern. After a recent dip to the lower boundary, a bullish engulfing candle suggests a potential reversal. If LINK holds above $8.576, a 10% rise to $10.08 is possible, with further upside toward $11.20 if key resistance is broken. The RSI at 52.03 indicates growing buying interest and a shift toward bullish territory.

Demand for Chainlink [LINK] among investors is rising significantly, even though its price remains stagnant.

Crypto tracker CoinMarketCap showed that LINK gained a modest 3.75% over the past month, with the asset fluctuating within a range, reaching a high of $10 and a low of $8.17 during this period.

As the broader market exhibited signs of recovery, LINK jumped 7.15% over the past 24 hours, trading at the $9.20 level at press time.

Along with the price increase, market participation has also risen, as reflected in trading volume, which has surged by over 65% to $952.83 million.

This rise in trading volume not only indicates higher market activity but also suggests that investors and traders are showing strong interest in the current trend.

Analytics and derivatives data signal bullish sentiment

Analytics tool CryptoQuant shows that long-term investors are highly interested in LINK.

According to the latest data, over 2.046 million LINK tokens have been withdrawn from exchange reserves over the past month, as reflected in a significant decline from 129.427 million on the 24th of February to 127.381 million on the 24th of March 2026.

Whereas, in the past week, a massive drop of 951,000 LINK has been recorded in exchange reserves, indicating that LINK is in high demand among holders.

Source: CryptoQuant

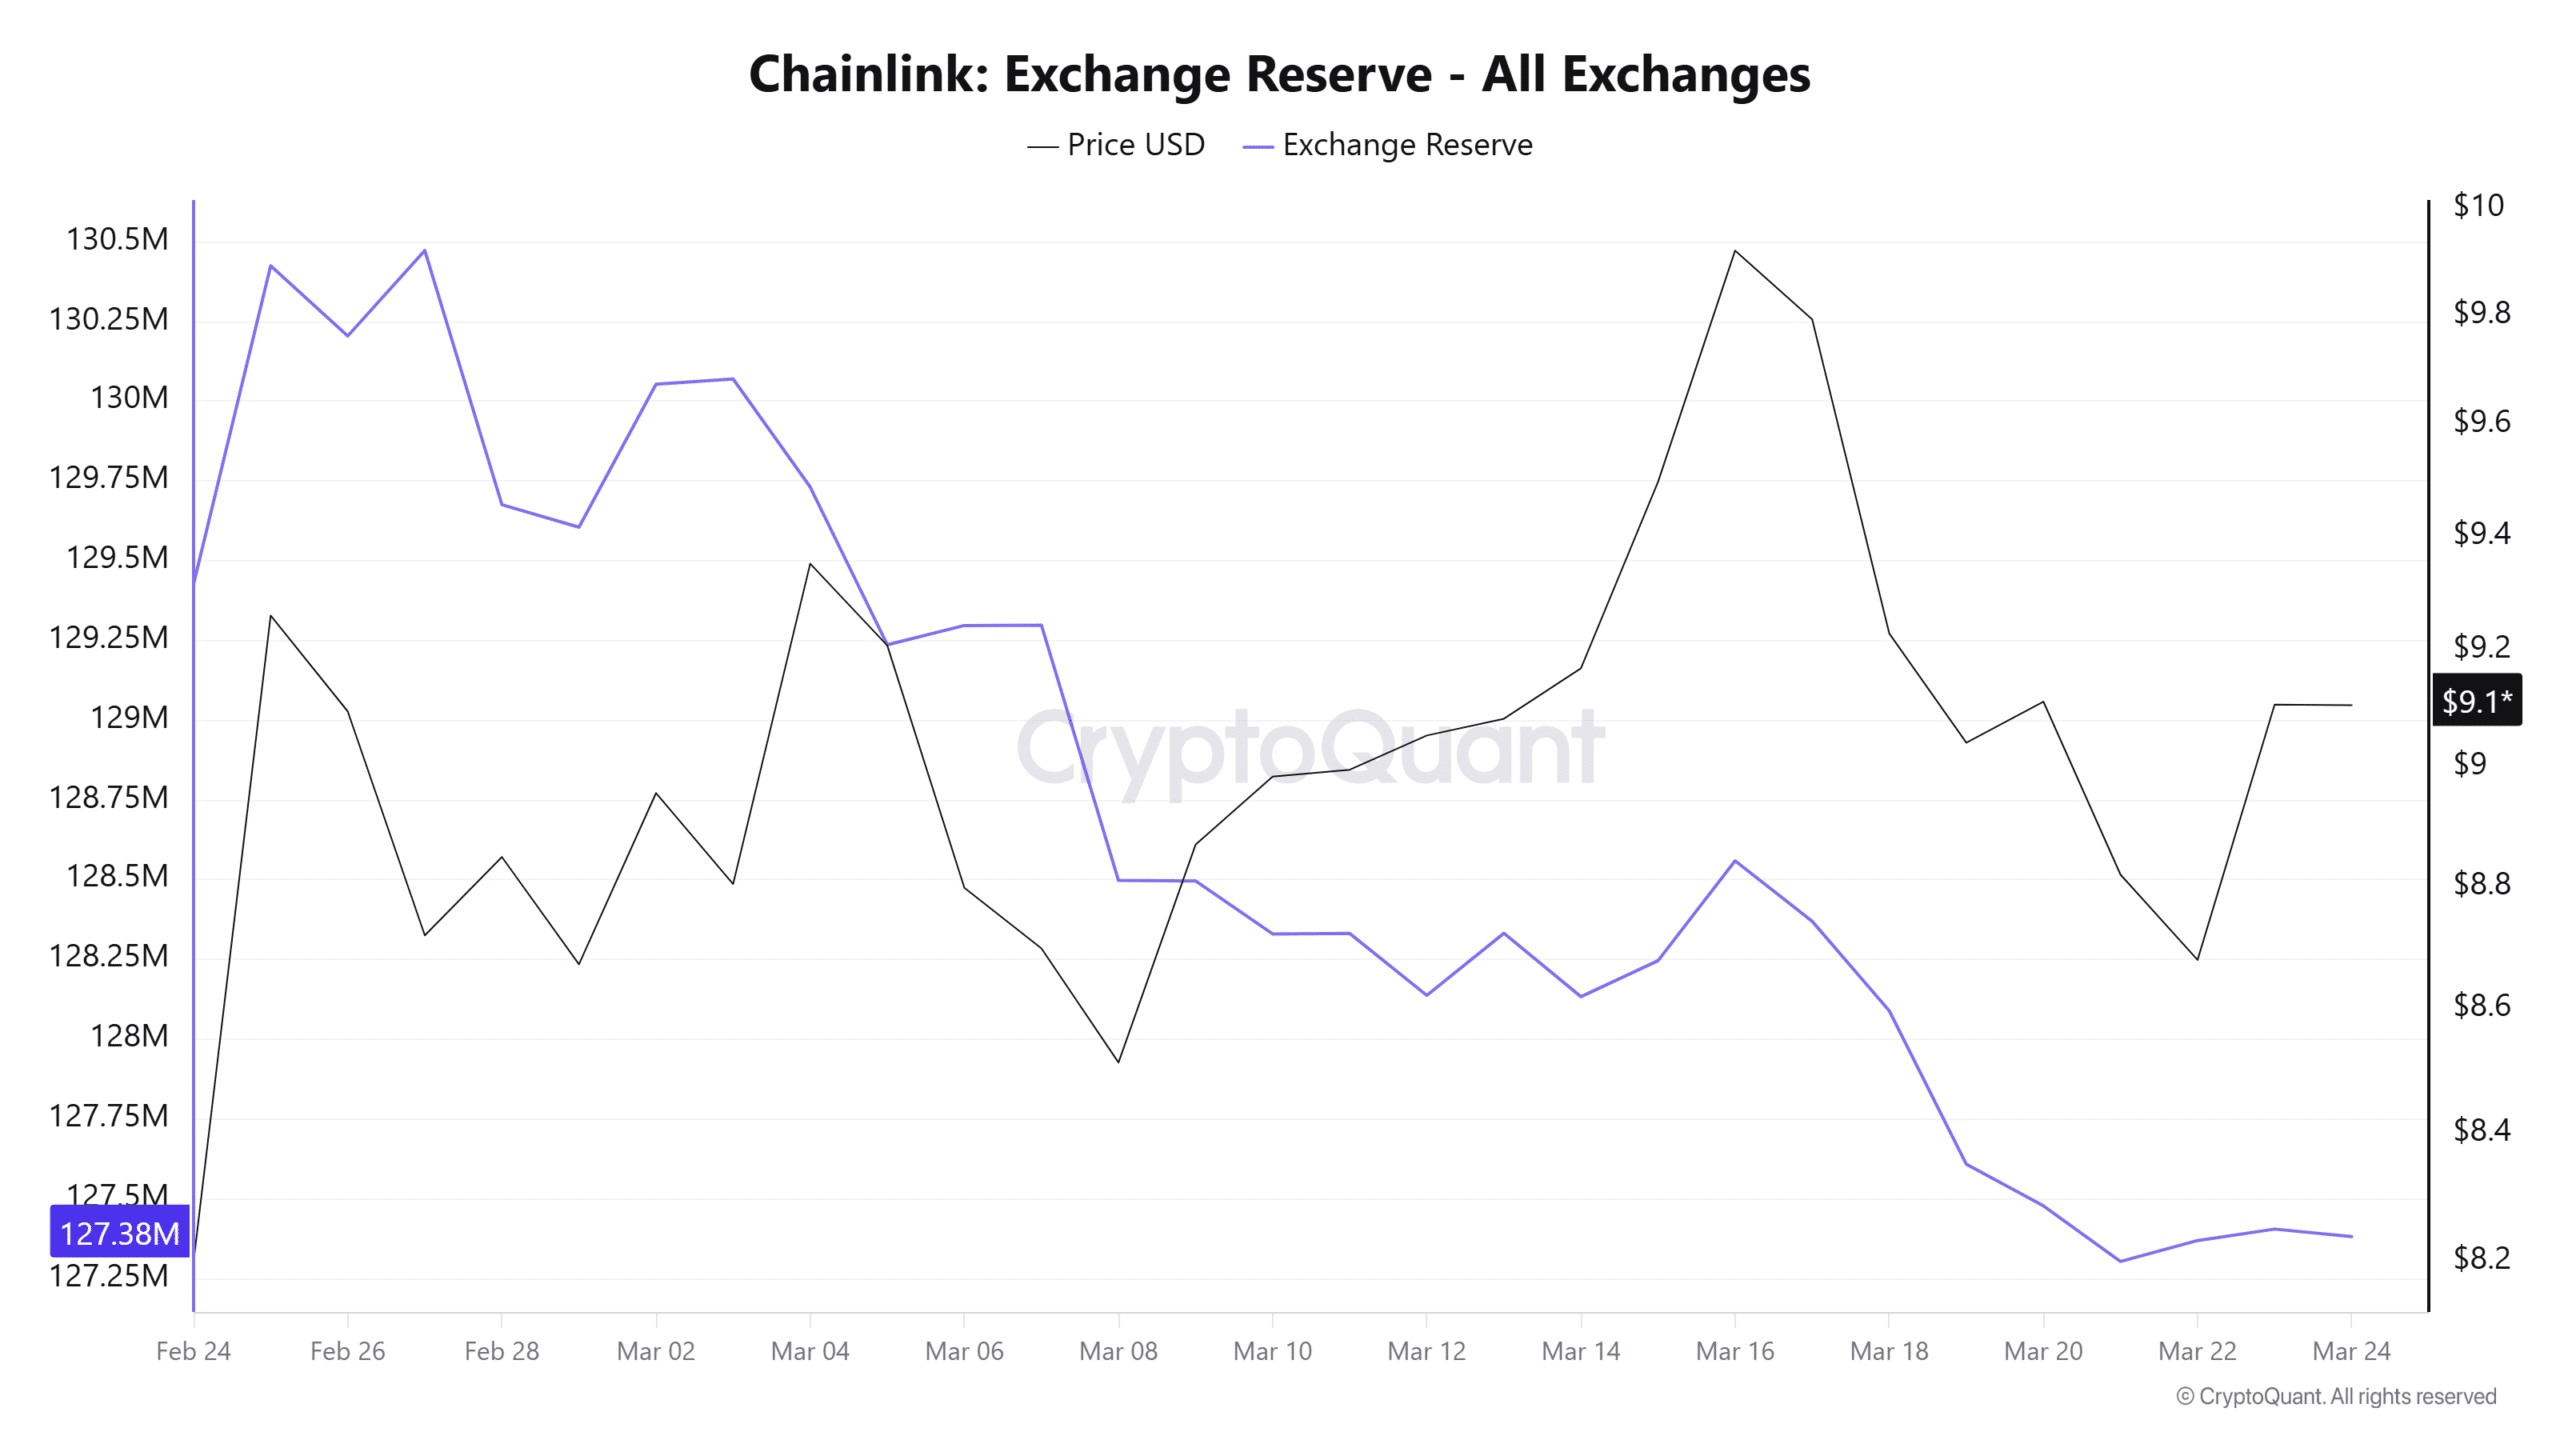
Falling exchange reserves of any asset typically suggest potential accumulation, as holders tend to move assets from exchanges to their wallets, which is generally considered a bullish signal.

However, this potential accumulation over the past month and in recent weeks also raises questions about whether the current level is an ideal buying zone or not.

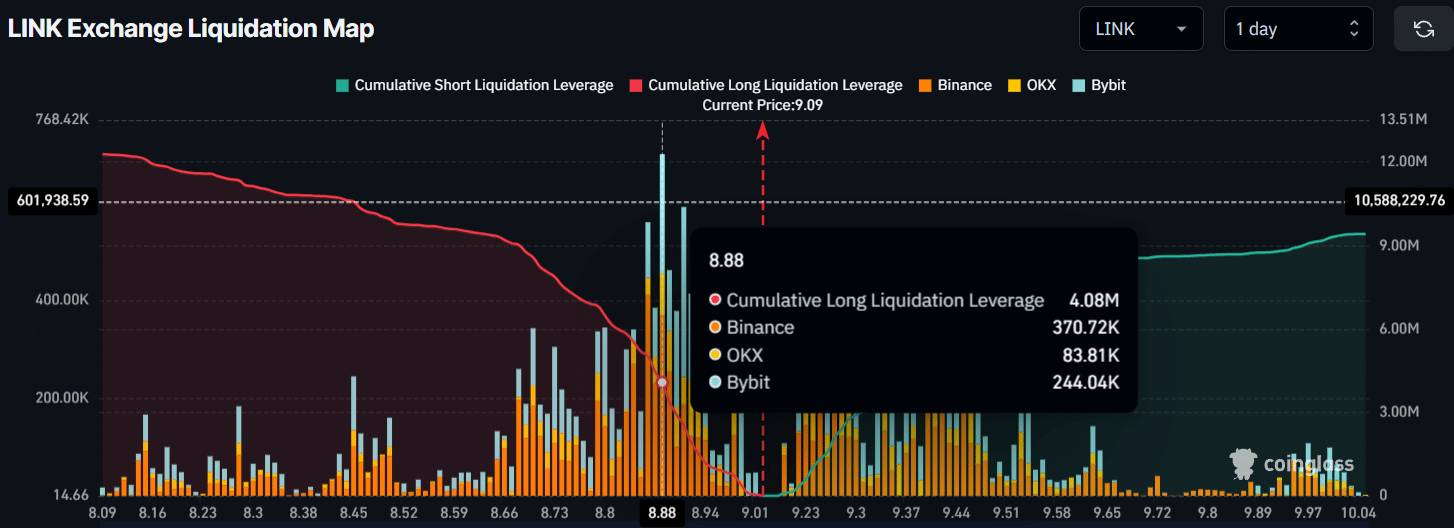
According to the derivatives analytics tool CoinGlass, intraday traders are currently following the trend, as they are eyeing long-leveraged positions. As per the data, $8.88 on the lower side and $9.27 on the upper side are the major liquidation levels from the current price.

Traders at these levels have built $4.08 million worth of long-leveraged positions and $2.10 million in short-leveraged positions, indicating that bulls are dominating the asset, while short sellers appear to be losing interest.

Source: CoinGlass

LINK: Price action eyes 10% jump

On the daily chart, LINK appeared to be moving within an ascending channel pattern between the upper and lower boundaries.

Following a recent dip of 14.65% between the 16th and the 23rd of March, the price declined to the lower boundary, where it formed a bullish engulfing candle, suggesting that LINK may be on the verge of a reversal in the coming days.

Source: TradingView

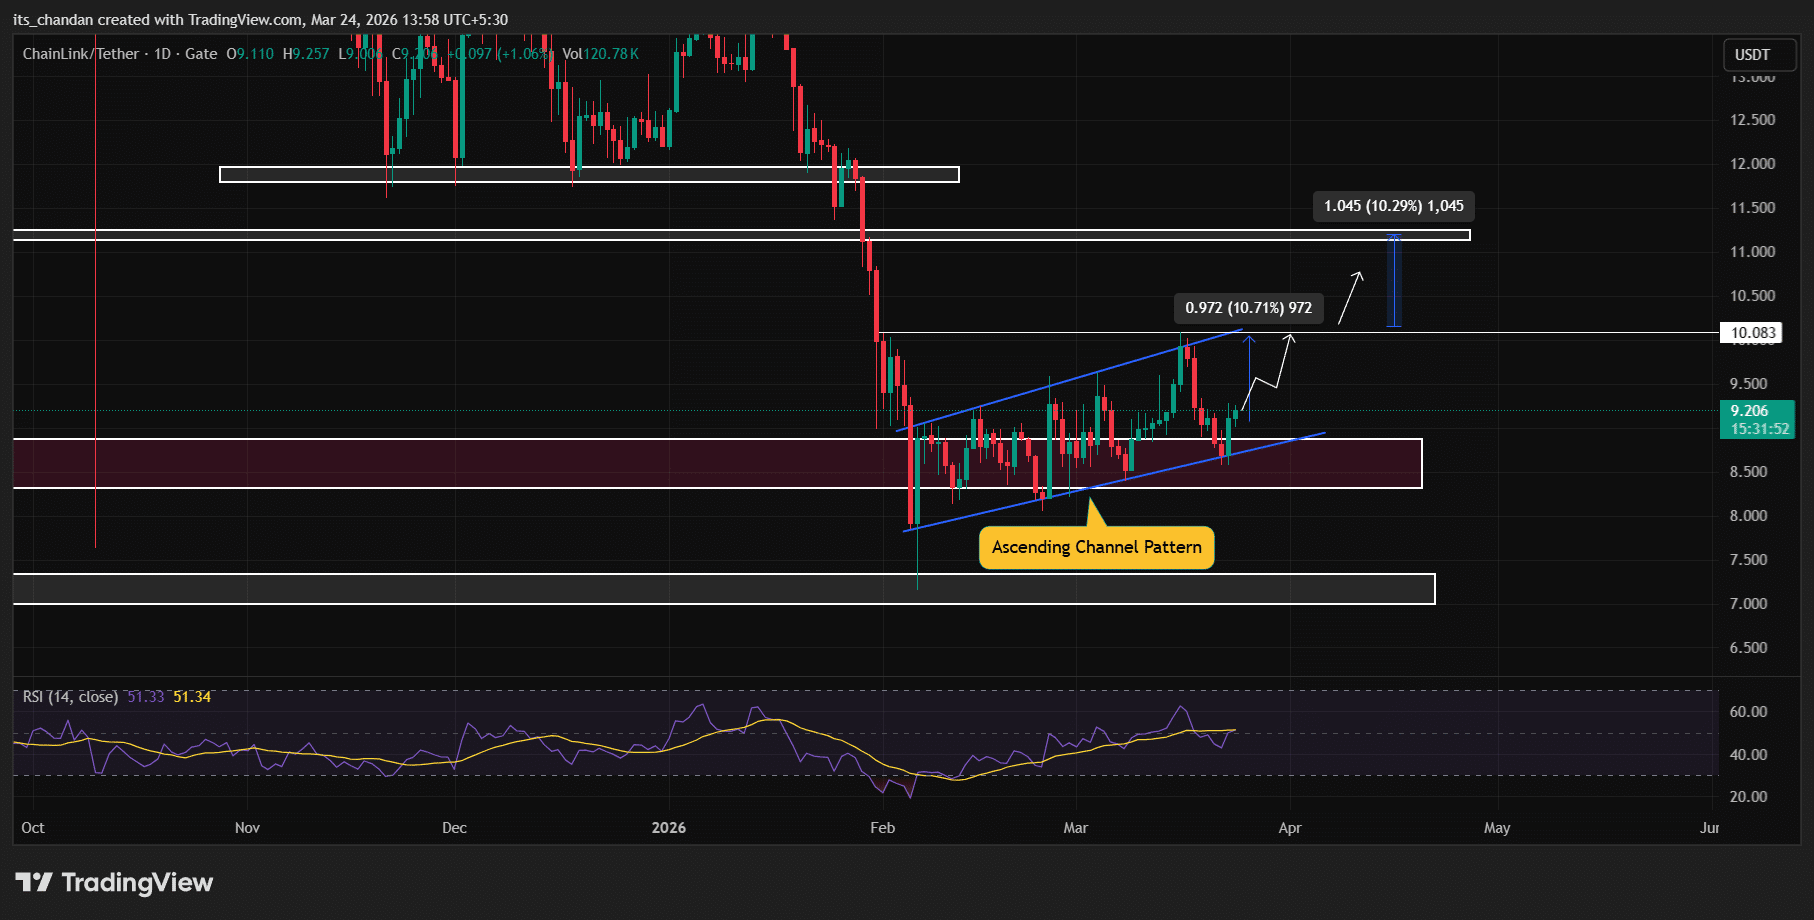
Based on the current price action, if LINK remains above the upper boundary and the $8.576 level (the low of the engulfing candle), it could see a price jump of 10% and potentially reach the $10.08 level.

Further upside is also possible; however, $10.08 has been a key resistance level since the 1st of February. If LINK clears this level, another 10% rally could occur, potentially pushing the price toward $11.20.

As of now, Chainlink appears to be recovering as the Relative Strength Index (RSI) on the daily chart reaches 52.03, indicating a shift toward bullish territory and growing buying interest, with the asset gaining strength above the neutral 50 level.


Final Summary

  • Exchange reserves have declined by 2.046 million tokens over the past 30 days, indicating strong demand.
  • The daily chart shows that LINK is moving in an ascending channel pattern. After testing the lower boundary, it may see another 10% price jump in the coming days.

Related Questions

QWhat is the main reason for the surge in Chainlink (LINK) demand according to the article?

AThe main reason for the surge in Chainlink (LINK) demand is the significant withdrawal of tokens from exchange reserves, with over 2.046 million LINK tokens being removed over the past month, indicating strong accumulation by long-term investors.

QHow much did LINK's trading volume increase by, and what does this suggest?

ALINK's trading volume surged by over 65% to $952.83 million. This increase suggests higher market activity and indicates that investors and traders are showing strong interest in the current trend.

QWhat does the formation of a bullish engulfing candle on the daily chart indicate for LINK's price?

AThe formation of a bullish engulfing candle on the daily chart, after the price declined to the lower boundary of its ascending channel, suggests that LINK may be on the verge of a reversal and a potential price jump in the coming days.

QWhat are the key price levels that traders are watching for potential liquidation, according to CoinGlass data?

AAccording to CoinGlass data, the key liquidation levels from the current price are $8.88 on the lower side and $9.27 on the upper side.

QWhat is the potential price target for LINK if it breaks above the key resistance level of $10.08?

AIf LINK breaks above the key resistance level of $10.08, it could see another 10% rally, potentially pushing the price toward $11.20.

Related Reads

Trading

Spot
Futures

Hot Articles

How to Buy LINK

Welcome to HTX.com! We've made purchasing ChainLink (LINK) simple and convenient. Follow our step-by-step guide to embark on your crypto journey.Step 1: Create Your HTX AccountUse your email or phone number to sign up for a free account on HTX. Experience a hassle-free registration journey and unlock all features.Get My AccountStep 2: Go to Buy Crypto and Choose Your Payment MethodCredit/Debit Card: Use your Visa or Mastercard to buy ChainLink (LINK) instantly.Balance: Use funds from your HTX account balance to trade seamlessly.Third Parties: We've added popular payment methods such as Google Pay and Apple Pay to enhance convenience.P2P: Trade directly with other users on HTX.Over-the-Counter (OTC): We offer tailor-made services and competitive exchange rates for traders.Step 3: Store Your ChainLink (LINK)After purchasing your ChainLink (LINK), store it in your HTX account. Alternatively, you can send it elsewhere via blockchain transfer or use it to trade other cryptocurrencies.Step 4: Trade ChainLink (LINK)Easily trade ChainLink (LINK) on HTX's spot market. Simply access your account, select your trading pair, execute your trades, and monitor in real-time. We offer a user-friendly experience for both beginners and seasoned traders.

8.2k Total ViewsPublished 2024.03.29Updated 2025.06.26

How to Buy LINK

Discussions

Welcome to the HTX Community. Here, you can stay informed about the latest platform developments and gain access to professional market insights. Users' opinions on the price of LINK (LINK) are presented below.

活动图片