Bitcoin ‘Record’ LTH Selling Inflated By Exchange Transfers, CryptoQuant Head Says

bitcoinistPublished on 2026-01-07Last updated on 2026-01-07

Abstract

CryptoQuant's head of research, Julio Moreno, clarifies that the recent record-high Bitcoin long-term holder (LTH) selling was significantly inflated by internal exchange transfers. While the 30-day LTH spending reached 1.55 million BTC in November, approximately 0.65 million BTC of that was due to internal wallet movements within Coinbase, not actual economic selling. After adjusting for these transactions, the adjusted LTH distribution peaked at 0.9 million BTC, making it the fifth highest on record rather than a new all-time high. This pattern of internal transfers exaggerating LTH selling has occurred before, notably in December 2018. Despite the selloff, Bitcoin's price remained strong at around $93,800, up 7% over the past week.

CryptoQuant’s head of research has highlighted how the recent high levels of Bitcoin HODLer selling were inflated by internal exchange moves.

Recent Bitcoin Long-Term Holder Selling Hasn’t Been At True Record Levels

In a new post on X, CryptoQuant head of research, Julio Moreno, has talked about the recent selloff from the Bitcoin long-term holders (LTHs). The LTHs refer to investors who have been holding onto their coins for a period longer than 155 days. Statistically, the longer an investor keeps their tokens dormant, the less likely they are to sell them at any point. As such, the LTHs with their long holding times are considered to include the resolute hands of the market that are unlikely to part with their coins.

That said, there are times when these diamond hands do take to selling. One major such selloff occurred in November of this year, as the chart shared by Moreno shows.

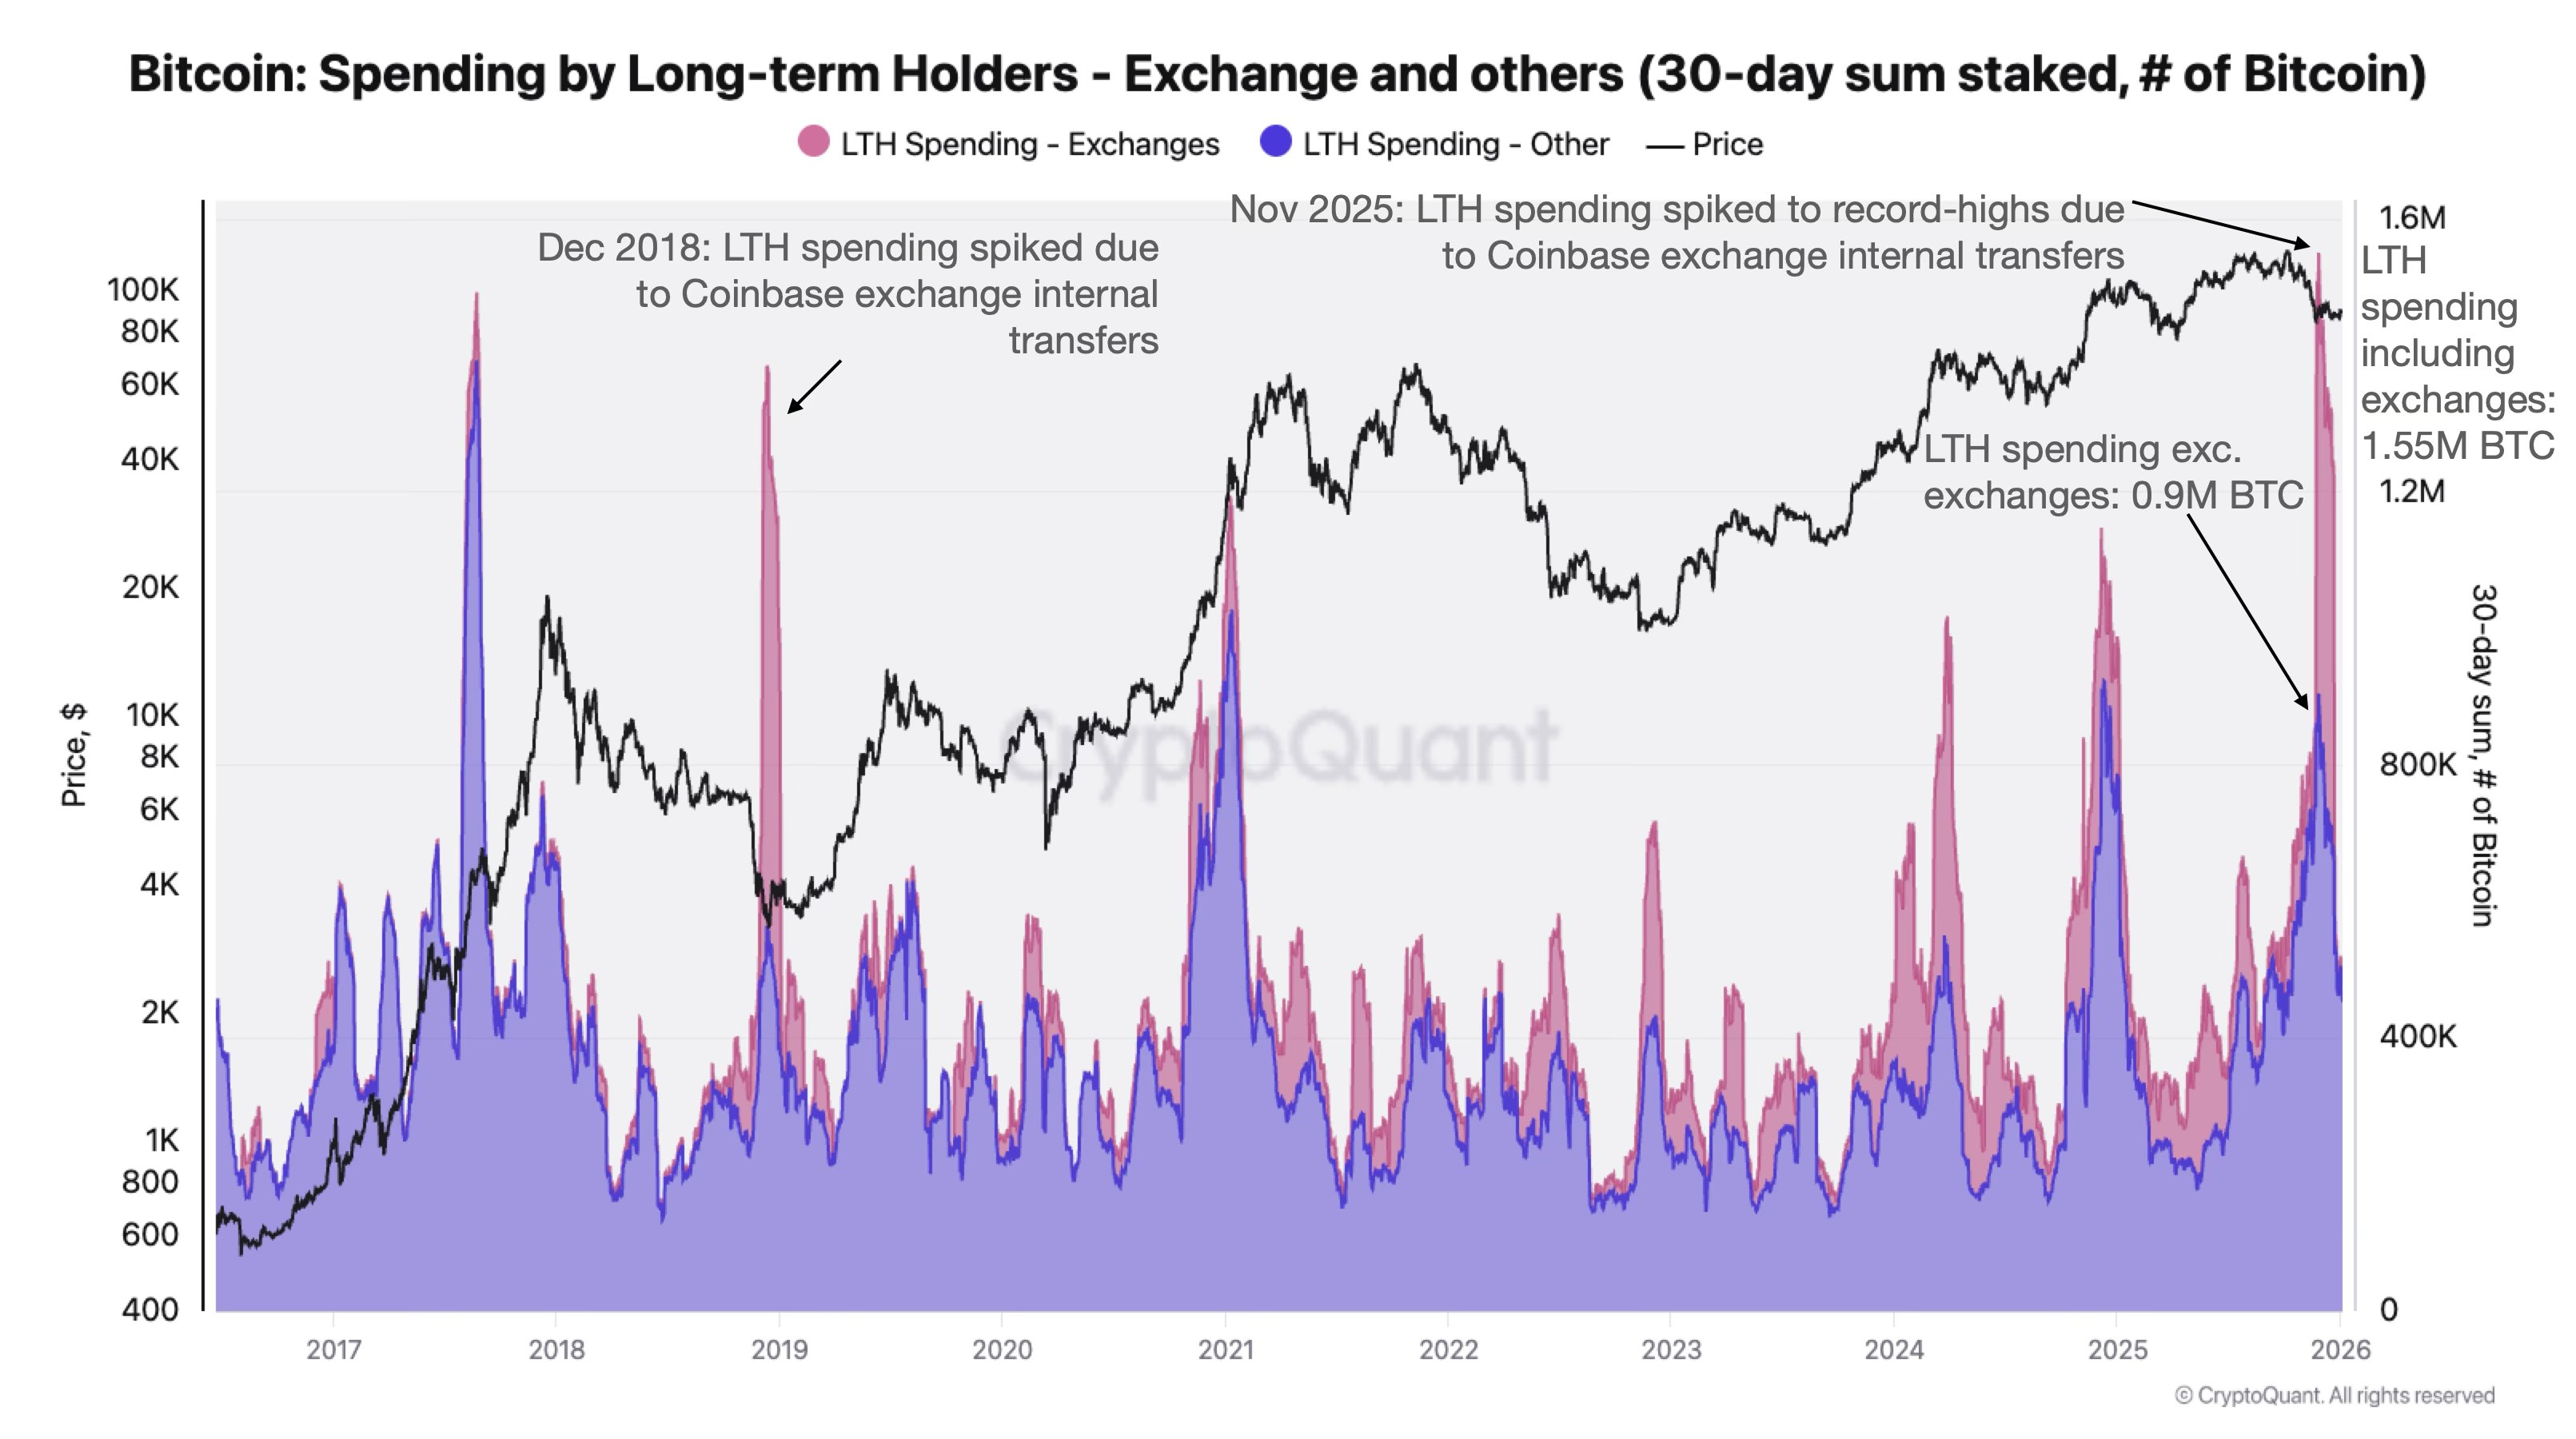
The trend in the spending done by the BTC LTHs over the past decade | Source: @jjcmoreno on X

At the height of the Bitcoin LTH distribution in November, the 30-day sum of spending hit a record high of 1.55 million BTC. The analyst has pointed out, however, that this figure doesn’t tell the entire story.

The value of the LTH distribution doesn’t exclude sources that don’t correspond to economic transactions. For example, internal wallet moves. It turns out that such transfers skewed the market picture notably this time around. “A significant portion of LTH spending was due to exchange internal transactions,” explained Moreno.

According to CryptoQuant data, at least 0.65 million of the “HODLer selling” actually corresponded to internal wallet shuffling from cryptocurrency exchange Coinbase. Thus, the distribution from the group didn’t quite reach the levels that could be considered as new records.

This wasn’t the first time that internal exchange transactions exaggerated LTH selling. As is visible in the chart, there was a sharp spike in Coinbase’s internal transfers of LTH-aged coins back in December 2018 as well.

While adjusting for internal Coinbase shuffling lessens the scale of the latest diamond hand selloff, it doesn’t quite eliminate it. The monthly LTH spending still hit a notable level of 0.9 million BTC at the peak in November.

The only time in the current cycle that the metric exceeded this mark was in December 2024. In fact, as the chart below displays, this selloff was the fifth highest on record.

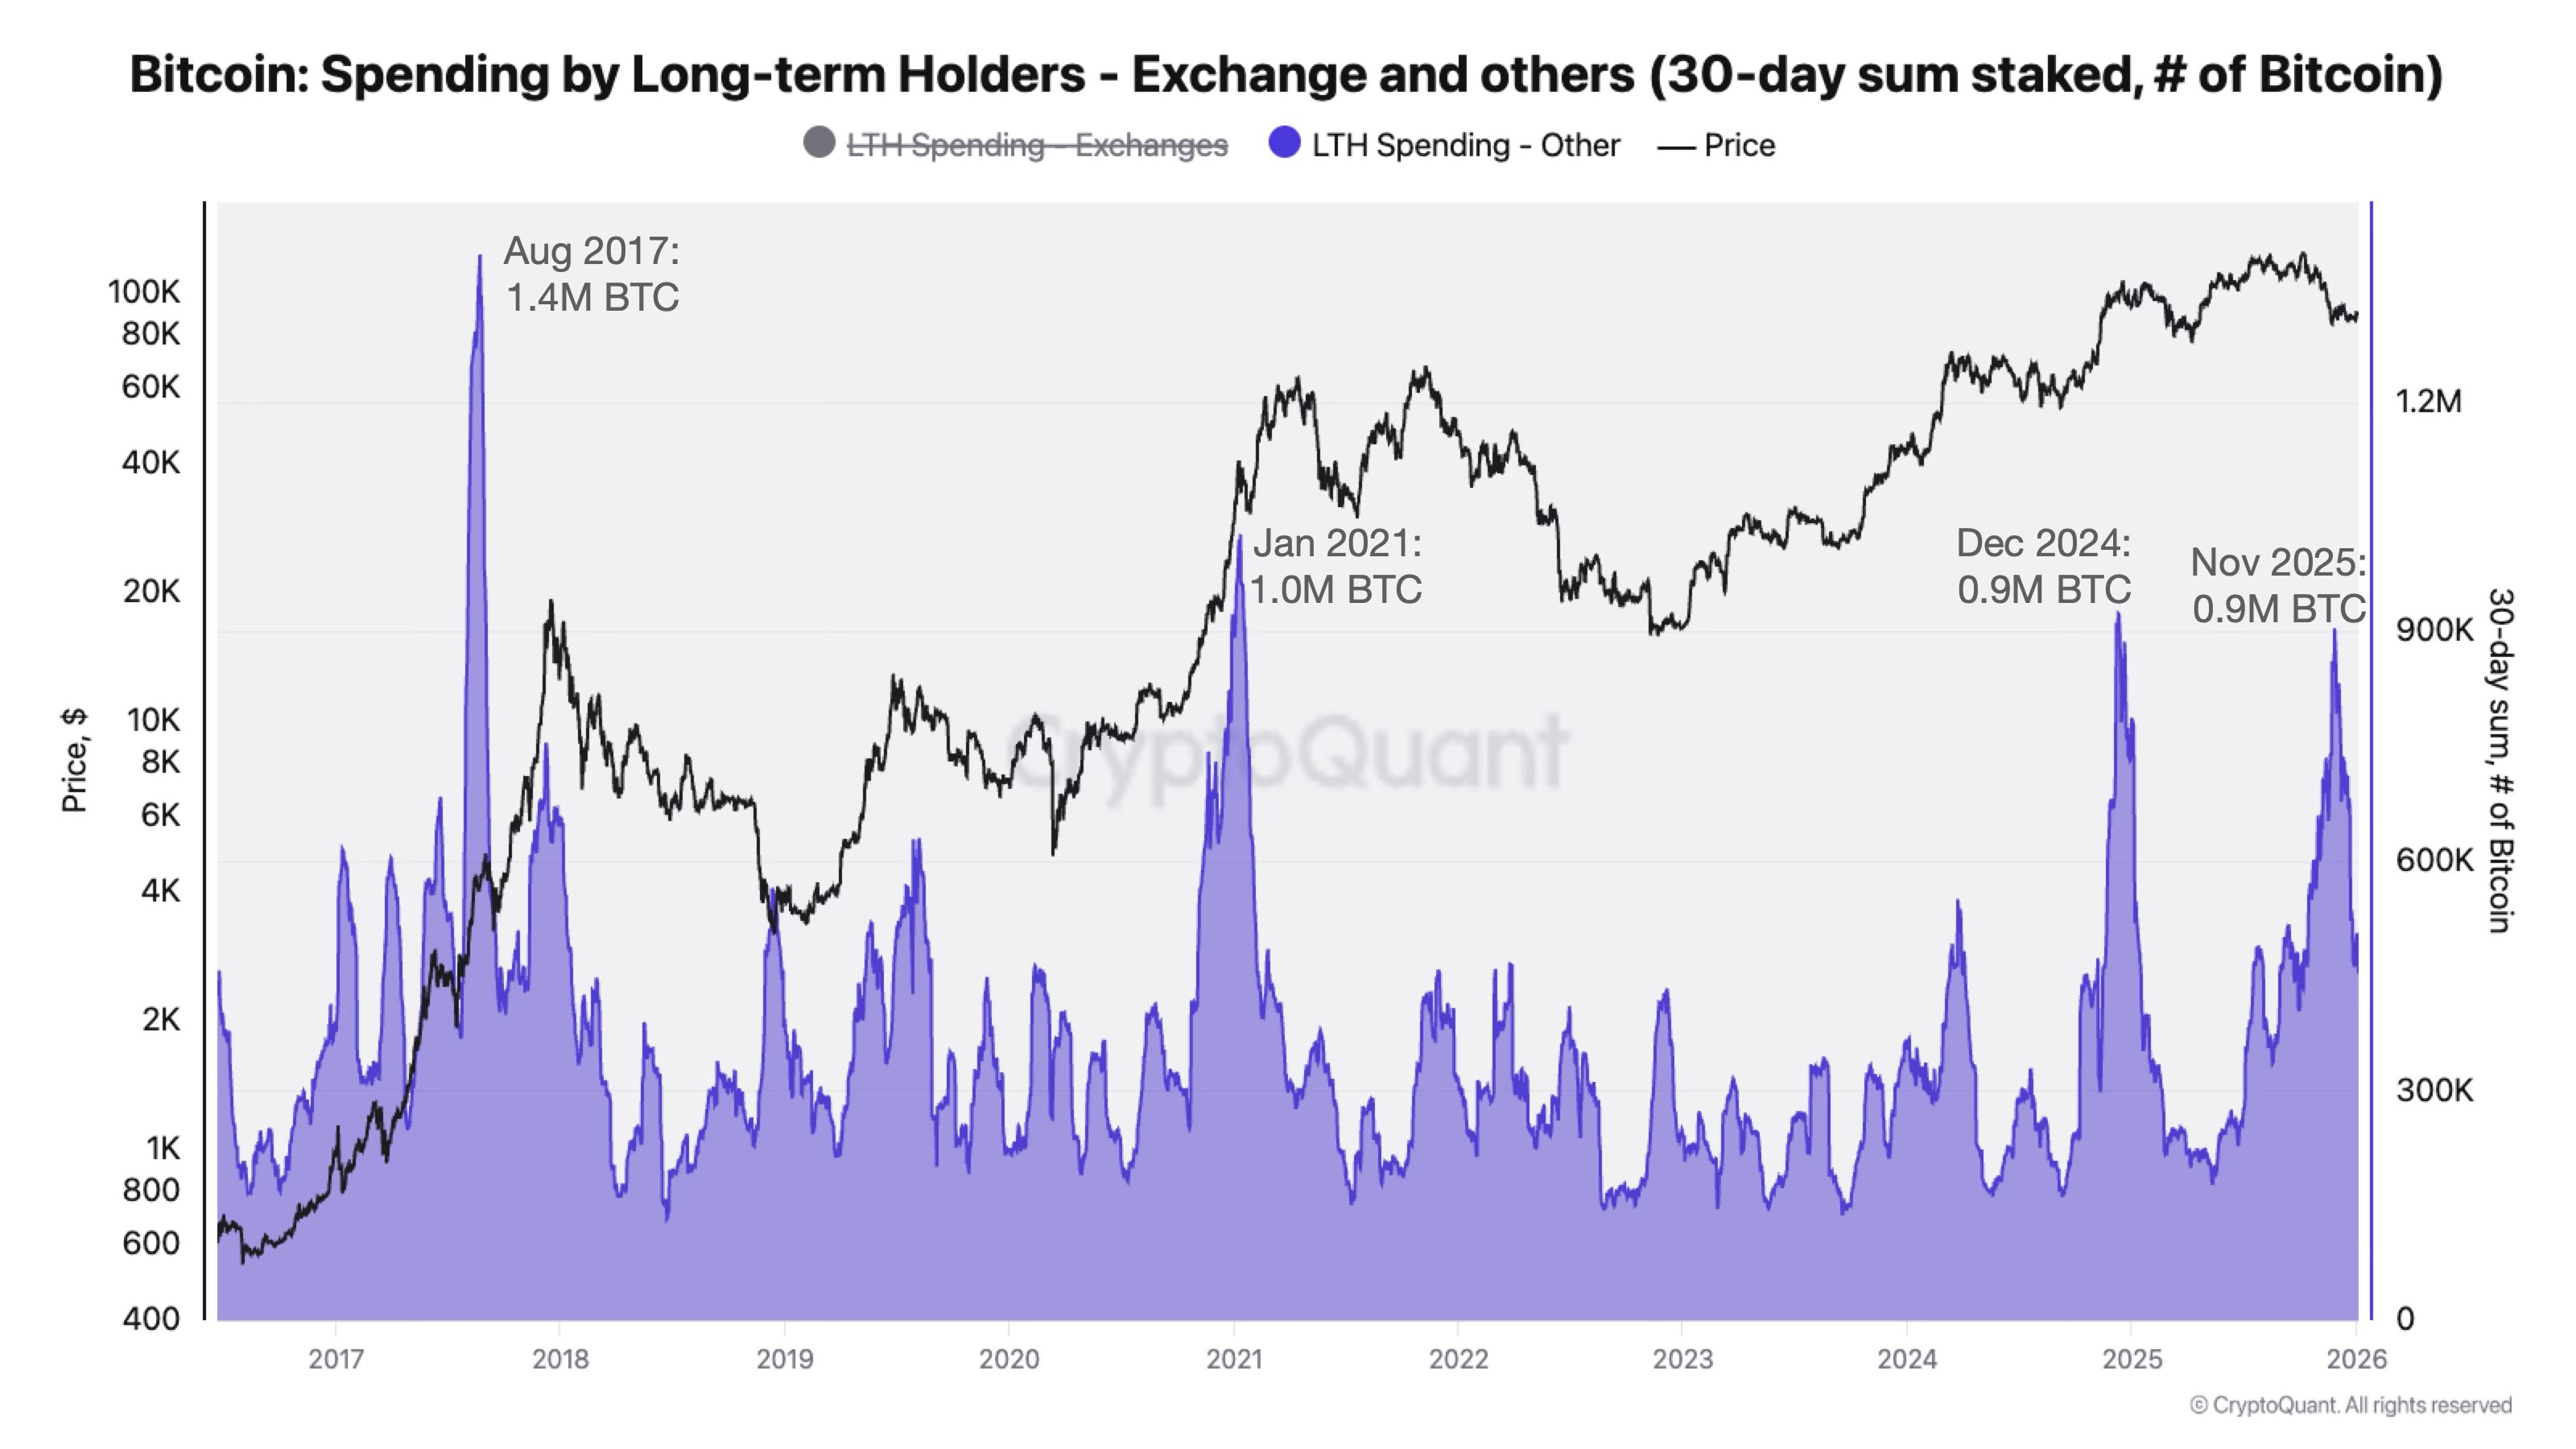
The LTH spending excluding exchanges | Source: @jjcmoreno on X

The record for the highest amount of Bitcoin LTH selling is still maintained by August 2017, which witnessed 1.4 million BTC in movements from the cohort.

BTC Price

At the time of writing, Bitcoin is floating around $93,800, up almost 7% in the last seven days.

Looks like the price of the coin has been climbing over the last few days | Source: BTCUSDT on TradingView

Related Questions

QWhat did CryptoQuant's head of research say about the recent Bitcoin long-term holder selling?

AJulio Moreno stated that the recent high levels of Bitcoin long-term holder selling were inflated by internal exchange transactions, particularly from Coinbase, and not all of it represented true economic selling.

QHow much of the reported 1.55 million BTC LTH selling in November was due to Coinbase internal transfers?

AAccording to CryptoQuant data, at least 0.65 million BTC of the reported selling was due to internal wallet shuffling from Coinbase exchange.

QWhat is the definition of a Bitcoin Long-Term Holder (LTH) according to the article?

AA Bitcoin Long-Term Holder (LTH) is an investor who has been holding onto their coins for a period longer than 155 days.

QWhen did the highest recorded Bitcoin LTH selling occur, and how much was it?

AThe highest recorded Bitcoin LTH selling occurred in August 2017, with 1.4 million BTC in movements from this cohort.

QWhat was Bitcoin's price at the time of writing, and what was its recent performance?

AAt the time of writing, Bitcoin was floating around $93,800, up almost 7% in the last seven days.

Related Reads

Saylor's Purchase of 1550 Bitcoin Is a Bad Trade

**Title: Saylor's Purchase of 1,550 Bitcoins Was a Bad Trade** The article critically analyzes Strategy's recent move of selling 32 bitcoins followed by a much larger purchase of 1,550 bitcoins. While appearing bullish, the author argues this trade is detrimental to MSTR shareholders. The core argument revolves around the concept of "breakeven modified Net Asset Value (mNAV)," a key metric for Strategy. To increase Bitcoin per share (BPS) for MSTR holders, Strategy must issue new shares at a premium high enough that the funds raised can buy more bitcoin than the bitcoin backing each existing share. Currently, this breakeven mNAV is estimated at 1.30. The recent trade failed on two counts: 1. The shares for the $181 million raise were issued at an mNAV *below* the 1.30 breakeven point. Selling "cheap" shares to buy bitcoin actually *reduces* BPS. 2. Only $101.3 million of the raised funds were used to buy bitcoin; the rest went to boost the company's dollar reserves. The breakeven mNAV calculation assumes *100%* of proceeds are used for bitcoin purchases. Diverting funds, even if mNAV were high, dilutes BPS. The result is an estimated 0.19% decrease in Bitcoin per share for MSTR holders. In exchange, Strategy merely extended its operational runway for its dollar reserves from ~6.3 months to 7 months. The author interprets this as Strategy prioritizing the survival and development of its STRC business over its stated core goal of increasing MSTR's BPS. This constitutes a gamble: if sacrificing MSTR value leads to improved market sentiment and a recovery in STRC's price (and thus mNAV), the whole system could work. If not, Strategy may be forced into a cycle of further diluting MSTR to stay afloat, potentially leading to deferred STRC dividends or corporate decline. The article concludes with a hope for price recovery for Bitcoin, MSTR, and STRC.

Foresight News3m ago

Saylor's Purchase of 1550 Bitcoin Is a Bad Trade

Foresight News3m ago

The AI Bear Market Lasting Two Days Is Over; Why Did Funds Buy Back Storage Stocks First?

After a severe two-day selloff in early June that erased over $1 trillion from U.S. chip stock market value, capital is flowing back first to the memory sector. The correction was not driven by a collapse in AI demand but rather a market reassessment of high expectations. Stocks like Broadcom faced selling pressure despite strong AI revenue guidance, signaling a shift in focus from who has an "AI story" to who can most rapidly translate AI demand into verifiable profits and earnings per share (EPS). Memory companies, such as Micron and SK Hynix, are leading the recovery because their EPS growth is more immediately verifiable. The AI server boom directly increases demand for high-bandwidth memory (HBM) and high-capacity server DRAM, tightening supply and driving up contract prices for conventional DRAM and NAND Flash. This price increase, coupled with a shift to higher-margin products, flows directly into near-term revenue and profitability, as evidenced in recent earnings reports. In contrast, other AI semiconductor segments like GPUs, ASICs, and optical modules, while central to the long-term AI infrastructure story, face longer and less certain paths to EPS validation. Their growth depends more on future product cycles, customer adoption timelines, and capital expenditure plans. The rebound in memory stocks highlights a market preference for assets with shorter, more transparent EPS conversion cycles following the recent de-risking phase. However, this does not negate the potential of other AI hardware segments should they provide clearer near-term order visibility. The episode has raised the validation bar for all AI-related investments.

marsbit3m ago

The AI Bear Market Lasting Two Days Is Over; Why Did Funds Buy Back Storage Stocks First?

marsbit3m ago

Monera Digital|Crypto Market May Report: Four Major Reasons Behind the Accelerated Decline

Monera Digital Crypto Market May Report: Four Key Reasons Behind the Accelerated Decline The crypto market experienced a significant downturn in May, driven by an internal liquidity crisis rather than external macro factors. Bitcoin fell from around $82,850 to $73,674, even as traditional markets rallied in the final week, highlighting a clear "liquidity transmission failure" specific to crypto. Four primary internal factors caused the accelerated sell-off: 1. **Major ETF Outflows:** U.S. spot Bitcoin ETFs saw a net outflow of $2.425 billion for the month, the third-largest monthly withdrawal since their launch. Ethereum ETFs also reversed to net outflows. This turned a key pillar of the bull run into a source of selling pressure. 2. **Holder Capitulation:** On-chain data showed textbook "surrender" patterns. The Short-Term Holder MVRV ratio fell below 1.0, indicating this cohort is now in aggregate loss. The Net Unrealized Profit/Loss (NUPL) metric also deteriorated significantly. 3. **Contagious Negative Sentiment:** The Coinbase Premium Index, which shows U.S. institutional buying/selling pressure, turned deeply negative for most of the month. This confirmed the ETF outflows and reflected a strategic shift away from crypto toward assets like U.S. Treasuries. 4. **Leverage Unwinding and Psychological Breaks:** Despite the downturn, futures open interest initially grew, signaling leveraged positioning. This culminated in a sharp deleveraging event with $307 million in long liquidations. Furthermore, the price broke below the critical $75K-$76K support zone, which is both a key gamma option level and the approximate average cost basis for major public companies holding Bitcoin, turning them from potential buyers into potential sellers. The report concludes that the market's pricing power has shifted from macro narratives to internal liquidation. While Bitcoin's 200-week moving average quantile has entered a historical "value zone" at 10.2%, this indicates a deep bear market reset is underway, not an immediate reversal. A sustainable recovery will require both a genuine improvement in the macro liquidity environment and clear signs of renewed on-chain demand, such as ETF inflows resuming and the Coinbase Premium turning positive. Until then, discipline and capital preservation are paramount.

marsbit14m ago

Monera Digital|Crypto Market May Report: Four Major Reasons Behind the Accelerated Decline

marsbit14m ago

Trading

Spot
Futures

Hot Articles

What is $BITCOIN

DIGITAL GOLD ($BITCOIN): A Comprehensive Analysis Introduction to DIGITAL GOLD ($BITCOIN) DIGITAL GOLD ($BITCOIN) is a blockchain-based project operating on the Solana network, which aims to combine the characteristics of traditional precious metals with the innovation of decentralized technologies. While it shares a name with Bitcoin, often referred to as “digital gold” due to its perception as a store of value, DIGITAL GOLD is a separate token designed to create a unique ecosystem within the Web3 landscape. Its goal is to position itself as a viable alternative digital asset, although specifics regarding its applications and functionalities are still developing. What is DIGITAL GOLD ($BITCOIN)? DIGITAL GOLD ($BITCOIN) is a cryptocurrency token explicitly designed for use on the Solana blockchain. In contrast to Bitcoin, which provides a widely recognized value storage role, this token appears to focus on broader applications and characteristics. Notable aspects include: Blockchain Infrastructure: The token is built on the Solana blockchain, known for its capacity to handle high-speed and low-cost transactions. Supply Dynamics: DIGITAL GOLD has a maximum supply capped at 100 quadrillion tokens (100P $BITCOIN), although details regarding its circulating supply are currently undisclosed. Utility: While precise functionalities are not explicitly outlined, there are indications that the token could be utilized for various applications, potentially involving decentralized applications (dApps) or asset tokenization strategies. Who is the Creator of DIGITAL GOLD ($BITCOIN)? At present, the identity of the creators and development team behind DIGITAL GOLD ($BITCOIN) remains unknown. This situation is typical among many innovative projects within the blockchain space, particularly those aligning with decentralized finance and meme coin phenomena. While such anonymity may foster a community-driven culture, it intensifies concerns about governance and accountability. Who are the Investors of DIGITAL GOLD ($BITCOIN)? The available information indicates that DIGITAL GOLD ($BITCOIN) does not have any known institutional backers or prominent venture capital investments. The project seems to operate on a peer-to-peer model focused on community support and adoption rather than traditional funding routes. Its activity and liquidity are primarily situated on decentralized exchanges (DEXs), such as PumpSwap, rather than established centralized trading platforms, further highlighting its grassroots approach. How DIGITAL GOLD ($BITCOIN) Works The operational mechanics of DIGITAL GOLD ($BITCOIN) can be elaborated on based on its blockchain design and network attributes: Consensus Mechanism: By leveraging Solana’s unique proof-of-history (PoH) combined with a proof-of-stake (PoS) model, the project ensures efficient transaction validation contributing to the network's high performance. Tokenomics: While specific deflationary mechanisms have not been extensively detailed, the vast maximum token supply implies that it may cater to microtransactions or niche use cases that are still to be defined. Interoperability: There exists the potential for integration with Solana’s broader ecosystem, including various decentralized finance (DeFi) platforms. However, the details regarding specific integrations remain unspecified. Timeline of Key Events Here is a timeline that highlights significant milestones concerning DIGITAL GOLD ($BITCOIN): 2023: The initial deployment of the token occurs on the Solana blockchain, marked by its contract address. 2024: DIGITAL GOLD gains visibility as it becomes available for trading on decentralized exchanges like PumpSwap, allowing users to trade it against SOL. 2025: The project witnesses sporadic trading activity and potential interest in community-led engagements, although no noteworthy partnerships or technical advancements have been documented as of yet. Critical Analysis Strengths Scalability: The underlying Solana infrastructure supports high transaction volumes, which could enhance the utility of $BITCOIN in various transaction scenarios. Accessibility: The potential low trading price per token could attract retail investors, facilitating wider participation due to fractional ownership opportunities. Risks Lack of Transparency: The absence of publicly known backers, developers, or an audit process may yield skepticism regarding the project's sustainability and trustworthiness. Market Volatility: The trading activity is heavily reliant on speculative behavior, which can result in significant price volatility and uncertainty for investors. Conclusion DIGITAL GOLD ($BITCOIN) emerges as an intriguing yet ambiguous project within the rapidly evolving Solana ecosystem. While it attempts to leverage the “digital gold” narrative, its departure from Bitcoin's established role as a store of value underscores the need for a clearer differentiation of its intended utility and governance structure. Future acceptance and adoption will likely depend on addressing the current opacity and defining its operational and economic strategies more explicitly. Note: This report encompasses synthesised information available as of October 2023, and developments may have transpired beyond the research period.

363 Total ViewsPublished 2025.05.13Updated 2025.05.13

What is $BITCOIN

Discussions

Welcome to the HTX Community. Here, you can stay informed about the latest platform developments and gain access to professional market insights. Users' opinions on the price of BTC (BTC) are presented below.

活动图片