Bitcoin On-Chain Signals Delay Bull Thesis: MVRV Model Projects Recovery Next Cycle

bitcoinistPublished on 2025-12-13Last updated on 2025-12-13

Abstract

Based on on-chain analysis by Axel Adler, Bitcoin's failure to reclaim higher prices and weakening market structure suggest a deeper bearish phase is underway. Key indicators like declining momentum, reduced demand, persistent sell pressure, and deteriorating liquidity all point to sustained downward pressure. A critical signal is the deeply negative and worsening 30-day to 365-day MVRV spread, which measures profitability differences between short-term and long-term holders. This signals risk aversion and exhaustion. Historically, a crossover of this spread marks the transition to a bull market, but Adler's model suggests this is not imminent and projects the next likely window for a structural recovery is in the second half of 2026. Short-term rallies are more likely to be counter-trend bounces rather than the start of a new sustainable bull run.

Bitcoin has failed to reclaim higher prices, reinforcing the growing belief that the market may be entering a deeper bearish phase. After multiple attempts to push above key resistance levels, BTC continues to trade sideways with declining momentum, reflecting a clear shift in investor sentiment. Fear is rising across the market, and price action has yet to show any convincing signs of recovery.

According to new data shared by Axel Adler, several structural on-chain and market indicators now support a continuation of bearish conditions in the months ahead. Adler’s analysis points to weakening demand, persistent sell pressure, and deteriorating liquidity—factors that historically precede prolonged corrective periods.

While Bitcoin has held above critical support zones, its inability to establish higher highs or sustain rebounds suggests that buyers remain cautious and largely defensive.

Moreover, broader market conditions show similar fragility, with derivatives positioning, stablecoin flows, and long-term holder behavior all signaling reduced conviction. This confluence of factors strengthens the bearish thesis and implies that volatility could intensify before the market finds a meaningful bottom.

Bitcoin MVRV Spread Signals a Deep Bear Phase

Adler’s analysis highlights one of the clearest structural indicators pointing toward sustained bearish conditions: the Bitcoin MVRV Z-Score Bull vs. Bear Market model. Specifically, he notes that the 30-day to 365-day MVRV spread is deeply negative and continues to deteriorate.

This spread measures the difference in profitability between short-term and long-term holders, and when the short-term cohort is underperforming significantly, it traditionally signals risk aversion, exhaustion, and weakening demand.

Bitcoin MVRV Z-Score Bull vs Bear Market | Source: Axel Adler

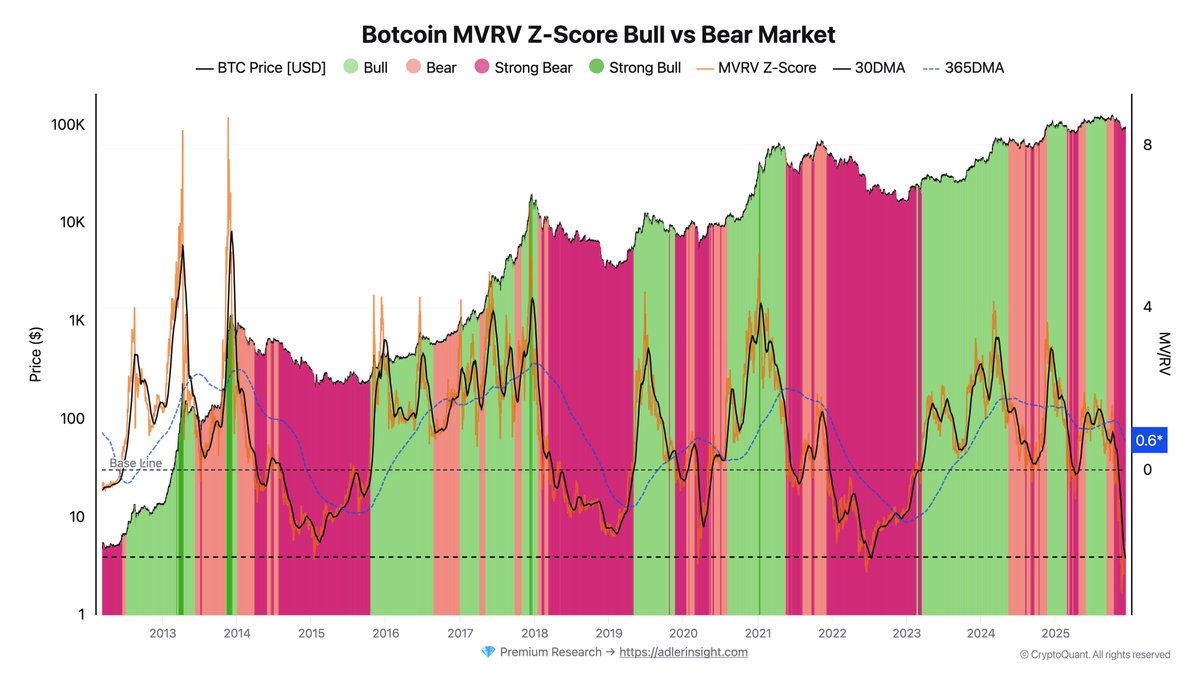
A crossover—when the 30-day MVRV rises above the 365-day metric—has historically marked the transition from bear markets into new bullish phases. However, Adler stresses that such a crossover does not appear imminent under current conditions. The spread remains far below the threshold required for a structural reversal, reinforcing the view that Bitcoin is still entrenched in a deep bear phase within this model’s framework.

Cycle analogs further support this interpretation. Reviewing past market cycles, Adler estimates that the next likely window for a meaningful crossover sits in the second half of 2026. This implies that even if short-term rallies occur, they are more likely to be counter-trend bounces rather than the early stages of a sustainable bull market. Until the MVRV structure improves, broader sentiment may remain decisively bearish.

Related Reads

The Crisis Behind Silver's Surge: When the Paper System Begins to Fail

Silver has emerged as the star performer in the precious metals market, with its price surging nearly 110% year-to-date, far outpacing gold's 60% gain. This dramatic rise, driven by seemingly rational factors like Fed rate cut expectations and strong industrial demand from solar, EVs, and AI, masks a deeper and more dangerous reality. The core of the crisis lies in the market's structure. Unlike gold, which is backed by central bank purchases, silver is an "island asset" with almost no official reserves and a much smaller, less liquid market. Its daily trading volume is a fraction of gold's. The rally is increasingly fueled by a futures market squeeze, where paper contracts (derivatives, ETFs) vastly outweigh physical metal. This has created a dangerous inversion where futures prices trade at a persistent premium to spot—a sign of potential market manipulation or a short squeeze. A major red flag is the surge in physical silver withdrawals from key exchanges like COMEX, LBMA, and Shanghai. Investors are increasingly demanding physical delivery, distrusting the "paper silver" system. This has led to plunging exchange inventories, exposing the system's fragility: a small physical base supports a massive pyramid of paper claims. Suspicions of market manipulation are heightened by the dominant role of JPMorgan, which holds nearly half of COMEX silver inventory and is the custodian for a major silver ETF. While no wrongdoing is proven, its immense influence over both physical supply and paper markets places it at the center of the volatility. Ultimately, the silver surge signals a broader crisis of confidence in financialized paper assets. A global shift is underway from financial instruments to physical possession, a movement driven by de-dollarization and a quest for certainty. The rules of the game are changing: when the music stops, only those holding real metal will have a seat.

marsbit30m ago

The Crisis Behind Silver's Surge: When the Paper System Begins to Fail

marsbit30m ago

Trading

Spot
Futures
活动图片