Author: Claude, Deep Chao TechFlow
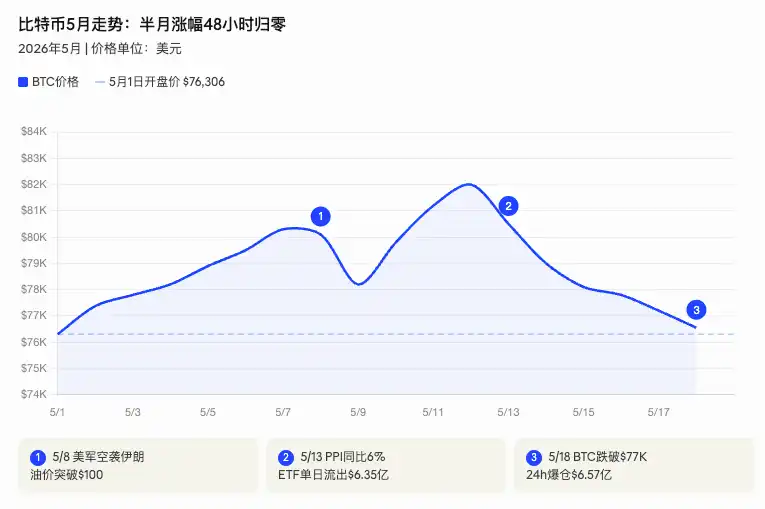
Deep Chao Insight: Bitcoin fell below $77,000 on Monday, retreating to its opening level from May 1st, wiping out half a month's gains within 48 hours. The triggers overlapped densely: U.S. April PPI surged 6% year-over-year, hitting a three-year high; Bitcoin spot ETFs recorded a weekly net outflow exceeding $1 billion, ending six consecutive weeks of inflows; the crypto market saw $657 million in liquidations within 24 hours. While retail investors fled in panic, Strategy Group bucked the trend, spending $2 billion to add nearly 25,000 BTC. Meanwhile, Goldman Sachs liquidated all its XRP and Solana ETF holdings in Q1, slashed its Ethereum exposure by 70%, and retained only $700 million in Bitcoin ETFs. Institutional choices are becoming increasingly clear: either avoid crypto entirely, or only touch Bitcoin.
Bitcoin briefly dropped to $76,551 during Monday's Asian trading session, its lowest level since May 1st. According to a Bloomberg report on May 18th, widespread risk aversion triggered by Middle East tensions prompted traders to slash positions significantly, with the crypto market seeing nearly $500 million in liquidations within 15 minutes.
What does this price signify? On May 1st, Bitcoin opened around $76,306. Over the following two weeks, it climbed to above $82,000, then declined for four consecutive trading days, erasing all of May's gains. For traders who chased the rally mid-month, turning from floating profits to floating losses within 48 hours happened too fast to react.
PPI Soars 6% Year-Over-Year, Hitting Three-Year High, Rate Hike Probability Rises to 39%
The fuse that ignited this round of selling was the U.S. April Producer Price Index (PPI) released on May 13th. According to data from the U.S. Bureau of Labor Statistics, PPI rose 1.4% month-over-month, the largest monthly increase since March 2022; it surged 6% year-over-year, the highest level since December 2022, far exceeding market expectations of 4.9%.
Energy prices were the main driver. Gasoline prices jumped 15.6% month-over-month in April, diesel prices rose 12.6%, and the impact of the Iran conflict on the energy complex is transmitting down the supply chain. Even excluding food and energy, the core PPI still rose 1% month-over-month and reached 5.2% year-over-year, indicating price pressure is no longer confined to the pump.
High Frequency Economics Chief Economist Carl Weinberg warned after the PPI report that the data would sound alarms at both the Federal Reserve and financial markets. The CME FedWatch tool shows the market's pricing for a 25 basis point rate hike this year has risen to about 39%, with expectations for a rate cut this year largely eliminated.
Just one day before the PPI data, April CPI rose to 3.8% year-over-year, the highest since May 2023. According to CNN, several economists raised their forecasts for May CPI after the PPI release, expecting it to exceed 4%. The transmission of wholesale prices to the consumer end is accelerating.
ETF Six-Week Inflow Streak Ends, Weekly Net Outflow Exceeds $1 Billion
Macro pressures quickly transmitted to the institutional capital level. According to SoSoValue data, for the week ending May 15th, U.S. Bitcoin spot ETFs recorded a net outflow of approximately $1 billion, ending six consecutive weeks of net inflows. A CoinShares report on May 18th showed digital asset investment products overall saw a net outflow of $1.07 billion, the third-largest weekly outflow of 2026.
James Butterfill, Head of Research at CoinShares, stated this shift "may reflect geopolitical risk aversion triggered by developments related to Iran."
The total net inflow over the previous six weeks was about $3.4 billion, averaging about $568 million per week, with April alone seeing inflows of $1.97 billion, the strongest monthly performance of 2026. This accumulation was reversed intensively this week. May 13th saw a single-day net outflow of $635 million, the largest daily decline of the week; on May 15th, none of the 11 Bitcoin ETFs recorded positive inflows, with another $290 million outflow.
Ethereum spot ETFs also suffered five consecutive days of outflows, with a weekly net outflow of $255 million. By the weekend, Bitcoin ETF cumulative net inflows still stood at $58.34 billion, with total assets under management around $104.29 billion.
$657 Million in Liquidations, 89% Long Positions
As ETF capital fled, the derivatives market experienced a brutal long squeeze. According to Coinglass data, total crypto market liquidations within 24 hours reached $657 million, with long positions accounting for about 89%. According to bitcoin.com, $584 million came from long positions. The Fear & Greed Index plummeted from a neutral 50 a few days earlier to 29, entering the fear zone.
The domino effect of leveraged liquidations accelerated the decline. Bitcoin triggered a large number of stop-loss and forced liquidation orders after breaking below key support, forming a "liquidation → selling → more liquidation" spiral. LMAX crypto strategist Joel Kruger described this process as "forced position closures and position washouts" pushing Bitcoin below key technical support.
Bitcoin is currently hovering in the $76,000 to $76,800 range, with the 50-day moving average around $76,716 providing short-term support, and the 200-day moving average around $83,513 acting as resistance above.
Strategy Group Adds 20,000 BTC Against the Trend, Saylor Not Reading the Same Sentiment Report
While retail investors were liquidated and ETFs bled, Strategy Group (formerly MicroStrategy) operated in the opposite direction during the same period.
According to an 8-K filing with the SEC on May 18th, the company purchased 24,869 Bitcoin for approximately $2.01 billion between May 11th and 17th, at an average price of $80,985. This transaction brought Strategy's total holdings to 843,738 BTC, with a total cost of about $63.87 billion and an average price of around $75,700. This purchase was primarily funded through the sale of STRC preferred stock.
Strategy also disclosed that its "BTC yield" for the year-to-date 2026 (a metric measuring Bitcoin holdings relative to diluted share count growth) reached 12.6%.
This isn't the first time Saylor has added during market panic. Throughout 2026, Strategy has maintained a near-weekly or bi-weekly purchase rhythm, regardless of market ups and downs. From January to May, the company increased its holdings from about 560,000 BTC to over 840,000, adding nearly 60,000 new BTC per month on average. In the same week everyone was watching PPI data and ETF outflow data, he spent another $2 billion buying.
Goldman Sachs Liquidates XRP and Solana ETFs in Q1, Keeps Only Bitcoin
If Strategy's actions represent the "Bitcoin maximalist" stance, Goldman Sachs' Q1 13F holdings report presents a more representative institutional choice.
According to Goldman's latest Q1 2026 13F report, the bank completely liquidated all its XRP and Solana ETF holdings in the first quarter. At the end of the previous quarter, Goldman held about $154 million in XRP-related ETFs (distributed across issuers like Bitwise, Franklin Templeton, Grayscale, and 21Shares), and over $100 million in Solana-related ETFs. Now both positions are zero.
Ethereum ETF exposure was cut by about 70%, reduced from previous levels to around $114 million. The Bitcoin ETF position remained largely unchanged at around $700-720 million, with only a slight reduction of about 10%.
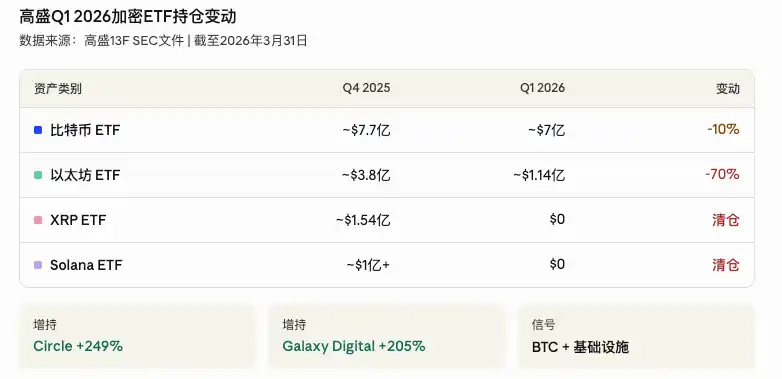
At the same time, Goldman increased its holdings in crypto infrastructure stocks: Circle holdings increased 249%, Galaxy Digital holdings increased 205%, and Coinbase also saw an increase. The signal from this set of actions is clear: Goldman hasn't exited crypto, but is narrowing its bets—shifting from "casting a wide net" back to "BTC-only."
According to a CCN report, the Harvard University Endowment also reduced its Bitcoin ETF holdings by 43% during the same period and completely exited Ethereum ETFs. Institutions are synchronizing a concentration of their crypto exposure by asset type.