Analyst Reveals Bitcoin Strategy With 250% Potential Upside — Key Entry Levels Identified

bitcoinistPublished on 2026-03-09Last updated on 2026-03-09

Abstract

A popular crypto analyst, Ali Martinez, has outlined a Bitcoin buy-and-hold strategy with a potential upside of over 250%. The plan is based on the Cumulative Value Days Destroyed (CVDD) indicator, an on-chain metric used to identify long-term support and resistance levels. The analysis suggests that Bitcoin's price could bottom out around the CVDD line at approximately $49,330, which has historically acted as a cycle bottom and a prime accumulation zone. From this entry point, the strategy identifies two key profit-taking levels: $178,478 (the CVDD 3.618x line) and $273,158 (the Alpha CVDD line). A move from the suggested entry to the first target would represent a gain of over 260%. At the time of writing, Bitcoin price is approximately $67,350, down over 1% in the past 24 hours.

A popular crypto analyst on the social media platform X has shared a buy-and-hold strategy for Bitcoin, which could potentially yield over 250% gain in the near future.

BTC Price To Bottom Out Around $49,000?

In a recent post on the X platform, market pundit Ali Martinez put forward an exciting trade plan for Bitcoin, the world’s largest cryptocurrency by market capitalization. This strategy revolves around the CVDD (Cumulative Value Days Destroyed) Channel.

CVDD is an on-chain technical indicator based on the volume of aged capital being sent into the market. This on-chain metric is typically used in highlighting zones of long-term support or resistance based on the movement of long-held coins.

The Cumulative Value Days Destroyed line, which is typically the lowest line in the channel, signals a phase of severe undervaluation. The channel extensions (the resistance bands, which are usually the targets during bull markets) are then created by applying Fibonacci multiples to the base CVDD line.

From a historical perspective, the Bitcoin price has never dropped below the CVDD line (the base line of the channel), marking it as a relevant indicator for identifying cycle bottoms. Hence, the line is often considered a primary accumulation zone, where investors often bet on a price reversal.
Source: @ali_charts on X

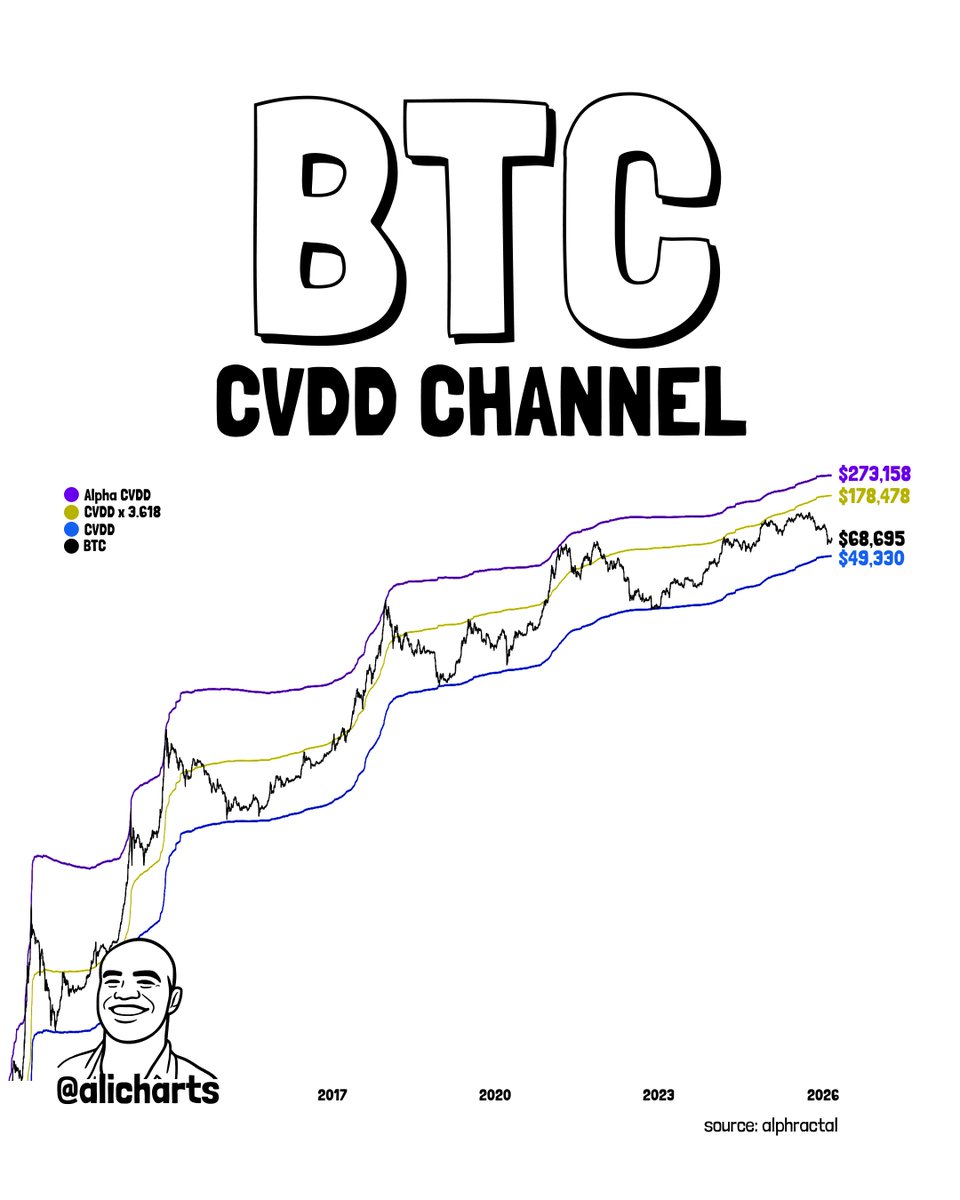
As shown in the highlighted chart, this CVDD line (blue) is currently around $49,330, representing the potential Bitcoin bottom in this bearish phase. According to Martinez, this price point also represents the perfect spot to take a position in the flagship cryptocurrency.

Next, the market analyst says to take profit from this trade at the resistance levels around $178,478 or $273,158. These $178,478 and $273,158 resistance levels are the CVDD 3.618x and Alpha CVDD lines, respectively, of the channel, and they represent potential cycle tops for the Bitcoin price.

If the price of BTC indeed soars from $49,330 to at least the $178,478 top, that would represent an over 260% rally in one cycle. Meanwhile, it would take a further 53% upside movement from $178,478 toward the next resistance level.

Bitcoin Price Overview

As of this writing, the price of BTC stands at around $67,350, reflecting a more than 1% decline in the past 24 hours. According to data from CoinGecko, the premier cryptocurrency is barely up by 1% kn the weekly timeframe.

The price of BTC on the daily timeframe | Source: BTCUSDT chart on TradingView


Related Questions

QWhat is the CVDD indicator and how is it used in the Bitcoin strategy mentioned?

ACVDD (Cumulative Value Days Destroyed) is an on-chain technical indicator based on the volume of aged capital being sent into the market. It is used to highlight zones of long-term support or resistance based on the movement of long-held coins. In this strategy, the CVDD line (approximately $49,330) is identified as a potential cycle bottom and accumulation zone, while its Fibonacci multiples ($178,478 and $273,158) represent potential cycle tops for taking profits.

QAccording to Ali Martinez, what are the key entry and profit-taking levels for Bitcoin in this strategy?

AThe key entry level is near $49,330, which is the CVDD line and potential bottom. The profit-taking levels are between $178,478 (CVDD 3.618x) and $273,158 (Alpha CVDD line), representing potential cycle tops.

QWhat potential percentage gain does this strategy offer if Bitcoin reaches the first profit target?

AIf Bitcoin rises from the entry point of $49,330 to the first profit target of $178,478, it would represent a gain of over 260%.

QWhat is the current price of Bitcoin and its recent performance as mentioned in the article?

AAs of the writing of the article, the price is around $67,350, reflecting a more than 1% decline in the past 24 hours and a barely 1% increase on the weekly timeframe.

QWhy is the CVDD line considered a significant indicator for identifying cycle bottoms in Bitcoin?

AFrom a historical perspective, the Bitcoin price has never dropped below the CVDD line, marking it as a relevant indicator for identifying cycle bottoms. It is often considered a primary accumulation zone where investors bet on a price reversal.

Related Reads

Wall Street Rushes into Ethereum, but Has It Become a Castoff for Investors?

Wall Street Embraces Ethereum, But Investors Remain Wary Ethereum is gaining significant institutional adoption from major financial firms like JPMorgan Chase, Robinhood, and Morgan Stanley, which are launching products and building on the network. A new non-profit, Ethereum Institutional, has also been formed to accelerate enterprise use. Technically, Ethereum co-founder Vitalik Buterin has unveiled a major multi-year upgrade plan called "Lean Ethereum," aiming to enhance privacy, security, and quantum resistance. Despite these positive fundamentals, the market reaction has been negative. ETH's price remains around $1,900, down over 60% from its all-time high. Analysts cite weak investor demand and persistent outflows from spot Ethereum ETFs. Citi has downgraded its 12-month price target to $2,240. A key challenge is the decoupling of network activity from ETH's value accrual. While Layer 2 scaling solutions have successfully reduced costs and increased throughput, most transactions now occur off the mainchain. This reduces the fee revenue and ETH burn on Ethereum itself, benefiting users but creating uncertainty for ETH holders. Price predictions are highly divergent, ranging from Citi's conservative $2,000+ outlook to StanChart's $4,000 by 2026 and even a long-term $25,000 forecast from Tom Lee. The consensus is that while Ethereum is increasingly likely to become core financial infrastructure, the extent to which ETH token holders will benefit remains unclear.

marsbit30m ago

Wall Street Rushes into Ethereum, but Has It Become a Castoff for Investors?

marsbit30m ago

Trading

Spot
活动图片